Extragalactic H2O masers and X-ray absorbing column densities ††thanks: Based on observations with the 100-m telescope of the MPIfR (Max-Planck-Institut für Radioastronomie) at Effelsberg ††thanks: M. Kadler, present address: Exploration of the Universe Division, Code 662, NASA/Goddard Space Flight Center, 4800 Greenbelt Road, Greenbelt, MD 20771, USA
Having conducted a search for the 1.3 cm (22 GHz) water vapor line towards galaxies with nuclear activity, large nuclear column densities or high infrared luminosities, we present H2O spectra for NGC 2273, UGC 5101, and NGC 3393 with isotropic luminosities of 7, 1500, and 400 L⊙. The H2O maser in UGC 5101 is by far the most luminous yet found in an ultraluminous infrared galaxy. NGC 3393 reveals the classic spectrum of a ‘disk maser’, represented by three distinct groups of Doppler components. As in all other known cases except NGC 4258, the rotation velocity of the putative masing disk is well below 1000 km s-1. Based on the literature and archive data, X-ray absorbing column densities are compiled for the 64 galaxies with reported maser sources beyond the Magellanic Clouds. For NGC 2782 and NGC 5728, we present Chandra archive data that indicate the presence of an active galactic nucleus in both galaxies. Modeling the hard nuclear X-ray emission, NGC 2782 is best fit by a high energy reflection spectrum with 1024 cm-2. For NGC 5728, partial absorption with a power law spectrum indicates 81023 cm-2. The correlation between absorbing column and H2O emission is analyzed. There is a striking difference between kilo- and megamasers with megamasers being associated with higher column densities. All kilomasers (10 L⊙) except NGC 2273 and NGC 5194 are Compton-thin, i.e. their absorbing columns are 1024cm-2. Among the H2O megamasers, 50% arise from Compton-thick and 85% from heavily obscured (1023cm-2) active galactic nuclei. These values are not larger but consistent with those from samples of Seyfert 2 galaxies not selected on the basis of maser emission. The similarity in column densities can be explained by small deviations in position between maser spots and nuclear X-ray source and a high degree of clumpiness in the circumnuclear interstellar medium.
Key Words.:
masers – galaxies: active – galaxies: nuclei – galaxies: statistics – radio lines: galaxies – X-rays: galaxies1 Introduction
The line of ortho-H2O at 22 GHz (1.3 cm) is one of the strongest and most remarkable spectral features of the electromagnetic spectrum. The transition, connecting levels located approximately 645 K above the ground state, traces warm (400 K) and dense ((H107 cm-3) molecular gas (e.g. Kylafis & Norman 1987, 1991). Observed as a maser, the line can reach isotropic luminosities in excess of 104 L⊙ (Barvainis & Antonucci 2005). Being traditionally known to trace oxygen-rich red giant stars and to pinpoint sites of (massive) star formation, it has more recently become a major tool to determine geometric distances and three dimensional motions of nearby galaxies and to elucidate the nuclear environment of active galaxies, allowing us to map accretion disks and to determine masses of nuclear engines (for recent reviews, see Greenhill 2002, 2004; Maloney 2002; Henkel & Braatz 2003; Morganti et al. 2004; Henkel et al. 2005a; Lo 2005; for 3-D motions, see Brunthaler et al. 2005).
Extragalactic H2O masers have been observed for a quarter of a century (Churchwell et al. 1977) and emission has been reported from more than 60 galaxies (e.g., Henkel et al. 2005b, Kondratko et al. 2006). The masers can be classified as related (1) to star formation, (2) to nuclear accretion disks (‘disk-masers’), (3) to interactions of nuclear jet(s) with ambient molecular clouds or to amplification of the jet’s seed photons by suitably located foreground clouds (‘jet-masers’) and (4) to nuclear outflows. H2O masers with apparent (isotropic) luminosities 10 L⊙, often associated with sites of massive star formation, are referred to as ‘kilomasers’, while the stronger sources, known to arise from the innermost parsecs of their parent galaxy, are referred to as ‘megamasers’. The statistical properties of the sample of extragalactic H2O masers are not well explored. The first and last such comprehensive study, that of Braatz et al. (1997), dates back to when little more than a dozen sources were known.
In order to improve our knowledge of the statistical properties of the greatly enlarged maser sample, we analyze the correlation between maser emission and X-ray absorbing column density toward the nuclear engine. In Sects. 2–3 we summarize recent observations and show spectra of sources detected in this work. In Sect. 4, we present X-ray column densities for the entire extragalactic maser sample, including a detailed analysis of Chandra archive data of the megamaser galaxies NGC 2782 and NGC 5728. Specific statistical properties of the sample involving X-ray absorbing columns and maser luminosities are discussed in Sect. 5. Sect. 6 summarizes the main results.
2 Observations
Our measurements were obtained with the 100-m telescope of the MPIfR at Effelsberg in June 2001, October 2004 and January and February 2005. The full beam width to half power was 40′′. A dual channel HEMT receiver provided system temperatures of 100–350 K on a main beam brightness temperature scale. The observations were carried out in a dual beam switching mode with a beam throw of 2′ and a switching frequency of 1 Hz. The autocorrelator backend was split into eight bands of width 40 or 80 MHz and 512 or 256 channels. Each band could be shifted individually by up to 250 MHz (3000 km s-1) relative to the recessional velocity of the galaxy. Channel spacings were 1 and 4 km s-1.
The pointing accuracy was better than 10′′. Calibration was obtained by measuring NGC 7027, 3C286, or W3(OH) (for flux densities, see Baars et al. 1977; Ott et al. 1994). The data were reduced using the CLASS and GREG packages of the GILDAS software.
| Source | R.A. | Dec. | Typea) | –range | rms | Channel | Epochc) | |||||
|---|---|---|---|---|---|---|---|---|---|---|---|---|
| (log) | Width | |||||||||||
| ( 2000) | (c) | (km s-1) | (mJy) | (km s-1) | (cm-2) | |||||||
| NGC 1667 | 04 48 37.1 | 06 19 12 | 4547 | Sy 2 | 11.0 | 4000– | 5100 | 10 | 1.1 | 0205 | B; B99 | |
| NGC 2273 | 06 50 08.7 | +60 50 45 | 1840 | Sy 2 | 10.1 | 1400– | 2400 | 9 | 1.1 | 0105 | X; Gua05 | |
| IRAS 07145–2914 | 07 16 31.2 | 29 19 29 | 1698 | Sy 2 | 10.0 | 1100– | 2200 | 77 | 1.1 | 1004 | B; B99 | |
| 1050– | 2200 | 35 | 1.1 | 0105 | ||||||||
| UGC 5101 | 09 35 51.6 | +61 21 11 | 11809 | ULIRG | 11.9 | 10550– | 12800 | 2 | 4.2 | 1004 | C; Arm04 | |
| NGC 2992e) | 09 45 42.0 | 14 19 35 | 2311 | Sy 1.9 | 1770– | 2900 | 11 | 1.1 | 0205 | B; Gua05 | ||
| NGC 3393 | 10 48 23.4 | 25 09 43 | 3750 | Sy 2 | 10.4 | 2880– | 4800 | 14 | 4.2 | 0105 | X; Gua05 | |
| IRAS 11058–1131 | 11 08 20.3 | 11 48 12 | 16437 | Sy 2 | 11.2 | 15500– | 17500 | 7 | 4.2 | 0105 | B; Ris00 | |
| NGC 4418 | 12 26 54.6 | 00 52 39 | 2179 | Sy 2 | 10.9 | 1550– | 2900 | 33 | 1.1 | 1004 | C; Mai03 | |
| Mrk 231 | 12 56 14.2 | +56 52 25 | 12642 | ULIRG | 12.2 | 12050– | 13200 | 7 | 1.1 | 0205 | X,B; Bra04 | |
| NGC 4939e) | 13 04 14.4 | 10 20 23 | 3110 | Sy 2 | 10.3 | 2500– | 3770 | 8 | 1.1 | 0105 | X; Gua05 | |
| 2570– | 3700 | 11 | 1.1 | 0205 | ||||||||
| NGC 4968 | 13 07 06.0 | 23 40 37 | 2957 | Sy 2 | 10.2 | 2300– | 3660 | 30 | 1.1 | 1004 | B; B99 | |
| NGC 5005e) | 13 10 56.2 | +37 03 33 | 946 | LINER | 10.2 | 400– | 1550 | 10 | 1.1 | 0205 | B; Ris99 | |
| X; Gua05 | ||||||||||||
| Mrk 668 | 14 07 00.4 | +28 27 15 | 22957 | RL | 22340– | 23630 | 9 | 1.1 | 1004 | X; Gua04 | ||
| Arp 220e) | 15 34 57.1 | +23 30 11 | 5434 | ULIRG | 12.1 | 5250– | 5720 | 13 | 1.1 | 0601 | 0.3 | C; Cle02 |
| NGC 6552 | 18 00 07.3 | +66 36 54 | 7942 | Sy 2 | 11.0 | 7400– | 8500 | 9 | 1.1 | 1004 | A; B99 | |
| 7400– | 8500 | 8 | 1.1 | 0205 | ||||||||
| TXS 1946+708 | 19 45 53.5 | +70 55 49 | 30228 | RL | 29000– | 31650 | 5 | 4.2 | 1004 | B; Ris03 | ||
| IRAS 20210+1121 | 20 23 25.4 | +11 31 35 | 16905 | Sy 2 | 11.7 | 16650– | 17200 | 8 | 1.1 | 0105 | B; Delu04 | |
| NGC 7674 | 23 27 56.7 | +08 46 45 | 8671 | Sy 2 | 11.5 | 8100– | 9380 | 19 | 1.1 | 0105 | B; B99 | |
a) LINER = Low Ionization Nuclear Emission Line Region; RL = Radio Loud; Sy = Seyfert; ULIRG = UltraLuminous InfraRed Galaxy
b) Infrared flux densities taken from the IRAS Point Source Catalog (Fullmer & Lonsdale 1989) or from NED were converted into
far infrared luminosities following the procedure outlined by Wouterloot & Walmsley (1986); =75 km s-1 Mpc-1;
the values given are the logarithms of the infrared luminosity in solar units
c) Month (first two digits) and year (last two digits)
d) Notes concerning X-ray absorbing hydrogen column densities:
X-ray telescope: A: ASCA; B: BeppoSAX; C: Chandra; X: XMM-Newton;
References: Arm04: Armus et al. (2004); B99: Bassani et al. (1999); Bra04: Braito et al. (2004); Cle02: Clements et al. (2002);
Delu04: Deluit (2004); Gua04: Guainazzi et al. (2004a); Gua05: Guainazzi et al. (2005a); Mai03: Maiolino et al. (2003);
Ris99: Risaliti et al. (1999); Ris00: Risaliti et al. (2000); Ris03: Risaliti et al. (2003)
e) NGC 2992: a revived AGN according to Gilli et al. (2000);
NGC 4939: a source varying from Compton-thick to Compton-thin, see Gua05;
NGC 5005: a possibly missclassified Compton-thin source from Gua05;
Arp 220: the column density from Cle02 refers to the western nucleus and is highly uncertain.
3 Results
Table 1 summarizes observations of our sample of galaxies showing nuclear activity, high nuclear column densities (see Sect. 4) or high infrared luminosities. Among the 18 sources observed, three were detected. Figs. 1–3 show the line profiles of the detected targets. Table 2 provides line parameters obtained from Gaussian fits. Adopting a Hubble constant of = 75 km s-1 Mpc-1, to be consistent with previous maser studies and to be close to the parameters of the standard -cosmology (e.g. Spergel et al. 2003), isotropic luminosities are 7, 1500, and 400 L⊙ for NGC 2273, UGC 5101 and NGC 3393, respectively.

3.1 UGC 5101
UGC 5101 hosts one of the most luminous megamasers yet detected. Along with NGC 6240 (Hagiwara et al. 2002; Nakai et al. 2002; Braatz et al. 2003), UGC 5101 contains only the second H2O maser so far encountered in an ultraluminous infrared galaxy (ULIRG). Interestingly, neither of the two ULIRGs with H2O maser emission is known to host an OH megamaser.
As indicated in Sect. 1, all H2O megamasers studied with milliarcsecond resolution have been found to be associated with the active galactic nucleus (AGN) of their parent galaxy. Is this also the case for ULIRGs, which are characterized by extremely high rates of massive star formation? While masers associated with star formation are not known to reach luminosities in excess of 10 L⊙ (for the highest luminosities reached, see Tarchi et al. 2002b), the superposition of a large number of such sources might lead to cumulative luminosities that rival those of luminous nuclear megamasers. There is, however, evidence against this case. A large number of masers with luminosities of 0.01–1 L⊙ should lead to detectable H2O emission not only in UGC 5101, but also in Arp 220. Because of the large number of such putative star forming H2O maser sources, their overall luminosity should be fairly well correlated with star formation rates and thus with infrared luminosity. These luminosities are quite similar (1012 L⊙) for most ULIRGs. Arp 220, which has slightly less than half the redshift of UGC 5101, should thus show 5 times stronger H2O emission. However, Arp 220 was not detected (see Table 1), thus hinting at a nuclear origin of the maser in UGC 5101.
It is known that UGC 5101 hosts a prominent buried AGN. Its LINER nucleus contains an absorbed hard X-ray component with a 6.4 keV spectral feature (Imanishi et al. 2003). Its central radio continuum is dominated by an AGN, not by a starburst (Lonsdale et al. 2003), and infrared signatures also point towards a dominant nuclear engine that is highly obscured (Imanishi et al. 2001; Armus et al. 2004). In the other known ULIRG hosting a water vapor maser, NGC 6240, the H2O emission was found to spatially coincide with one of the two nuclei of the interacting pair of galaxies (Hagiwara et al. 2003). We thus conclude that the maser in UGC 5101 must be nuclear.

3.2 NGC 2273
NGC 2273 is a barred, early-type spiral galaxy with a Seyfert 2 nucleus (e.g. Petitpas & Wilson 2002) and was among the galaxies observed in the Braatz et al. (1996) survey. The sensitivity of their measurements was, however, not high enough to detect a feature at the 15 mJy level. NGC 2273 is by far the least luminous of the three detected maser sources presented here. With 10 L⊙, it is a ‘kilomaser’ and may be associated with a prominent site of star formation instead of an AGN (e.g. Tarchi et al. 2002b; Henkel et al. 2005b). The CO emission in the innermost few arcsec of the galaxy (Petitpas & Wilson 2002), the nuclear dust ring of size 14″ (Yankulova 1999), and the optical emission lines (e.g. Gu et al. 2003) are all indicative of ongoing star formation that might trigger maser emission at the observed luminosity. On the other hand, molecular gas is apparently streaming toward the innermost regions of the galaxy, which hosts a Compton-thick central X-ray source (see Sect. 5). Thus a nuclear maser is also possible. The linewidth, 0.3 km s-1 (Table 2), suggests that the maser is longlived. Thus interferometric measurements may soon provide a position with subarcsec accuracy.

3.3 NGC 3393
Like NGC 2273, NGC 3393 is a barred, early-type spiral with a Seyfert 2 nucleus (e.g. Cooke et al. 2000). It is seen nearly face-on and was also part of the Braatz et al. (1996) survey, where it was undetected (their 1 noise level is 11 mJy with a channel spacing of 0.66 km s-1). More recently, however, NGC 3393 was independently detected by Kondratko et al. (2006). Fig. 3 shows a lineshape reminiscent of that seen toward NGC 4258. Thus the nuclear origin of the maser is evident, indicating the presence of an accretion disk that is viewed approximately edge-on and suggesting a rotation velocity of order 460 km s-1. It is noteworthy that none of the disk maser (candidate) sources (for NGC 1068, NGC 2960, NGC 3079, IC 2560, NGC 4945, Circinus and NGC 6323, see Gallimore et al. 2001; Henkel et al. 2002; Kondratko et al. 2005; Ishihara et al. 2001; Greenhill et al. 1997, 2003; Braatz et al. 2004) shows the high rotation velocity, 1000 km s-1, observed towards NGC 4258, the prototypical source of its class. In view of the Toomre parameter for disk stability (e.g. Kondratko et al. 2005) it seems that NGC 4258 is hosting, with its comparatively large nuclear mass (e.g. Herrnstein et al. 1999) and circumnuclear rotation velocity (Nakai et al. 1993), an exceptionally compact and well ordered masing disk that is not typical for Seyfert galaxies.
4 Radio versus X-ray data
4.1 General aspects
Traditionally, detection rates of megamaser surveys are low (e.g. Henkel et al. 2005b). The likely most direct way to identify potential megamaser sources involves a determination of column densities towards the nuclear engine(s). Braatz et al. (1997; their Fig. 35) proposed that megamaser galaxies may be sources with particularly large nuclear column densities. With only a dozen megamaser sources known at that time and with only five having measured X-ray absorbing column densities, however, a detailed study was not possible.
While the presence of only one detected maser line does not strongly confine pumping scenarios, radiative transfer calculations provide significant constraints to kinetic temperature, H2 density and H2O column density (e.g. Kylafis & Norman 1991). To connect H2O with total column densities along a given line-of-sight, however, fractional H2O abundances are also needed. Such abundances were recently determined, not for distant AGN, but for some nearby interstellar clouds in the galactic disk (e.g. Melnick et al. 2000; Snell et al. 2000a, b, c; Neufeld et al. 2000a, b). The studies indicate [H2O]/[H2] 10-9–10-7 in cool molecular cloud cores, 10-6 in stellar outflow sources and 10-4 in warm shock heated gas. H2O column densities of order 1018 – 1020 cm-2 needed for efficient maser amplification (e.g. Kylafis & Norman 1991; Neufeld et al. 1994; Kartje et al. 1999) then require total hydrogen column densities well in excess of 1022 cm-2.
With respect to observations of extragalactic H2O masers, there is considerable progress since Braatz et al. (1997). The sample of known extragalactic H2O masers has been quadrupled (see Henkel et al. 2005b; Kondratko et al. 2006). To determine column densities toward a nuclear engine requires modeling its spectrum at X-ray wavelengths. Seyfert 2 and LINER galaxies show nuclear X-ray sources with a sometimes heavily absorbed soft part of their spectrum. Recent advances in X-ray astronomy with respect to angular resolution, in order to avoid contamination by stellar sources and diffuse emission in the vicinity of the nuclear engine, provide sensible information on column densities toward a significant number of AGN.
Of particular interest is the group of ‘Compton-thick’ galaxies with column densities in excess of 1024 cm-2. The bulk of this column density must arise from a circumnuclear shell or torus, since large scale (200 pc) column densities in galaxies with ‘normal’ nuclear starbursts tend to be one to two orders of magnitude smaller (e.g. Harrison et al. 1999; Mao et al. 2000; Wang et al. 2004), while even in ULIRGs the corresponding values are 1024 cm-2 (e.g. Pappa et al. 2000). A large column density, of order 1024 cm-2 or more in a highly confined region, presumably encompassing a few pc or less (e.g. Miyoshi et al. 1995; Gallimore et al. 2001), suggests that at least some fraction of the circumnuclear environment is dense and predominantly molecular. Thus a statistical comparison between the occurrence and strength of nuclear maser emission and column density is mandatory.
| Source | |||||
|---|---|---|---|---|---|
| (Jy km s-1) | (km s-1) | ||||
| NGC 2273 | 0.490.09 | 1813 | 3 | 34 | 9 |
| UGC 5101 | 2.690.13 | 11721 | 7 | 267 | 15 |
| NGC 3393 | 3.960.66 | 3151 | 11 | 141 | 32 |
| 0.750.20 | 3720 | 3 | 20 | 5 | |
| 0.710.22 | 4250 | 4 | 23 | 7 | |
| 1.700.22 | 4309 | 1 | 24 | 3 | |
4.2 The X-ray data
With the 53 targets from Henkel et al. (2005b; their Table 4), the type 2 Quasar J0804+3607 (Barvainis & Antonucci 2005), the three detections presented in Sect. 3 and seven additional sources from Kondratko et al. (2006), we analyze a total of 64 H2O maser galaxies beyond the Magellanic Clouds. In order to study the correlation between column density and maser emission, we searched for published column densities in the literature, mainly based on ASCA, BeppoSAX, XMM-Newton and Chandra X-ray spectroscopic observations. The data, including RXTE (Rossi X-ray Timing Explorer) observations, are summarized in Tables 3–LABEL:coldensity.
The sample of 64 objects includes 13 kilomasers (10 L⊙, their source names are marked by italics in Table LABEL:coldensity) and 51 megamasers, the latter presumably entirely of nuclear origin. Except NGC 4293, we find absorbing columns for all the kilomasers in the literature. Beside of NGC 5194 (M 51) and NGC 2273, all are Compton-thin. NGC 5194 appears to be variable from marginally Compton-thick in 1993 (Terashima et al. 1998; Bassani et al. 1999) to Compton-thick in 2000 (Fukazawa et al. 2001) and NGC 2273, the newly detected maser source, is a Compton-thick source detected by BeppoSAX (Maiolino et al. 1998) and XMM-Newton (Guainazzi et al. 2005a).
| Source | Observed | Corrected |
|---|---|---|
| upper | upper | |
| limit | limit | |
| (10-13 erg cm-2 s-1) | ||
| NGC 235Aa) | 2.91 | 4.50 |
| NGC 449b) | 3.07 | 6.55 |
| NGC 591b) | 3.73 | 7.63 |
| NGC 613a) | 2.14 | 3.38 |
| IC 184a) | 2.51 | 4.19 |
| UGC 3255a) | 3.66 | 10.34 |
| VII ZW 73a) | 4.02 | 9.35 |
| Mrk 78a) | 5.88 | 11.55 |
| J0804+3607a) | 2.06 | 3.19 |
| NGC 2824a) | 3.02 | 5.50 |
| NGC 2960a) | 3.41 | 6.51 |
| NGC 2979a) | 2.93 | 5.75 |
| Mrk 34b) | 1.60 | 2.16 |
| NGC 3735a) | 1.64 | 2.52 |
| NGC 4293a) | 2.74 | 4.78 |
| NGC 5495a) | 4.58 | 9.22 |
| NGC5793b) | 9.41 | 22.8 |
| NGC 6323a) | 1.61 | 2.67 |
| IRAS F19370–0131a) | 5.11 | 15.00 |
| NGC 6926a) | 3.20 | 7.49 |
| AM2158-380NED02a) | 2.77 | 4.20 |
| TXS 2226-184b) | 4.31 | 7.84 |
| IC 1481b) | 3.61 | 7.73 |
a) Upper limits to 0.1–2.4 keV fluxes, obtained from the ROSAT X-Ray All-Sky Survey with HEASARC (High Energy
Astrophysics Science Archive Research Center).
b) Tentative or negative detections by ASCA (0.3–12 keV) from TARTARUS version 3.0 at formal 3.19, 9.34, 4.72,
7.36, 0.12, and 2.89 levels for NGC 449, NGC 591 Mrk 34, NGC 5793, TXS 2226-184 and IC 1481, respectively.
For the way the given flux limits were derived, see also footnote a).
Among the 51 megamaser sources, 27 have no published column densities. Sixteen of these were only observed by the ROSAT All-Sky Survey (see Table 3, footnote a, for flux limits without and with correction for galactic absorption). Another six sources were measured by ROSAT and ASCA, but not by BeppoSAX, XMM-Newton or Chandra (for limits, see Table 3, footnote b). Future observations of these targets by XMM-Newton and Chandra would be desirable.
The remaining five sources without derived column densities (and not observed by ASCA or BeppoSAX) were recently measured by Chandra and/or XMM-Newton (IRAS F01063–8034, NGC 2782, ESO 269–G012, NGC 4922, and NGC 5728). There are no published column densities yet. For NGC 4922, which was observed in November 2004, count rates are not high enough to derive a meaningful result. We obtained data for the other four sources from the XMM-Newton Science and Chandra Data Archives and extracted their spectra using the software packages SAS v.6.1.0 (XMM-Newton Science Analysis Software) and CIAO v.2.3 (Chandra Interactive Analysis of Observations, http://cxc.harvard.edu/ciao/). The XSPEC v11.2.0 package was then used to fit the spectra and to obtain column densities.
Here we present the results of the X-ray data analysis of NGC 2782 and NGC 5728. The other two sources will be discussed elsewhere (Greenhill et al., in preparation).
4.2.1 Data acquisition and reduction
Chandra observed NGC 2782 on May 17, 2002111Obs. ID: 3014; PI: Ian Stevens and NGC 5728 on June 27, 2003222Obs. ID: 4077; PI: Steven Kraemer with effective exposure times of 29.6 ksec and 18.7 ksec, respectively. Both observations were carried out with the ACIS-S detector with a standard frame time of 3.2 s. The appropriate calibration database was provided by the Chandra X-ray Center and standard screening criteria were used. We checked that pile-up is not important due to comparatively low count rates of 0.03 counts/frame and 0.06 counts/frame, respectively, and that no flaring-background events occurred during the observations. Extended emission on scales of several arcseconds was found in both sources. Therefore, we extracted source spectra from circles with a radius of 10′′ around the nuclear positions and background spectra from nearby regions free of X-ray sources. Nuclear spectra from smaller circles of 1′′ in radius were also extracted. Appropriate rmf- and arf-files were created for each individual spectrum by applying standard procedures. The energy range 0.3–8.0 keV was considered. The spectra were binned to contain 25 counts per bin (15 counts per bin for the nuclear spectra).
4.2.2 Spatial analysis
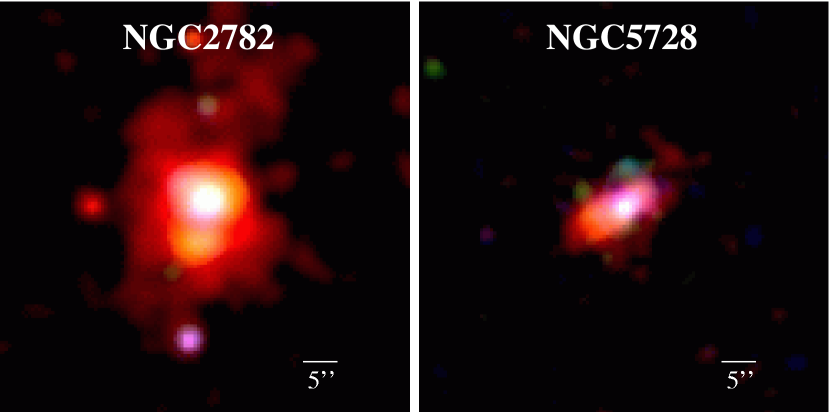
In Fig. 4, we show adaptively smoothed, three-color Chandra images of NGC 2782 and NGC 5728. Both sources exhibit a bright, unresolved core and extended regions with emission several arcseconds in size. Both large-scale emitting regions have optical and radio counterparts. For NGC 2782, the relatively weak large-scale emitting region is more elongated to the north than to the south, consistent with results from ROSAT (Jogee et al. 1998). The teardrop-shaped X-ray emitting region around the nucleus of NGC 2782 resembles the structure revealed by Hubble Space Telescope (HST) imaging (Fig. 4 in Jogee et al. 1998). The H + Nii structure reveals the X-ray ‘knot’ 65 south of the nucleus to be fully surrounded by a shell of line emitting clouds (Jogee et al. 1999). This shell is associated with a starburst-driven outflow bubble. In addition to a 5 GHz radio counterpart of this southern bubble, there is a second bubble of similar size on the opposite side of the nucleus, only visible at radio wavelengths. The detection of a hidden AGN-like nucleus from the X-ray spectrum of NGC 2782 (likely revealing a 6.4 keV iron feature in its innermost region; see Sect. 4.2.3) and the H2O maser emission (Braatz et al. 2004) suggest a more dominant role of the central engine than previously anticipated.
NGC 5728 reveals a structure elongated southeast to northwest with predominantly soft X-ray emission from the southeast and harder emission from the northwest. This difference may be caused by absorption of soft X-rays towards the northwestern region, possibly due to a geometry in which the southeastern region is closer to the observer. This scenario is supported by optical HST emission line studies that reveal a pronounced biconical axisymmetric structure of the ionization region (Wilson et al. 1993). The X-ray morphology resembles in size and extent the inner parts of the ionization cones in NGC 5728.
4.2.3 Spectral analysis
Starting with the ‘canonical’ Seyfert 2 spectrum (absorbed power law plus soft excess; see e.g. Moran et al. 2001), we tried to reproduce the spectral shape of both sources with models of increasing complexity. It was not possible to achieve an acceptable fit with a simple absorbed two-power-law model in either case333In all our models we consider two globally absorbing components, one being representative of material inside the Galaxy, the other one for gas inside the measured target source.. Not only were the reduced chi-squared values unacceptable (3.6 and 2.4, with 33 and 48 degrees of freedom, respectively), but the resulting best-fitting photon indices became unphysically extreme (–2.5 and 4.6 for NGC 2782, 0.6 and 9.5 for NGC 5728, respectively).
We considered two alternative physical models to account for the hard nuclear X-ray emission: (i) a Compton-thick high-energy reflection spectrum and (ii) a partially absorbed power law spectrum. Both models invoke a dense absorber towards the central source but differ physically, e.g. in the column density of the absorbing material. While model (i) implies reflection of seed photons off dense matter in excess of cm-2 in a disk-like geometry, model (ii) applies to a scenario in which a fraction of the source is absorbed by intervening material (e.g., associated with dense clouds) of typically cm-2 to a few times cm-2. Model (i) has the additional benefit that it is sensitive to the orientation of the disk. In addition, we requested that a valid spectral model should fit the integrated source spectrum including both the hard compact nuclear spectrum and the spatially more extended soft emission.
We modeled the soft excess via a thermal mekal plasma model (Mewe et al. 1985). This choice appears natural and physically motivated in the light of the spatial distribution of the soft emission (see Sect. 4.2.2 and Fig. 4). The transition from the integrated source spectrum to the nuclear spectrum should thus be possible via modifications of the adjustable mekal parameters inducing variations in intensity and possibly in temperature.
| Sourcea) | Mb) | c) | kTd) | EWk) | Fluxl) | |||||||
|---|---|---|---|---|---|---|---|---|---|---|---|---|
| [keV] | [keV] | [ev] | [keV] | |||||||||
| NGC2782Int | 0.004 | – | – | – | 4.39 | 52/44 | ||||||
| 0.130 | – | – | – | – | 4.80 | 49/45 | ||||||
| NGC2782Nuc | 1.00 | 0.000 | 0.99 | 1.86 | 15/10 | |||||||
| 0.666 | – | 160 | 1.32 | 2.02 | 15/10 | |||||||
| NGC5728Int | 0.037 | 1.55 | 13.0 | 45/26 | ||||||||
| 0.033 | – | 1.13 | 13.2 | 35/27 | ||||||||
| NGC5728Nuc | 0.005 | 1.29 | 9.54 | 23/15 | ||||||||
| 0.011 | – | 0.89 | 9.34 | 16/16 |
a) sourceInt: Integrated spectra from circular areas with a radius of 10′′ around the nuclear position;
sourceNuc: Nuclear spectra from smaller areas of 1′′ in radius
b) M: Model I: a Compton-thick high-energy reflection spectrum (wabszwabs(mekal+hrefl(pow+gau)) in XSPEC); Model
II: a partially absorbed power law spectrum (wabszwabs(mekal+pow+zwabs(pow+gau)) in XSPEC). The galactic
absorbing column densities are 1.761020cm-2 and 7.831020cm-2 for NGC 2782 and NGC 5728,
respectively (from Dickey & Lockman 1990)
c) X-ray absorbing column density in units of cm-2
d) Temperature of the thermal MEKAL plasma in keV
e) Metallicity of the thermal MEKAL plasma as a fraction of solar metallicity (in the case of model I of
NGC 2782Nuc, this relative metallicity is not constrained by the data and was therefore fixed to unity).
f) Ratio between the directly seen continuum and the scattered/absorbed continuum
g) Disk inclination
h) Photon index
i) There is no obvious line in the integrated spectrum of NGC 2782 (NGC2782int). Intrinsically present line emission
may be buried in the relatively bright extended continuum
j) Width of the line feature that is tentative in the case of NGC 2782 (its strength does not significantly affect the other
parameters)
k) Equivalent width of the line feature, see footnote j
l) Flux from 0.3 to 8 keV in units of 10-13erg cm-2s-1 (corrected for galactic absorption)
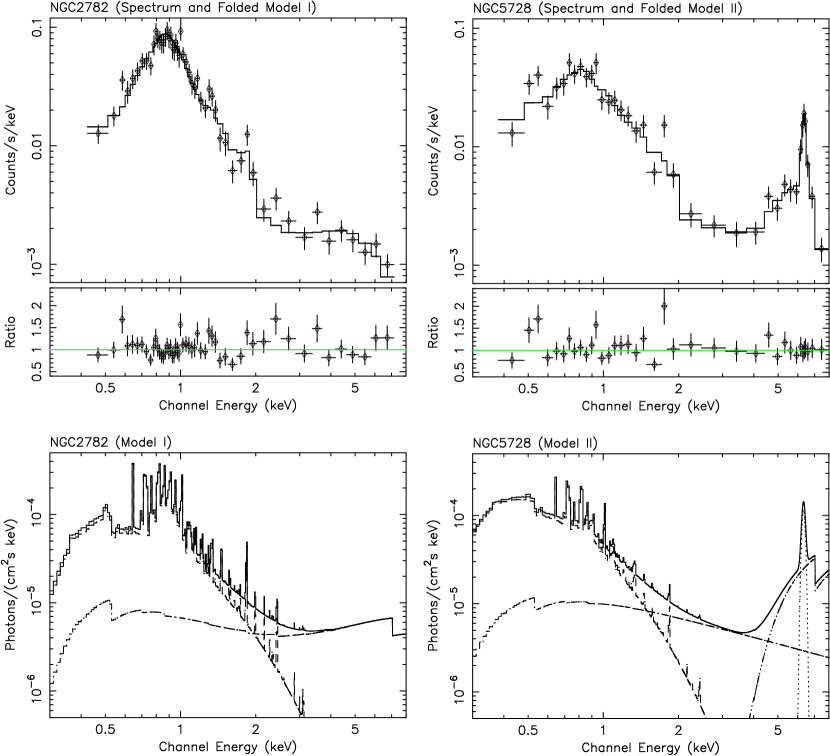
Table 4 shows the results of spectral fitting. While statistically acceptable fits to the spectra of both sources can be obtained with both physical models, we prefer model (i) in the case of NGC 2782 and model (ii) in the case of NGC 5728 (see the discussion below). Spectra and fits are shown in Fig. 5.
The photon index of NGC 2782 in model (ii) is extraordinarily flat (). This index could only be explained with a complex structure of the absorbing system, invoking a variation of column densities in individual absorbing clouds. While such a configuration cannot be excluded, the comparatively simpler model (i) yields a satisfactory fit to the data with reasonable values for the crucial parameters. The large inclination of the reflecting disk is consistent with a Type 2 AGN but we note that this parameter is, in spite of the small formal 1 errors given in Table 4, not well constrained by the available data. While the integrated spectrum does not require the addition of a narrow Gaussian to represent iron-line emission, excess emission is seen in the nuclear spectrum (radius: 1″). The equivalent width of this tentative feature is 990 eV.
In the case of NGC 5728, model (i) is statistically inferior to our preferred model (ii). Moreover, the high-energy-reflection model (i) implies a photon index as inverted as –0.8. The partial-obscuration model (ii), on the other hand, yields a less extreme (although still comparatively flat) photon index of 0.8. The large equivalent width of the Fe line (1.5 keV and 1.1 keV for the two models, respectively) is notable.
In spite of the discussed uncertainties, the analysis of the Chandra spectral data of NGC 2782 and NGC 5728 clearly demonstrates the presence of compact high-column-density absorbers in both systems. In NGC 2782, the high-energy-reflection model suggests a Compton-thick absorber with a column density in excess of cm-2 (even the alternative model (ii) still implies an extreme value of cm-2). For NGC 5728 the partial-obscuration model predicts cm-2.
To summarize, we obtained X-ray column densities for 38 maser sources, 36 from the literature and 2 from processing archived data. 12 of the 13 kilomaser galaxies and 26 of the 45 megamaser galaxies are included. Because of the larger sample, the statistics are improved over the last such studies, those by Braatz et al. (1997; see Sect. 4.1) and Madejski et al. (2006; their Table 3 containing 11 disk masers).
5 Discussion
Not all of the 38 maser sources with well defined X-ray spectra permit a meaningful comparison between H2O maser properties and column densities. A correlation would be most convincing if there were a strong dominant X-ray source known to coincide both with the nuclear engine of its parent galaxy and the observed H2O maser.
These optimal conditions cannot be fulfilled. X-ray images with the highest angular resolution, 1″, have a linear resolution of 10 pc for the nearest sources (e.g. NGC 253). For the most distant X-ray detected target, 3C403, this angular resolution corresponds to 1 kpc and it is hard to imagine that X-ray emission from the (hopefully dominant) nuclear source is not contaminated by a large number of (hopefully weaker) stellar objects and an extended diffuse gas component.
The maser location poses a similar problem. Towards some sources, the H2O line is observed with submilliarcsecond accuracy. Even in the best of all cases, however, when H2O is tracing an edge-on accretion disk, the situation is complex. Only the ‘systemic’ H2O velocity components (for a spectrum showing redshifted, blueshifted and ‘systemic’ components, see Fig. 3) may arise from in front of the nuclear engine. The red- and blueshifted features originate instead from locations displaced by up to a few parsec (e.g. Gallimore et al. 2001; Kondratko et al. 2005) from the nucleus. Amplification of the nuclear radio continuum by unsaturated systemic maser components is another unknown parameter that may strongly affect maser luminosities that depend sensitively on inclination and warping of an approximately edge-on maser disk.
There are further complications. For many of the sources with high column density, only lower limits of order 1024-25 cm-2 have been derived (see Table LABEL:coldensity). There is a major uncertainty in the column density estimates related to the possibility that the X-ray emission is predominantly scattered light not passing through the main body of the obscuring torus. A significant fraction of the kilomasers are related to star forming regions well off the center of their parent galaxy. In IC 342, neither the maser nor the dominant X-ray source are nuclear (Tarchi et al. 2002a; Bauer & Brandt 2004), both being associated with different star forming regions. In NGC 598 (M 33) the ‘nuclear’ X-ray continuum originates from an X-ray binary close to the dynamical center, well off the H2O masers that are observed in the large-scale disk. There is even one H2O detected galaxy, M 82, that lacks a well defined nuclear engine.
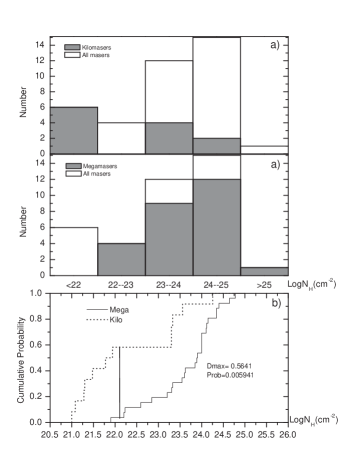
All these complications suggest that a correlation between H2O maser emission and X-ray column density should not only show a large scatter, but may remain entirely undetectable. For the 38 maser sources with well defined X-ray spectra, column densities (ignoring all the problems outlined above, preferring high resolution Chandra data whenever possible and adopting the most recent value if Chandra data are not available) are displayed in Fig. 6a. The histograms show the number of extragalactic H2O masers as a function of column density, both for the entire sample and for the subsamples of 12 kilomasers and 26 megamasers. We find that there is a striking difference between the column density distribution of the two classes, with megamasers being associated with higher column densities.
All kilomasers (see Table LABEL:coldensity; their source names are printed in italics) except NGC 2273 and NGC 5194 are Compton-thin, i.e. their absorbing column densities are NH1024cm-2. There are two groups of sources, one with column densities of 1021-22 cm-2 and another one with column densities 1023.3 cm-2. The mean of the logarithmic values is log (cm-2) = , the error being the standard deviation of the mean (for NGC 2273, the lower limit to the column density was taken; see Table LABEL:coldensity).
H2O megamasers exist preferentially in environments with higher obscuration, i.e. in circumnuclear regions of high column density. The peak in the distribution lies at 24 log (cm-2) 25. 85% (22/26) of the megamaser sources are heavily obscured (1023cm-2) and one half are Compton-thick (1024cm-2). These fractions are consistent with the average properties of Seyfert 2 galaxies as derived by Risaliti et al. (1999) and Guainazzi et al. (2005b), while showing slightly but not significantly higher column densities than those reported by Bassani et al. (1999). Taking logarithmic values, the mean column density becomes log (cm-2) = . For six sources, there are only lower limits; these adopted limits thus lead to an average below the true mean value, likely underestimating the difference between megamaser and kilomaser column densities (see Table LABEL:coldensity). The Kolmogorov-Smirnov statistical method was used to test whether the distributions of column density of our kilomaser and megamaser sources are statistically distinguishable (see Fig. 6b). The K-S test result shows that the null hypothesis, they both are from the same parent population, can be rejected at a confidence level of at least 99.4%.
In view of the uncertainties outlined above and the fact that, to date, no systematic searches for H2O in galaxies with Compton-thick nuclear environments have been undertaken, the result is surprisingly clear: Nuclear column density is a very solid guide when searching for megamaser emission. Almost all megamasers known to date could have been found by analyzing X-ray data.
The cause of the difference between kilomaser and megamaser column densities is less clear. Differences in position between maser and X-ray sources were already mentioned. On the one hand, we may face a high degree of small scale clumping in the observed clouds, even within circumnuclear accretion disks. On the other hand, milliarcsecond offsets between megamaser and nuclear X-ray source are expected, while such offsets tend to be much larger in some of the kilomaser sources. Even accounting for the smaller mean distance to known kilomaser galaxies, linear offsets between maser and X-ray sources tend to be much larger in kilomaser sources than for megamasers. The three kilomaser sources, however, that are known to be ‘nuclear’ (i.e. the maser and dynamical centers coincide within 1″) and possess an associated X-ray source (NGC 253, NGC 4051, and NGC 5194) reveal column densities that are indistinguishable from those of the megamaser sample. While three sources are clearly not sufficient for a statistically meaningful result, we note that this effect alone has the potential to explain the discrepancy in averaged column densities between kilomaser and megamaser column densities.
The subsample of (candidate) disk masers with X-ray column densities, encompassing NGC 1068, NGC 2639, NGC 3079, IC 2560, NGC 3393, NGC 4258, NGC 4945, and Circinus, is another subsample worth to be studied. For the mean of the logarithmic values of their column densities we find log (cm-2) = . This value (two sources are represented by lower limits only) is slightly higher but still consistent with that derived for the entire megamaser sample.
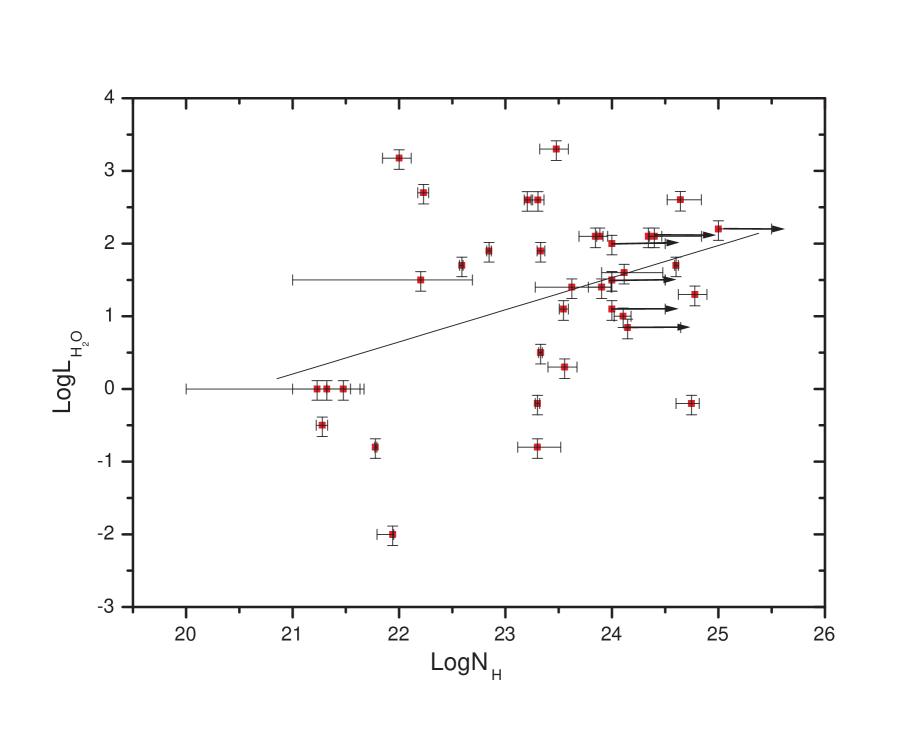
In Fig. 7, the H2O maser isotropic luminosities are plotted against their X-ray absorbing column densities. The H2O maser isotropic luminosities were taken from Table 4 of Henkel et al. (2005b) and from Sect. 3. We adopted a 30% uncertainty in maser luminosity for all sources. For the entire maser sample, again taking lower limits to the column densities as real values for seven targets, the linear fit gives log = (0.560.17) log + (–11.893.93), with a correlation coefficient =0.49. A trend of rising column density with maser luminosity may be apparent, but the scatter is large and the correlation is weak. The megamaser subsample (not displayed) shows no trend at all. There is no exponential growth of intensity with column density as expected in the case of unsaturated maser emission (e.g., Goldreich et al. 1972). A correlation roughly fitting would be expected in the case of idealized saturated maser emission (no velocity gradients in the maser region) with the value of the exponent being determined by the luminosity increasing linearly with column density and the surface of the masing cone growing with the square of its lengths (e.g., Kylafis & Norman 1991). As already indicated, even slight differences in the lines of sight as well as amplification by a background continuum source may be responsible for the weakness of the correlation.
6 Conclusions
In this paper, maser emission and column density are discussed for 64 extragalactic H2O maser sources. The main results are:
(1) In searching for the 1.3 cm (22 GHz) water vapor line in galaxies with high nuclear column densities, active nuclei or high infrared luminosities, we detected H2O emission towards NGC 2273, UGC 5101, and NGC 3393 with isotropic luminosities of 7, 1500, and 400 L⊙, respectively. UGC 5101, one of the most luminous H2O megamasers ever found, is the first luminous (100 L⊙) H2O maser detected in an ULIRG. The maser is likely nuclear. NGC 2273 hosts a maser that is either nuclear or associated with massive star formation. Since its lineshape is wide, suggesting a long lifetime, interferometric measurements may soon reveal its nature. NGC 3393, first detected by Kondratko et al. (2006), shows a classical NGC 4258-like profile. If the analogy holds, the rotation velocity of the disk is well below the 1000 km s-1 encountered in NGC 4258. This and similarly low rotation velocities in other ‘disk-maser’ galaxies suggest that the accretion disk in NGC 4258, surrounding a nuclear engine of relatively high mass, is particularly compact and well ordered.
(2) Chandra X-ray images and spectra are presented and analyzed for NGC 2782 and NGC 5728. A hidden AGN was detected in NGC 2782. The X-ray spectrum is best fit by a high energy reflection model with 1024cm-2; its 6.4 keV Fe line appears to be buried in a spatially more extended, relatively bright continuum. The H2O maser, so far believed to be associated with star formation, may be related to the nuclear engine. The X-ray spatial analysis of NGC 5728 confirms the biconical axisymmetric structure of its ionization region, which was previously revealed by optical HST emission line studies. The best fitting model, with a partially absorbed power law spectrum, yields 81023 cm-2.
(3) A statistical analysis of the correlation between X-ray absorbing column density and H2O emission was carried out, encompassing 64 galaxies beyond the Magellanic Clouds. At a confidence level of at least 99.4%, the column density distributions of kilomaser and megamaser sources are different. More than 80% (22/26) of the megamaser sources are heavily obscured (1023cm-2) and half are Compton-thick ( 1024cm-2). Among the 13 known kilomaser sources ( 10 L⊙), however, only NGC 2273 and NGC 5194 are Compton-thick. The small subsamples of nuclear kilomasers and disk megamasers show average column densities that are undistinguishable from those of the entire megamaser sample and from samples of Seyfert 2 galaxies that were not selected with respect to maser emission. Presumably a clumpy cloud structure in the cirumnuclear environment, diverging positions between maser and nuclear sources and an occasional amplification of a background radio continuum source are sufficiently decoupling X-ray column densities and H2O maser properties not to show a clear correlation.
(4) The identification of an AGN of type 2 is sufficient to justify a search for H2O maser emission. The determination of X-ray column densities toward the nuclear engine does not enhance maser detection probabilities.
Acknowledgements.
We wish to thank M. Elitzur for useful discussions and an anonymous referee for critically reading the text. This research was supported in part by NASA LTSA grant NAG 513065 to the University of Maryland and has made use of the NASA/IPAC Extragalactic Database (NED) which is operated by the Jet Propulsion Laboratory, CalTech, under contract with NASA. We also profited from NASA’s Astrophysics Data System Abstract Service.References
- (1) Armus, L., Charmandaris, V., & Spoon, H. W. W. 2004, ApJS, 154, 178
- (2) Baars, J. W. M., Genzel, R., Pauliny-Toth, I. I. K., & Witzel, A. 1977, A&A, 61, 99
- (3) Ballo, L., Braito, V., Della Ceca, R., et al. 2004, ApJ, 600, 634
- (4) Barvainis, R., & Antonucci, R. 2005, ApJ, 628, L89
- (5) Bassani, L., Dadina, M., Maiolino, R., et al. 1999, ApJS, 121, 473
- (6) Bauer, F.E., & Brandt, W.N. 2004, ApJ, 601, L67
- (7) Beckmann, V., Gehrels, N., Favre, P., et al. 2004, ApJ, 614, 641
- (8) Bianchi, S., Balestra, I., Matt, G., Guainazzi, M., & Perola, G. C. 2003, A&A, 402, 141
- (9) Bianchi, S., Miniutti, G., Fabian, A.C., & Iwasawa, K. 2005, MNRAS, 360, 380
- (10) Boller, Th., Keil, R., Hasinger, G., et al. 2003, A&A, 411, 63
- (11) Braatz, J. A., Wilson, A. S., & Henkel, C. 1996, ApJS, 106, 51
- (12) Braatz, J. A., Wilson, A. S., & Henkel, C. 1997, ApJS, 110, 321
- (13) Braatz, J. A., Wilson, A. S., Henkel, C., Gough, R., & Sinclair, M. 2003, ApJS, 146, 249
- (14) Braatz, J. A., Henkel, C., Greenhill, L. J., Moran, J. M., & Wilson, A. S. 2004, ApJ, 617, L29
- (15) Braito, V., Della Ceca, R., Piconcelli, E., et al. 2004, A&A, 420, 79
- (16) Brunthaler, A., Reid, M., Falcke, H., Greenhill, L. J., & Henkel, C. 2005, Sci, 307, 1440
- (17) Cappi, M., Bassani, L., Comastri, A., et al. 1999a, A&A, 344, 857
- (18) Cappi, M., Palumbo, G. G. C., Pellegrini, S., & Persic, M. 1999b, Astron. Nachr., 320, 248
- (19) Cecil, G., Bland-Hawthorn, J., & Veilleux, S. 2002, ApJ, 576, 745
- (20) Churchwell, E., Witzel, A., Huchtmeier, W., et al. 1977, A&A, 54, 969
- (21) Clements, D. L., McDowell, J. C., Shaked, S., et al. 2002, ApJ, 581, 974
- (22) Collinge, M. J., Brandt, W. N., Kaspi, S., et al. 2001, ApJ, 557, 2
- (23) Cooke, A. J., Baldwin, J. A., Ferland, G. J., Hagai, N., & Wilson, A. S. 2000, ApJS 129, 517
- (24) Della Ceca, R., Griffiths, R. E., Heckman, T. M., Lehnert, M. D., & Weaver, K. A. 1999, ApJ, 514, 772
- (25) Della Ceca, R., Ballo, L., Tavecchio, F., et al. 2002, ApJ, 581, L9
- (26) Deluit S.J. 2004, A&A, 415, 39
- (27) Dickey, J.M., & Lockman, F.J. 1990, ARA&A 28, 215
- (28) Done, C., Madejski, G. M., & Smith, D. A. 1996, ApJ, 463, L63
- (29) Forster, K., Leighly, K. M., & Kay, L. E. 1999, ApJ, 523, 521
- (30) Foschini, L., Rodriguez, J., Fuchs, Y., et al. 2004, A&A, 416, 529
- (31) Fruscione, A., Greenhill, L. J., Filippenko, A. V., et al. 2005, ApJ, 624, 103
- (32) Fukazawa, Y., Iyomoto, N., Kubota, A., Matsumoto, Y., & Makishima, K. 2001, A&A, 374, 73
- (33) Fullmer, L., & Lonsdale, C. 1989, Cataloged Galaxies and Quasars Observed in the IRAS Survey, JPL D-1932, Version 2
- (34) Gallimore, J. F., Henkel, C., Baum, S. A., et al. 2001, ApJ, 556, 694
- (35) George, I. M., Turner, T. J., Netzer, H., et al. 1998, ApJS, 114, 73
- (36) Gilli, R., Maiolino, R., Marconi, A., et al. 2000, A&A, 355, 485
- (37) Goldreich, P., & Keeley, D. A. 1972, ApJ, 174, 517
- (38) Greenhill, L. J. 2002, in Cosmic Masers: From Protostars to Black Holes, ed. V. Migenes & M.J. Reid (San Francisco: Astron. Soc. Pac.), IAU Symp., 206, 381
- (39) Greenhill, L. J. 2004, New Astron. Rev., 48, 1079
- (40) Greenhill, L. J., Moran, J. M., & Herrnstein, J. R. 1997, ApJ, 481, L23
- (41) Greenhill, L. J., Booth, R. S., Ellingsen, S. P., et al. 2003, ApJ, 590, 162
- (42) Gu, Q.-S., Shi, L., Lei, S.-J., Liu, W.-H., & Huang, J.-H. 2003, ChJA&A, 3, 203
- (43) Guainazzi, M. 2002, MNRAS, 329, L13
- (44) Guainazzi, M., Matt, G., Antonelli, L. A., et al. 1999, MNRAS, 310, 10
- (45) Guainazzi, M., Matt, G., Brandt, W. N., et al. 2000, A&A, 356, 463
- (46) Guainazzi, M., Matt, G., Fiore, F., & Perola, G. C. 2002, A&A, 388, 787
- (47) Guainazzi, M., Siemiginowska, A., Rodriguez-Pascual, P., & Stanghellini, C. 2004a, A&A, 421, 461
- (48) Guainazzi, M.; Rodriguez-Pascual, P., Fabian, A. C., Iwasawa, K., & Matt, G. 2004b, MNRAS, 355,297
- (49) Guainazzi, M., Fabian, A. C., Iwasawa, K., Matt, G., & Fiore F. 2005a, MNRAS, 356, 295
- (50) Guainazzi, M., Matt, G., & Perola, G. C. 2005b, A&A (astro-ph/0508265)
- (51) Hagiwara, Y., Diamond, P. J., & Miyoshi, M. 2002, A&A, 383, 65
- (52) Hagiwara, Y., Diamond, P. J., & Miyoshi, M. 2003, A&A, 400, 457
- (53) Harrison, A., Henkel, C., & Russel, A. 1999, MNRAS, 303, 157
- (54) Henkel, C., & Braatz, J. A. 2003, Acta Astron. Sinica Suppl., 44, 55
- (55) Henkel, C., Braatz, J. A., Greenhill, L. J., & Wilson, A. S. 2002, A&A, 394, L23
- (56) Henkel, C., Braatz, J. A., Tarchi, A., et al. 2005a, ApSS, 295, 117
- (57) Henkel, C., Peck, A. B., Tarchi, A., et al. 2005b, A&A, 436, 75
- (58) Herrnstein, J. R., Moran, J. M., Greenhill, L. J., et al. 1999, Nature, 400, 539
- (59) Imanishi, M., Dudley, C. C., & Maloney, P. R. 2001, ApJ, 558, L93
- (60) Imanishi, M., Terashima, Y., Anabuki, N., & Nakagawa, T. 2003, ApJ, 596, L167
- (61) Ishihara, Y., Nakai, N., Iyomoto, N., et al. 2001, PASJ, 53, 215
- (62) Iwasawa, K., & Comastri, A. 1998, MNRAS, 297, 1219
- (63) Iwasawa, K., Fabian, A. C., & Matt, G. 1997, MNRAS, 289, 443
- (64) Iwasawa, K., Maloney, P. R., & Fabian, A. C. 2002, MNRAS, 336, L71
- (65) Iwasawa, K., Wilson, A. S., Fabian, A. C., & Young, A. J. 2003, MNRAS, 345, 369
- (66) Iyomoto, N., Fukazawa, Y., Nakai, N., & Ishihara, Y. 2001, ApJ, 561, L69
- (67) Jogee, S., Kenney, J. D. P., & Smith, B. J. 1998, ApJ, 494, L185
- (68) Jogee, S., Kenney, J. D. P., & Smith, B. J. 1999, ApJ, 526, 665
- (69) Kartje, J. F., Königl, A., Elitzur, M. 1999, ApJ, 513, 180
- (70) Kondratko, P. T., Greenhill, L. J., & Moran, J. M. 2005, ApJ, 618, 618
- (71) Kondratko, P. T., Greenhill, L. J., Moran, J. M. et al. 2006, ApJ, in press (astro-ph/0510851)
- (72) Kong, A. K. H. 2003, MNRAS, 346, 265
- (73) Kraft, R. P., Hardcastle, M. J., Worrall, D. M., & Murray, S. S. 2005, ApJ, 622, 149
- (74) Kubota, A., Done, C., & Makishima, K. 2002, MNRAS, 337, L11
- (75) Kylafis, N. D., & Norman, C. 1987, ApJ, 323, 346
- (76) Kylafis, N. D., & Norman, C. 1991, ApJ, 373, 525
- (77) Leighly, K. M., Halpern, J. P., Awaki, H., et al. 1999, ApJ, 522, 209
- (78) Levenson, N. A., Weaver, K. A., & Heckman, T. M. 2001, ApJS, 133, 269
- (79) Lo, K. Y. 2005, ARA&A, 43, 625
- (80) Lonsdale, C. J., Lonsdale, C. J., Smith, H. E., & Diamond, P. J. 2003, ApJ, 592, 804
- (81) Madejski, G., Done, C., Zycki, P. T. & Greenhill, L. J. 2006, ApJ, 636, in press (astro-ph/0510013)
- (82) Maiolino, R., Salvati, M., Bassani, L., et al. 1998, A&A, 338, 781
- (83) Maiolino, R., Comastri, A., Gilli, R., et al. 2003, MNRAS, 344, L59
- (84) Maloney, P. R. 2002, PASA, 19, 401
- (85) Mao, R.Q., Henkel, C., Schulz, A., et al. 2000, A&A 358, 433
- (86) Matt, G., Fiore, F., Perola, G. C., et al. 1996, MNRAS, 281, L69
- (87) Matt, G., Guainazzi, M., Frontera, F., et al. 1997, A&A, 325, L13
- (88) Matt, G., Guainazzi, M., Maiolino, R., et al. 1999, A&A, 341, L39
- (89) Matt, G., Fabian, A. C., Guainazzi, M., et al. 2000, MNRAS, 318, 173
- (90) Matt, G., Bianchi, S., Guainazzi, M., & Molendi, S. 2004, A&A, 414, 155
- (91) Matsumoto, C., Nava, A., Maddox, L. A., et al. 2004, ApJ, 617, 930
- (92) Melnick, G. J., Ashby, M. L. N., Plume, R., et al. 2000, ApJ, 539, L87
- (93) Mewe, R., Gronenschild, E. H. B. M., & van den Oord, G. H. J. 1985, A&AS, 62, 197
- (94) Miller, J.S., & Goodrich, R. W. 1990, ApJ, 355, 456
- (95) Miyoshi, M., Moran, J., Herrnstein, J., et al. 1995, Nature, 373, 127
- (96) Morganti, R., Greenhill, L. J., Peck, A. B., Jones, D. L., Henkel, C. 2004, New Astron. Rev., 48, 1195
- (97) Moran, E. C., Kay, L. E., Davis, M., Fillipenko, A. V., & Barth, A. J. 2001, ApJ, 556, L75
- (98) Nakai, N. Inoue, M., & Miyoshi, M. 1993, Nature, 361, 45
- (99) Nakai, N. Sato, N., & Yamauchi, A. 2002, PASJ, 54, L27
- (100) Neufeld, D. A., Maloney, P. R., & Conger, S. 1994, ApJ, 436, L127
- (101) Neufeld, D. A., Snell, R. L., Ashby, M. L. N., et al. 2000a, ApJ, 539, L107
- (102) Neufeld, D. A., Ashby, M. L. N., Bergin, E. A., et al. 2000b, ApJ, 539, L111
- (103) Ohno, M., Fukazawa, Y., & Iyomoto, N. 2004, PASJ, 56, 425
- (104) Ott, M., Witzel, A., Quirrenbach, A., et al. 1994, A&A 284, 331
- (105) Pappa, A., Georgantopoulos, I., Steward, G. C. 2000, MNRAS, 314, 589
- (106) Persic, M., Mariani, S., Cappi, M., et al. 1998, A&A, 339, L33
- (107) Petitpas, G. R., & Wilson, C. D. 2002, ApJ, 575, 814
- (108) Pietsch, W., & Read, A. M. 2002, A&A, 384, 793
- (109) Pounds, K. A., Reeves, J. N., King, A. R., & Page, K. L. 2004, MNRAS, 350, 10
- (110) Ptak, A., Heckman, T., Levenson, N. A., Weaver, K., & Strickland D. 2003, ApJ, 592, 782
- (111) Reynolds, C. S., Nowak, M. A., & Maloney, P. R. 2000, ApJ, 540, 143
- (112) Risaliti, G., Maiolino, R., & Salvati, M. 1999, ApJ, 522, 157
- (113) Risaliti, G., Gilli, R., Maiolino, R., & Salvati, M. 2000, A&A, 357, 13
- (114) Risaliti, G., Elvis, M., & Nicastro, F. 2002, ApJ, 571, 234
- (115) Risaliti, G., Woltjer, L., & Salvati, M. 2003, A&A, 401, 895
- (116) Sambruna, R. M., Netzer, H., Kaspi, S., et al. 2001, ApJ, 546, L13
- (117) Schurch, N. J., & Warwick, R. S. 2002a, MNRAS, 334, 811
- (118) Schurch, N. J., Roberts, T. P., & Warwick, R. S. 2002b, MNRAS, 335, 241
- (119) Smith, D. A., & Done, C. 1996, MNRAS, 280, 355
- (120) Snell, R. L., Howe, J. E., Ashby, M. L. N., et al. 2000a, ApJ, 539, L93
- (121) Snell, R. L., Howe, J. E., Ashby, M. L. N., et al. 2000b, ApJ, 539, L97
- (122) Snell, R. L., Howe, J. E., Ashby, M. L. N., et al. 2000c, ApJ, 539, L101
- (123) Spergel, D. N., Verde, L., Peiris, H. V., et al. 2003, ApJS, 148, 175
- (124) Stevens, I. R., Read, A. M., & Bravo-Guerrero, J. 2003, MNRAS, 343, L47
- (125) Strickland, D. K., Heckman, T. M., Colbert, E. J. M., Hoopes, C. G., & Weaver, K. A. 2004, ApJS, 151, 193
- (126) Takano, M., Mitsuda, K., Fukazawa, Y., & Nagase, F., 1994, ApJ, 436, L47
- (127) Tarchi, A., Henkel, C., Peck, A. B., & Menten, K. M. 2002a, A&A, 385, 1049
- (128) Tarchi, A., Henkel, C., Peck, A. B., & Menten, K. M. 2002b, A&A, 389, L39
- (129) Terashima, Y., Ptak, A., Fujimoto, R., et al. 1998, ApJ, 496, 210
- (130) Terashima, Y., Iyomoto, N., Ho, Luis C., & Ptak, A. F. 2002, ApJS, 139, 1
- (131) Turner, T. J., George, I. M., Nandra, K., & Mushotzky, R. F. 1997a, ApJS, 113, 23
- (132) Turner, T. J., George, I. M., Nandra, K., & Mushotzky, R. F. 1997b, ApJ, 488, 164
- (133) Vignati, P., Molendi, S., Matt, G., et al. 1999, A&A, 349, L57
- (134) Wang, Q. D., Chaves, T., & Irwin, J. A 2003, ApJ, 598, 969
- (135) Wang, M., Henkel, C., Chin, Y.-N., et al. 2004, A&A, 422, 883
- (136) Weaver, K. A., Heckman, T. M., Strickland, D. K., & Dahlem, M. 2002, ApJ, 576, L19
- (137) Wilkes, B. J., Mathur, S., Fiore, F., Antonelli, A., & Nicastro, F. 2001, ApJ, 549, 248
- (138) Wilson, A. S., Braatz, J. A., Heckman, T. M., Krolik, J. H., & Miley, G. K. 1993, ApJ 419, L61
- (139) Wilson, A. S., Roy, A. L., Ulvestad, J. S., et al. 1998, ApJ, 505, 587
- (140) Wouterloot, J. G. A., & Walmsley, C. M. 1986, A&A, 168, 237
- (141) Yankulova, I. M. 1999, A&A, 344, 36
- (142) Young, A. J., & Wilson, A. S. 2004, ApJ, 601,133.
- (143) Zezas, A., Ward, M. J., & Murray, S. S., 2003, ApJ, 594, L31
| Source | Typea | Telescopeb | Epochc | Referencesd | |
|---|---|---|---|---|---|
| (1023 cm-2) | |||||
| IC 10 | X-1 | C | 2003.03.12 | BB04 | |
| NGC 235A | S2 | R | see Table 3 | HEASARC | |
| NGC 253 | SBG | B | 1996.11.29 | Cap99b | |
| C | 1999.12.16 | Wea02 | |||
| NGC 262 (Mrk 348) | S2 | A | 1995 | Ris02 | |
| IRAS F01063–8034e) | S2 | X | 2003.04.21 | see Sect. 4.2 | |
| NGC 449 (Mrk 1) | S2 | A | 1996.08.06 | see Table 3 | TARTARUS |
| NGC 598 (M 33) | A | 1993.07 | Tak94 | ||
| X-8 | X | 2000–2002 | Fos04 | ||
| NGC 591 | S2 | A | 1997.07.28 | see Table 3 | TARTARUS |
| NGC 613 | S | R | see Table 3 | HEASARC | |
| IC 184 | S2 | R | see Table 3 | HEASARC | |
| NGC 1052 | LINER | A | 1996.08 | Ter02 | |
| X | 2001.08.15 | Kad06 | |||
| NGC 1068 | S2, C | A | 1993.07.24 | B99, Iwa97 | |
| B | 1996, 1998 | Mat97, Gua99 | |||
| C | 2000.02.21 | Mat04 | |||
| X | 2000.07.29 | Mat04 | |||
| Mrk 1066 | S2, C | A | 1997.07.24 | Ris99 | |
| NGC 1386 | S2, C | B | 1996.12.10 | Mai98 | |
| X | 2002.12.29 | Gua05 | |||
| IC 342 | A | 2000.02.24 | Kub02 | ||
| X-21 | X | 2001.02.11 | Kon03 | ||
| UGC 3255 | S2 | R | see Table 3 | HEASARC | |
| Mrk 3 | S2, C | A | 1993 | Tur97b | |
| B | 1997.04.16 | Cap99a, Matt00 | |||
| X | 2000.10.19 | Bia05 | |||
| NGC 2146 | SBG | A | 1997.03.26 | Del99 | |
| VII ZW 73 | S2 | R | see Table 3 | HEASARC | |
| NGC 2273 | S2, C | B | 1997.02.12 | Mai98 | |
| X | 2003.09.05 | Gua05 | |||
| Mrk 78 | S2 | R | see Table 3 | HEASARC | |
| Mrk 1210 | S2, C? | A | 1995 | B99 | |
| B | 2001.05.05 | Ohno04 | |||
| X | 2001.05.05 | Gua02b | |||
| J0804+3607 | Type 2 Quasar | R | see Table 3 | HEASARC | |
| NGC 2639 | LINER | A | 1997.04.16 | B99, Wil98 | |
| NGC 2782e) | SBG, C | C | 2002.05.17 | this paper | |
| NGC 2824 (Mrk 394) | S2 | R | see Table 3 | HEASARC | |
| NGC 2960 (Mrk 1419) | LINER | R | see Table 3 | HEASARC | |
| UGC 5101 | ULIRG | C | 2001.05.28 | 0.1 (0.65) | Ptak03 |
| C,X | 2001 | Arm04 | |||
| NGC 2979 | S2 | R | see Table 3 | HEASARC | |
| NGC 3034 (M 82)f) | SBG | B | 1997.12.06 | Cap99b | |
| X | 2001.05.06 | Ste03 | |||
| C | 2002 | 0.012 | Str04 | ||
| NGC 3079 | S2/LINER, C? | A | 1993.05.09 | B99, Ter02 | |
| B | 2000.05.26 | Iyo01 | |||
| C | 2001.03.07 | Cec02 | |||
| Mrk 34 | S2 | A | 1997.11.17 | see Table 3 | TARTARUS |
| IC 2560 | S2 | A | 1996.12.19 | 3 | Ish01 |
| C | 2000.10.29 | Iwa02 | |||
| C | 2004.02.16 | 30 | Mad06 | ||
| NGC3393 | S2, C | X | 2003.01.05 | Gua05 | |
| NGC3556 | X-35 | C | 2001.09.08 | Wang03 | |
| Arp 299 (NGC 3690) | SBG, C | X | 2001.05.06 | Ball04 | |
| C | 2001.07.13 | Zez03 | |||
| B | 2001.12.14 | Del02 | |||
| NGC 3735 | S2 | R | see Table 3 | HEASARC | |
| NGC 4051 | S1/1.5 | A | 1993.04.25 | Geo98 | |
| C | 2000.04.25 | Col01 | |||
| X | 2001.05.16 | Pou04 | |||
| NGC 4151 | S1.5 | A | 1993.12.07 | Geo98 | |
| A,B | 1999-2000 | Sch02a | |||
| NGC 4258 | S1.9 | A | 1999.05.15 | Rey00 | |
| B | 1998.12.19 | Ris02 | |||
| C | 2000–2001 | You04 | |||
| X | 2000.12.08 | Pie02 | |||
| X,C | 2000-2002 | Fru05 | |||
| NGC 4293 | LINER | R | see Table 3 | HEASARC | |
| NGC 4388 | S2 | A | 1995.07.21 | For99 | |
| B | 2000.01.03 | Ris02 | |||
| X | 2002.12.12 | Bec04 | |||
| C | 2001.06.08 | Iwa03 | |||
| ESO 269-G012e) | S2 | C | 2004.01.05 | see Sect. 4.2 | |
| NGC 4922g) | S2 | C | 2004.11.02 | see Sect. 4.2 | |
| NGC 4945 | S2, C | A | 1993.08.31 | B99, Don96 | |
| B | 1999.07.01 | Gua00 | |||
| NGC 5194 (M 51) | S2, C | A | 1993.05.11 | B99,Ter98 | |
| B | 2000.01.18 | Fuk01 | |||
| NGC 5256 (Mrk 266) | S2 | A | 1999.05 | Lev01 | |
| NGC 5347 | S2, C | A | 1997 | Ris99 | |
| NGC 5495 | S2 | R | see Table 3 | HEASARC | |
| Circinus | S2, C | A | 1995.08.14 | B99, Mat96 | |
| B | 1998.03.13 | Mat99 | |||
| C | 2000.06.06 | Sam01 | |||
| NGC 5506 (Mrk1376) | S1? | B | 1998.01.14 | Ris02 | |
| NGC 5643 | S2, C | B | 1997.03.01 | Mai98, B99 | |
| X | 2003.02.08 | 610 | Gua04 | ||
| NGC 5728e) | S2 | C | 2003.05.27 | this paper | |
| NGC 5793 | S2 | A | 1998.08.05 | see Table 3 | TARTARUS |
| NGC 6240 | ULIRG, C | A | 1994.03.27 | 20 | Iwa98 |
| B | 1998.08.15 | Vig99 | |||
| X | 2000.09.22 | Bol03 | |||
| X | 2001.07.29 | Ptak03 | |||
| NGC 6300 | S2, C? | RX | 1997.02 | Lei99 | |
| B | 1999.08 | Gua02a | |||
| X | 2001.03.02 | Mats04 | |||
| NGC 6323 | S2 | R | see Table 3 | HEASARC | |
| ESO 103-G035 | S2 | A | 1996.03.18 | For99 | |
| B | 1997.10.14 | Wil01 | |||
| IRAS F19370–0131 | S2 | R | see Table 3 | HEASARC | |
| 3C 403 | FRII | C | 2002.12.07 | Kra05 | |
| NGC 6926 | S2 | R | see Table 3 | HEASARC | |
| AM2158-380NED02 | S2 | R | see Table 3 | HEASARC | |
| TXS 2226-184 | LINER | A | 1997.11.21 | see Table 3 | TARTARUS |
| IC 1481 | LINER | A | 1997.11.28 | see Table 3 | TARTARUS |
∗ Chandra and XMM-Newton results are given whenever possible. For sources not observed by these satellites most recent (but usually older) results are quoted. Sources in italics: kilomaser sources.
a) Type of nuclear activity. In the absence of a starburst and a prominent nuclear source, the X-ray source (e.g. X-1 or X-8) is given. SBG: StarBurst Galaxy; S2: Seyfert 2; LINER: Low-Ionization Nuclear Emission Line Region; ULIRG: UltraLuminous InfraRed Galaxy; FRII: Fanarov-Riley Type II galaxy; C: Compton-thick, i.e. 10; C?: possibly varying between Compton-thick and Compton-thin
b) A: ASCA; B: BeppoSax; C: Chandra; R: ROSAT; RX: RXTE; X: XMM-Newton
c) Year, month and day
d) Arm04: Armus et al. (2004); Ball04: Ballo et al. (2004); B99: Bassani et al. (1999); BB04: Bauer & Brandt (2004); Bec04: Beckmann et al. (2004); Bia03: Bianchi et al. (2003); Bia05: Bianchi et al. (2005); Bol03: Boller et al. (2003); Cap99a: Cappi et al. (1999); Cap99b: Cappi et al. (1999); Cec02: Cecil et al. (2002); Col01: Collinge et al. (2001); Del99: Della Ceca et al. (1999); Del02: Della Ceca et al. (2002); Don96: Done et al. (1996); For99: Forster et al. (1999); Fos04: Foschini et al. (2004); Fru05: Fruscione et al. (2005) Fuk01: Fukazawa et al. (2001); Geo98: George et al. (1998); Gua99: Guainazzi et al. (1999); Gua00: Guainazzi et al. (2000); Gua02a: Guainazzi (2002); Gua02b: Guainazzi et al. (2002); Gua04: Guainazzi et al. (2004b); Gua05: Guainazzi et al. (2005a); Ish01: Ishihara et al. (2001); Iwa97: Iwasawa et al. (1997); Iwa98: Iwasawa & Comastri (1998); Iwa02: Iwasawa et al. (2002); Iwa03: Iwasawa et al. (2003); Iyo01: Iyomoto et al. (2001); Kad06: Kadler et al. (2006), in prep.; Kon03: Kong (2003); Kra05: Kraft et al. (2005); Kub02: Kubota et al. (2002) Lei99: Leighly et al. (1999); Lev01: Levenson et al. (2001); Mad06: Madejski et al. (2006); Mai98: Maiolino et al. (1998); Mat96: Matt et al. (1996); Mat97: Matt et al. (1997); Mat99: Matt et al. (1999); Mat00: Matt et al. (2000); Mat04: Matt et al. (2004); Mats04: Matsumoto et al. (2004); Mil90: Miller & Goodrich (1990); Ohno04: Ohno et al. (2004); Per98: Persic et al. (1998); Pie02: Pietsch et al. (2002); Pou04: Pounds et al. (2004); Ptak03: Ptak et al. (2003); Rey00: Reynolds et al. (2000); Ris99: Risaliti et al. (1999); Ris02: Risaliti et al. (2002); Sam01: Sambruna et al. (2001); Sch02a: Schurch et al. (2002a); Sch02b: Schurch et al. (2002b); Smi96: Smith & Done (1996); Ste03: Stevens et al. (2003); Str04: Strickland et al. (2004); Tak94: Takano et al. (1994) Ter98: Terashima et al. (1998); Ter02: Terashima et al. (2002); Tur97a: Turner et al. (1997a); Tur97b: Turner et al. (1997b); Vig99: Vignati et al. (1999); Wang03: Wang et al. (2003); Wea02: Weaver et al. (2002); Wil01: Wilkes et al. (2001); Wil98: Wilson et al. (1998); You04: Young & Wilson (2004); Zez03: Zezas et al. (2003).
e) Absorbing column densities were obtained by processing XMM-Newton and Chandra Archive data (see Sect. 4.2).
f) For NGC 3034 (M 82), lacking a well defined nucleus, the Chandra data refer to the diffuse halo component.
g) Chandra archive data have not yet been released.