1–
Constraining MgII absorber systems
with the SDSS
Abstract
Using a large sample of MgII absorbers with detected by Nestor et al. (2005) in the Early Data Release of the SDSS, we present new constraints on the physical properties of these systems based on two statistical analyses: (i) By computing the ratio between the composite spectra of quasars with and without absorbers, we measure the reddening effects induced by these intervening systems; and (ii) by stacking SDSS images centered on quasars with strong MgII absorption lines and isolating the excess light around the PSF, we measure the mean luminosity and colors of the absorbing galaxies. This statistical approach does not require any spectroscopic follow up and allows us to constrain the photometric properties of absorber systems.
keywords:
galaxies, quasars, absorption lines1 Introduction
Since it was realized that strong metal absorption lines detected in quasar spectra are due to intervening galaxies (e.g. Bahcall & Spitzer 1969, Boksenberg & Sargent 1978, Bergeron & Boissé 1991), significant progress has been made in our understanding of absorber systems. A number of studies have constrained some of their physical properties such as temperature, abundances and kinematics (for a review see for example Churchill’s contribution). However, the precise nature of absorber systems is still elusive and more observational constraints are needed in order to improve our understanding on how these systems trace various structures such as galactic disks, halos, winds, etc. This would allow us to include and use absorbers in our global picture of galaxy formation and evolution.
In this contribution we illustrate how imaging and spectroscopic data from the Sloan Digital Sky Survey (SDSS) can be used to constrain the nature of absorber systems. Having selected a population of quasars with strong absorbers as well as a population of reference quasars (§2), we construct their composite spectra and isolate the reddening effects due to the presence of absorbers (§3). In §4, we show how the photometric properties of absorbing galaxies can be constrained by measuring the statistical excess of light present around quasars in SDSS images. We summarize the results in §5.
2 The data
2.1 The MgII absorber sample


We use the sample of MgII absorption line systems compiled by Nestor et al. (2005) based on SDSS EDR data (Stoughton et al. 2002). Here, we focus our analysis on strong systems with a rest equivalent width . In this range, the detection completeness is very high and multiple systems along the same line-of-sight are rare. In addition, we focus our reddening measurements on the strongest systems, with . In this section we briefly summarise the main steps involved in the absorption line detection procedure. For details on the quasar and absorber catalogs, we refer the reader to Schneider et al. (2002) and Nestor et al. (2005).
The SDSS EDR provides 3814 QSO spectra, approximately 3700 of which are of QSOs with sufficiently high redshift to allow the detection of intervening MgII absorption lines. The continuum-normalized SDSS QSO spectra were searched for MgII doublets using an optimal extraction method employing a Gaussian line-profile to measure each rest equivalent width . The identification of MgII doublets required the detection of the 2796 line at more than 5 and one additional line detected at least at 3. Only systems 0.1c blueward of the quasar redshift and redward of Ly emission were accepted. Systems with separations of less than 500 km/s were considered as a single system. The final sample comprises 813 QSOs with MgII absorbers. We show the redshift distribution of the absorbers with Å (solid line) and that of the background quasars (dashed line) in the left panel of Figure 1. The right panel shows the rest equivalent width distribution of the 2796 Å line. Among these systems, 55 have Å.
2.2 The reference quasar sample
In order to isolate the effects induced by the presence of absorber systems we use a control sample made of quasars without absorbers. To avoid selection biases, the two quasar populations must have the same redshift distribution and the same absorption-line detectability. The main steps of our object selection are as follows: for each quasar with an absorber system, we randomly look for a quasar without any detected absorber (down to the limiting value of the line finder, i.e. ) such that their redshifts are similar within 0.1. In addition, we require that this quasar has a high enough S/N to allow the detection of absorption lines of similar strength as the absorber system at wavelengths corresponding to . Thus our procedure ensures that the lack of absorption at in the reference QSO spectrum is real. The quasars selected in this way are called reference quasars in the following. Contamination by undetected absorbers at is expected to statistically affect both samples in the same way. We match each quasar with absorbers to two reference quasars, which allows us to decrease the noise level.
3 Reddening properties from composite spectra
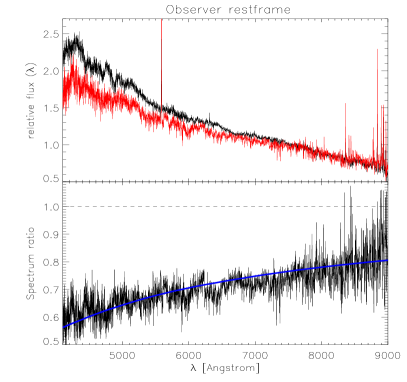
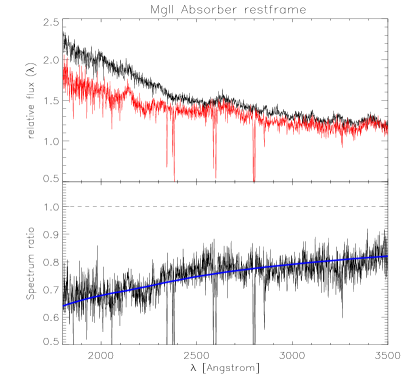
In this section we investigate the reddening and extinction properties induced by our selected population of absorbers to their background quasars. For each sample of quasars defined above we create composite spectra in the observer- and absorber rest-frames. The composite spectra are obtained by computing the geometric mean of all spectra renormalized so that the global signal is not dominated by the brightest objects and taking into account the masks provided by the SDSS pipeline. For computing the composite spectrum in the absorber rest frame, sky lines are masked and the wavelength shifts applied to the quasars with absorbers are also used for the reference quasars. The results are shown in the upper panels of figure 2. The composite spectra are shown in the observer and absorber rest-frame in the left and right panels. The corresponding spectra have been normalised to the same flux at and 3500 Å, respectively. As can be seen in both panels, quasars with absorbers appear to be redder than their reference quasars. In order to quantify this difference, we have computed the spectrum ratio and displayed the result in the lower panels of the figure. In the absorber rest frame, this ratio provides a direct measurement of the mean extinction curve of our sample of absorber systems. In the observer rest-frame, this quantity has been convolved with the redshift distribution of the absorber systems. As we can see, the 2175 Å excess seen in the reddening curve of the Milky way or the LMC is not present. We find that the SMC reddening curve provides a good fit to the mean extinction curve of MgII absorbers111We use the template provided by B. Draine at http://www.astro.princeton.edu/~draine. This is shown with the smooth curve. In each case, we have normalized the ratio such that it is unity at sufficiently large wavelengths. This allows us to estimate the expected amount of extinction as a function of wavelength.
Using the SMC reddening curve as a fitting template, the measured reddening allows us to constrain the mean product where is the SMC dust-to-gas ratio and is the hydrogen column density. From the results obtained in the observer and absorber rest-frames, we find and atoms cm-2, respectively. Note that the noise contributions are different in each case. Our result indicates that MgII absorbers with generally correspond to Damped Ly systems. We find the reddening values to strongly depend on the MgII rest equivalent width. Detailed results will be presented in Menard et al. (2005).
4 Photometric properties from image stacking
In this section we show that producing a high signal-to-noise (S/N) average image of the quasars with absorbers allows us to measure the photometric properties of the absorbing galaxies. For the two samples of quasars defined in section 2, we stack the corresponding SDSS images centered on the quasars. This procedure consists of four basic steps: shifting to make images superposable, rescaling the intensity to a uniform photometric calibration, masking of all unwanted sources, and averaging.
We use the raw “corrected frames” publicly available in the Third Data Release of the SDSS [Abazajian et al.(2005), (Abazajian et al. 2005)]. The image shift is done using a bi-cubic spline interpolant and the photometric calibrations provided by the DR3 catalogs are used to rescale the intensities. We then generate masks blanking sources that are likely to be foregrounds with respect to the absorber. For each QSO we create three independent masks in , and -band, that are eventually combined in a final mask. In each band, we first subtract from the corrected frame the Atlas Image of the QSO produced by the PHOTO pipeline [Lupton et al. (2001), (Lupton et al. 2001)]. As the Atlas Image contains all and only the pixels that are attributed to the QSO by the de-blender, we are left with a clean image where all sources but the QSO are present. On this image we run SExtractor [Bertin & Arnouts(1996), (Bertin & Arnouts 1996)] to find all candidate sources. We mask all objects with a flux exceeding that expected for an extreme case of a luminous blue galaxy: a stellar population with produced by a burst Gyr long, observed immediately after the burst end at the redshift of the absorber as predicted by [Bruzual & Charlot(2003), Bruzual & Charlot]’s population synthesis models (Bruzual & Charlot 2003). Our final results do not critically depend on this choice of different spectral energy distributions. Finally, the masks in the three bands are combined and conservative masks are applied to all objects classified as stars by PHOTO with . Non-saturated stars are masked out to their 25 mag arcsec-2 isophotal radius (-band), while saturated stars are masked out to three times this radius.
After subtracting the background value evaluated on the masked image, the shifted and intensity-calibrated images are averaged, excluding all masked pixels. Azimuthally averaged surface brightness profiles are extracted in a series of circular apertures which are optimized to integrate on larger areas at larger radii. A more accurate background level for these profile is recomputed on the stacked image. The complete covariance matrix of the extracted background-subtracted surface brightness profile is evaluated using the jackknife technique.
In order to isolate the excess light due to intervening absorbers, we subtract the mean point spread function (PSF). The PSF depends on several parameters: the time of the observation, the position on a given camera column, the color of the object, etc. In order to build an effective PSF which is representative of the flux-averaged PSF of our QSOs extended to large angular distances, we stack stars selected to match each individual QSO. We first require stars to be observed in the same observing run and same camera column as the QSO. These stars are then ranked to minimize a combination of the following quantities: (i) the difference of Gaussian FWHM with respect to the QSO; (ii) the angular separation from the QSO; and (iii) the differences in colors with respect to those of the QSO. To map the PSF with reasonable S/N at large distances, bright unsaturated stars are also preferred ( mag is however required). For each QSO in each band, the star that best fulfills all these criteria is chosen. To obtain the correct flux-weighted average PSF, the intensity of each star is rescaled to the same intensity of the corresponding QSO before stacking.
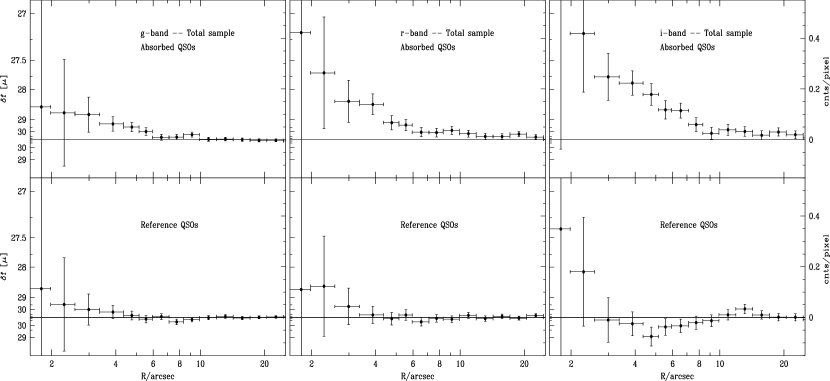
In Fig.3 we show the surface brightness residuals measured in the , and -band after the PSF subtraction for the sample of 810 QSOs with absorbers (upper panels) and for the reference QSO sample (lower panels). Note that three quasar images could not be used because of their proximity to a bright star. The stacked PSFs are normalized with respect to the QSO profiles within an aperture of 4 pixels (1.6′′). The vertical scale is linear in flux intensity and the horizontal solid line is the background level. The left vertical axis displays the surface brightness in mag arcsec-2 (in excess or deficit). Error bars are computed from the jackknife covariance matrix and include the budget from the background uncertainty. Central normalization uncertainties are found to be negligible. The upper panels show a clear surface brightness excess. It is detected at 5.5, 7.1 and 9.2 in the , and -band, respectively. Such an excess is not seen for the reference sample. In this case, the results indicate a marginal surface brightness excess within 4′′, possibly due to the flux contribution of the quasar host galaxy. Larger datasets will allow us to measure this effect more precisely. The excess light that cross-correlates with the presence of MgII systems provides us with an estimation of the mean light contribution of the absorbing galaxies. In addition it should be noticed that the width of this light excess corresponds to the characteristic size of MgII gas halos around galaxies.
We have investigated how the signal depends on redshift. Within 10′′ the integrated -band absorber magnitude range from at to roughly two magnitudes fainter at , which is consistent with the expected dimming as a function of distance. More detailed results are presented in Zibetti et al. (2005).
Focusing on the redshift range we have investigated the photometric properties of the absorbing galaxies. Within a 10′′aperture (where the S/N is higher) we find the average integrated magnitudes to be , and , and the corresponding colors read and , indicating a population of blue galaxies. More detailed results on the implied stellar population will be presented in a forthcoming paper.
5 Conclusion
Using a sample of over 800 MgII systems with we have presented two statistical analyses constraining the properties of these absorber systems. After having carefuly selected a population of reference quasars, we have measured the mean reddening curve induced by these intervening systems by computing the ratio between the composute spectra of quasars with and without absorbers. We do not find any presence of the 2175 Å bump present in the Milky way and LMC reddening curves and we find the SMC reddening curve to provide a good fit to the measured reddening. Assuming the mean MgII absorbers to have the same metallicity and dust-to-gas ratio as the SMC, we measured the mean hydrogen column density of these systems to be atoms cm-2.
In addition, we have constrained the mean photometric properties of MgII absorbing galaxies by measuring the statistical light excess present around quasars with absorbers. This signal is detected at 5.5, 7.1 and 9.2 in the , and -band, respectively and such an excess is not seen for the reference sample. This light contribution behaves as expected as a function of scale and redshift, and the measured colors indicate that the mean MgII absorbing galaxies is a late-type galaxy.
The results presented in this contribution are based on EDR data. Future analyses will provide much more accurate constraints and will allow us to investigate the absorber properties as a function of redshift and for different ion species.
Acknowledgements.
We thank Jim Gunn and Masataka Fukugita for useful discussions. B.M. acknowledge a support of the Florence Gould Foundation. Funding for the creation and distribution of the SDSS Archive has been provided by the Alfred P. Sloan Foundation, the Participating Institutions, the National Aeronautics and Space Administration, the National Science Foundation, the U.S. Department of Energy, the Japanese Monbukagakusho, and the Max Planck Society.References
- [Abazajian et al.(2005)] Abazajian, K., et al. 2005, Astrophysical Journal 129, 1755
- [Bahcall & Spitzer(1969)] Bahcall, J. N., & Spitzer, L. J. 1969, ApJL 156, L63
- [Bergeron & Boissé(1991)] Bergeron, J., & Boisse, P. 1991, Astronomy & Astrophysics 243, 344
- [Bertin & Arnouts(1996)] Bertin, E., & Arnouts, S. 1996, aaps 117, 393
- [Boksenberg & Sargent(1978)] Boksenberg, A., & Sargent, W. L. W. 1978, ApJ 220, 42
- [Bruzual & Charlot(2003)] Bruzual, G., & Charlot, S. 2003, MNRAS 344, 1000 (BC03)
- [Churchill et al.(2005)] Churchill, C., Kacprzak, G. G., Steidel, C. C. 2005, this volume
- [Lupton et al. (2001)] Lupton, R. H., Gunn, J. E., Ivezić, Z., Knapp, G. R., Kent, S., & Yasuda, N. 2001, ASP Conf. Ser. 238: Astronomical Data Analysis Software and Systems X 238, 269
- [Ménard et al. (2005)] Ménard, B., Nestor, D. B., Turnshek, D. A., Richards, G., Rao, S. M. 2005, in preparation
- [Nestor et al.(2005)] Nestor, D. B., Turnshek, D. A., Rao, S. M. 2005, ApJ in press, astro-ph/0410493
- [Schneider et al.(2002)] Schneider, D. P., et al. 2002, Astrophysical Journal 123, 567
- [Stoughton et al.(2002)] Stoughton, C., et al. 2002, Astrophysical Journal 123, 485
- [York et al.(2000)] York, D. G., et al. 2000, Astrophysical Journal 120, 1579
- [Zibetti et al.(2005)] Zibetti, S., Ménard, B., Nestor, D., & Turnshek, D. 2005, Astrophysical Journal 120, 1579