Beryllium in Disk and Halo Stars –
Evidence for a Beryllium Dispersion in Old Stars11affiliation: Based on observations obtained with the Subaru Telescope
Abstract
The study of Be in stars of differing metal content can elucidate the formation mechanisms and the Galactic chemical evolution of the light element, Be. We have obtained high-resolution, high signal-to-noise spectra of the resonance lines of Be II in eight stars with the high-dispersion spectrograph (HDS) on the Subaru 8.2 m telescope on Mauna Kea. Abundances of Be have been determined through spectrum synthesis. The stars with [Fe/H] values 1.1 conform to the published general trend of Be vs. Fe. We have confirmed the high Be abundance in HD 94028 and have found a similarly high Be abundance in another star, HD 132475, at the same metallicity: [Fe/H] = 1.5. These two stars are 0.5 - 0.6 dex higher in Be than the Be-Fe trend. While that general trend contains the evidence for a Galaxy-wide enrichment in Be and Fe, the higher-than-predicted Be abundances in those two stars shows that there are also local Be enrichments. Possible enrichment mechanisms include hypernovae and multiple supernova explosions contained in a superbubble. One of our stars, G 64-37, has a very low metallicity of [Fe/] = 3.2; we have determined its Be abundance to look for evidence of a Be plateau. It’s Be abundance appears to extend the Be-Fe trend to lower Fe abundances without any evidence for a plateau as had been indicated by a high Be abundance in another very metal-poor star, G 64-12. Although these two stars have similar Be abundances within the errors, it could be that their different Be values are indicators of may be indicating that a Be dispersion even at the lowest metallicities.
1 Introduction
The study of Be in stars has importance in several areas of astronomy. The history of the production of Galactic Be can be seen in the increase of Be abundance with stellar metallicity, usually measured by Fe or O (e.g. Boesgaard et al. 1999) but other elements such as Ca and Mg have been employed (e.g. King 2002). The Fe abundance is used as a surrogate for age, but the O abundance is relevant because it it directly connected to the dominant, and perhaps only, Be production mechanism: spallation reactions in the interstellar medium or in the vicinity of supernovae explosions.
The idea of spallation was invented by Reeves, Fowler & Hoyle (1970) and the details were first described by Meneguzzi, Audouze & Reeves (1971). The basic process is that high energy (150 MeV) protons and neutrons bombard interstellar nuclei of C, N, and O creating lighter isotopes. It has been suggested that the “bullets” and “targets” might be reversed near supernovae where C, N, and O nuclei could be accelerated into the ambient interstellar gas including protons and neutrons (see, for example, Duncan et al. 1997, 1998, Lemoine, Vangioni-Flam & Cassé 1998). Modified and expanded versions of Galactic cosmic ray spallation can be found, for example, in Ramaty & Lingenfelter (1999), Ramaty, Lingenfelter & Kozlovsky (2000), Parizot & Drury (1999), Parizot (2000).
Although standard Big Band Nucleosynthesis (BBN) is not expected to produce much Be (Be/H 10-18), some models with inhomogeneous regions in the very early universe can make up to Be/H 10-14 (Malaney & Mathews 1992, Orita et al. 1997). This amount is near the detection threshold and efforts have been made to search for a plateau in Be similar to the Li plateau (e.g. Boesgaard et al. 1999, Primas et al. 2000a). The plateau in Li abundance for metal-poor stars, from [Fe/H] = 1.5 to 3.5, has a small dependence on metallicity and temperature found by Novicki (2005) in a sample of 116 halo dwarfs. A Be plateau might also show a similar dispersion. If there is a Be plateau, it need not be the result of production of Be in an inhomogeneous Big Bang. It could be caused by extra production of Be in superbubbles by multiple supernova outbursts (Parizot & Drury 1999).
The increase in Be with Fe may also show a dispersion in the Be abundance for a given Fe. Hints of this are seen in Figure 5 of Boesgaard et al. (1999a), particularly at [Fe/H] 1.5 where the spread in Be is 0.7 dex but the typical errors are 0.10 dex. A spread could result from differing degrees of efficiency in the formation of Be by spallation in different parts of the Galaxy.
We have made Be observations in a set of disk and halo stars to try to understand the formation and Galactic evolution of Be. Our sample includes the very metal-poor dwarf, G 64-37, at [Fe/H] = 3.2 which will allow us to examine whether there is a plateau in the Be abundances. Other stars that we observed enable us to investigate whether there is a spread in Be at given metallicity.
2 Observations and Data Analysis
The Be II resonance lines at 3130.421 and 3131.065 Å are best observed near the meridian with a spectrometer and detector with good UV efficiency. The spectra for this research were obtained with the High Dispersion Spectrograph (HDS) (Noguichi et al. 2002) on the Subaru 8.2 m telescope on Mauna Kea in 2001 June 05 and 2003 May 27. The June 2001 night had less than optimal weather (snow), so our observing program was limited to a total of nine stars over the two nights. The stars observed cover a broad range in metallicity: [Fe/H] = +0.02 to 3.20.
The spectra were taken with the standard HDS setup StdUb with the blue collimator and cross disperser, resulting in a wavelength coverage of 2970-4640 Å over the two CCDs, with the echelle orders overlapping such that the Be lines appeared in two orders in each exposure. The slit width chosen was 0.″7 wide, and the images were binned 22 for efficient readout. This setup yields a spectral resolution of 50,000, which is sufficient to measure the Be lines. The log of the observations is given in Table 1 along with photometric data for eight stars. (The results for the ninth star, G 186-26, have been published separately by Boesgaard & Novicki 2005.)
The majority of the data analysis for the Subaru HDS data was done using the standard IRAF utilities. For HDS, the overscan region is located in the center of each chip, and the data for each CCD are read out using two amplifiers. The Subaru staff have written a routine for IRAF which removes the overscan region and does a bias subtraction for each of the individual images. The master flat field was created by median-combining all of the flats and then normalized using the the program flatnormalize in IRAF. The flats that were taken on 2003 May 27 were saturated in the red region in order to have sufficient flux in the region of the Be II lines, and therefore all the images taken that night were trimmed to avoid this region of the CCD. The saturated region did not contain the Be orders or those immediately before or after, so by trimming the saturated region we did not lose any of the Be data. The June 2001 spectra were not saturated and therefore all of the orders on the blue CCD were processed.
Once the flats were made and normalized, the images were divided by the master flat. The cosmic rays were removed and the profile of the scattered light across the image was calculated and removed. The spectra were traced and extracted, along with the Th-Ar. The list of Th-Ar lines in IRAF was incomplete in the blue region of the spectra, so it was necessary to add many lines to the list which we took from the Th-Ar atlas for HDS produced by the Subaru telescope staff. The wavelength solution from the Th-Ar spectra was applied to the individual star spectra, and then the spectra were corrected for their radial velocity shifts. As the spectra are very crowded with absorption lines, the radial velocities that were available via Simbad were used to Doppler-correct the spectra. Any multiple exposures for an individual star were median combined, and then the spectra were divided by the continuum level. The Be lines are actually in two different orders of the spectrum, and so if there was a cosmic ray event in the middle of the Be lines in one order, the other order could be used. For our analysis, we used the order that had the Be lines near the center of the order, and therefore had more signal. The continuum level was estimated by fitting a high-order spline3 function to the highest points in the spectrum because there were virtually no regions without any absorption lines. For two of the stars, G 21-22 and G 64-37, we combined the two orders which contained the Be II lines in order to increase the effective S/N. Due to the strong blaze function, we had to combine the “continuumed” spectra weighted by the relative flux just shortward of the blend containing the 3130 line.
The reduced spectra covering the Be II lines are shown in Figures 1 and 2. In these figures the continua have been normalized to 1.0, but the final continuum placement is done during the synthesis determinations.
3 Abundances
3.1 Stellar Parameters
For three of our stars we adopted published parameters. For HD 195633 we used the parameters of Rebolo et al. (1988); for HR 7973 we used those from Chen et al. (2001); for HR 8888 we used those of Boesgaard et al. (2001). For the other five stars we proceeded as follows. We used three photometric colors as temperature indicators: (b-y), (V-K), and (R-I). The (b-y) colors came from Schuster and Nissen (1988a, 1989a, 1989b) (hereafter SN), which was available for all five stars. The (V-K) and (R-I) colors came from a variety of sources including the 2MASS survey (Cutri et al. 2003) and were also available for all five stars. Only one of our stars (G 21-22) needed a reddening correction, which was derived by SN. The required reddening correction for (b-y) was also applied to the (V-K) and (R-I) using the relations from Johnson (1968). We have used the relationships between these colors and effective temperature given by Carney (1983a) to find three values for Teff. They were then given weights of 4:2:1 for T(b-y)0, T(V-K)0, and T(R-I)0. These temperatures are given in Table 2. The error estimates come from averaging the absolute difference between the temperature estimates and the mean Teff.
The primary method used to estimate log g for the five stars was the use of the star’s position on the log g vs. Teff plane on a 10 Gyr, Y = 0.24 Isochrone. We used the new Yale isochrones (Yi, Demarque & Kim 2004). First, the evolutionary status was determined from the Strömgren photometry by placing the star on the c0-(b-y)0 diagram (see Schuster & Nissen 1989a), and then the star was placed on the isochrone. The isochrones are double-valued for most temperatures and the evolutionary status indicated which of the values was appropriate. With the exception of HD 132475 the stars are all dwarf stars.
We estimate that the minimum error on log g is 0.20 dex, and we can be more specific for some of the stars. For HD 94028 Tomkin et al. (1992) derived log g from the ionization balance of Fe I and Fe II; their log g is 4.32. Gratton et al. (1996) reevaluate the Tomkin et al. parameters and find 4.54. Fulbright (2000) determined stellar parameters spectroscopically and his ionization balance value for log g is 4.2 for HD 94028. Clementini et al. (1999) used an iterative procedure involving colors and Hipparcos data to find a value for log g of 4.31 for this star. Nissen et al. (1997) found 4.30 0.06 using a parallax-based gravity with Hipparcos data for HD 94028. Our derived value of 4.44 0.20 is consistent with these other determinations; further, it is consistent with the way we have found log g values for the other stars in our sample.
For HD 201891 we derive log g = 4.42 0.20 from the isochrones. Other studies have found similar values: 4.31 from Clementini et al. (1999); 4.43 0.10 from Chen et al. (2000); 4.30 0.06 from Fulbright (2000), 4.25: from Nissen et al. (1997). For HD 132475 we have found log g = 3.60 0.20. For this star Fulbright (2000) derived 3.60 0.06 and Nissen et al. (1997) found 3.87 0.10. The other two stars, G 21-22 and G 64-37, are too faint to have reliable parallaxes from Hipparcos. For these two stars we will adopt an uncertainty of a factor of two, i.e. 0.30 dex.
Once the temperatures were established for all of the sample stars, we determined the [Fe/H] values. We searched the literature for high-resolution, high-S/N measurements of [Fe/H] in our five stars with lower metallicities. In the Cayrel de Strobel et al. (2001) catalog of [Fe/H] determinations from high-resolution, high-S/N spectroscopic observations, for example, there are 13 entries for HD 94028, 7 for HD 132475, 15 for HD 201891, but only 2 for G 64-37 and 1 for G 21-22. We have found additional references for the latter two stars, including Alonso et al. (1996) and Carney et al. (1994) for G 21-22 and Stephens & Boesgaard (2002) and Nissen et al. (2003) for G 64-37. All of those results were normalized to solar Fe/H of 7.51 (on the log scale where log N(H) = 12.00) and corrected to our temperature. We have made calculations with MOOG to determine the temperature sensitivity of [Fe/H] (e.g. see Boesgaard et al. (2005); it is typically 0.08 dex for 135 to 150 K in Teff. We adjusted the published [Fe/H] by the appropriate amount to correspond to our derived temperature. We also used some lower resolution and/or lower S/N results, e.g. Thévenin & Idiart (1999), Beers et al. (1999), but gave them less weight in our final averages.
For metal-poor stars near the turnoff point on the main sequence, the microturbulent velocity, , is nearly constant Magain (1984) and equal to 1.5 km s-1, so we adopted this value for all of our models. More details on the parameter determinations can be found in Novicki (2005).
3.2 Be Abundance Determinations
Abundances were determined for Be through the spectrum synthesis mode of MOOG, 2002 version (Sneden 1973, http://verdi.as.utexas.edu/moog.html). This version contains the UV opacity edges of the metals from Kurucz. There are many atomic and molecular lines in the spectral region of the Be II lines. The line list used by Boesgaard et al. (1999a) was used here. As pointed out in that paper, it is important to know the O abundance as many lines of OH appear among the blends and [O/Fe] is positive for metal-poor stars. Therefore, for our syntheses the O abundance in the model atmosphere is not reduced by the amount that Fe is reduced (the case for other elements, except Be), but rather it is specified. For stars where the O abundance has not been specifically determined, the value has been found from the relationship between [Fe/H] and [O/H] in Boesgaard et al. (1999b).
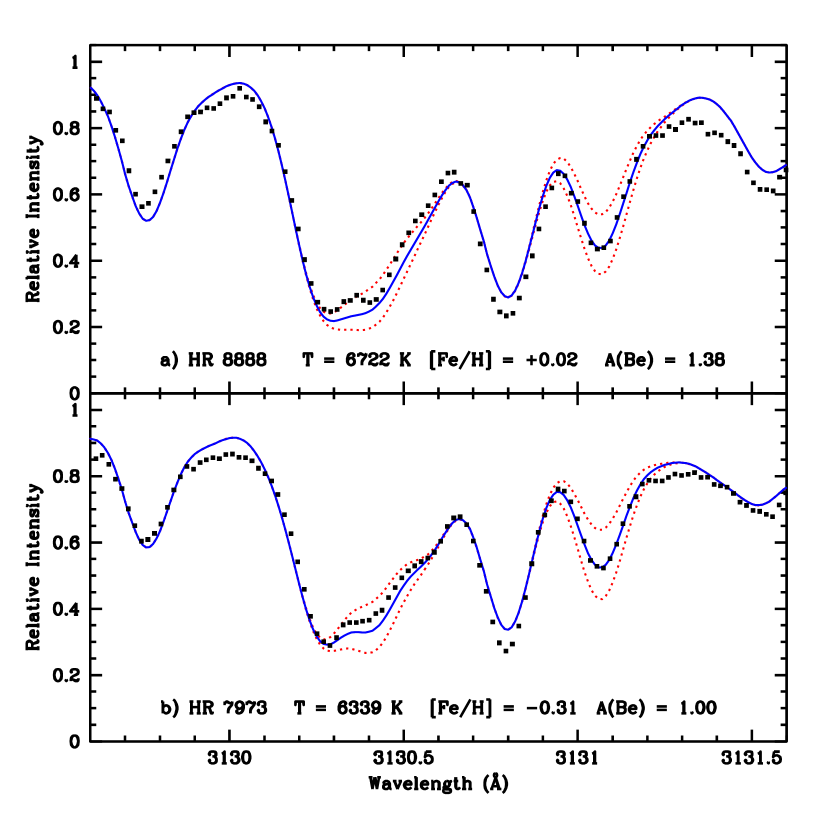
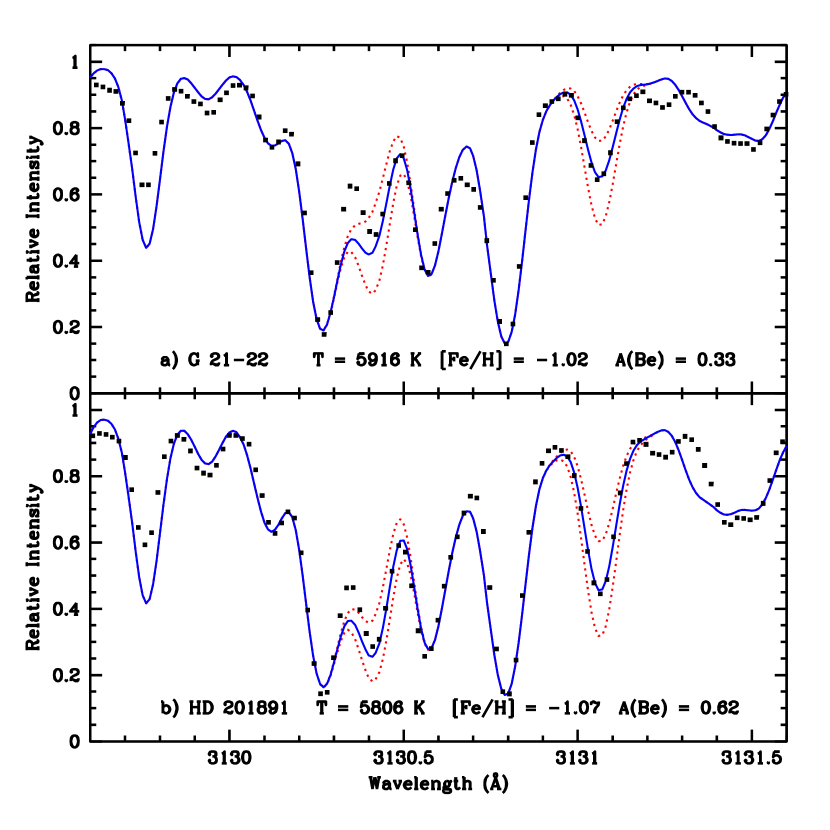
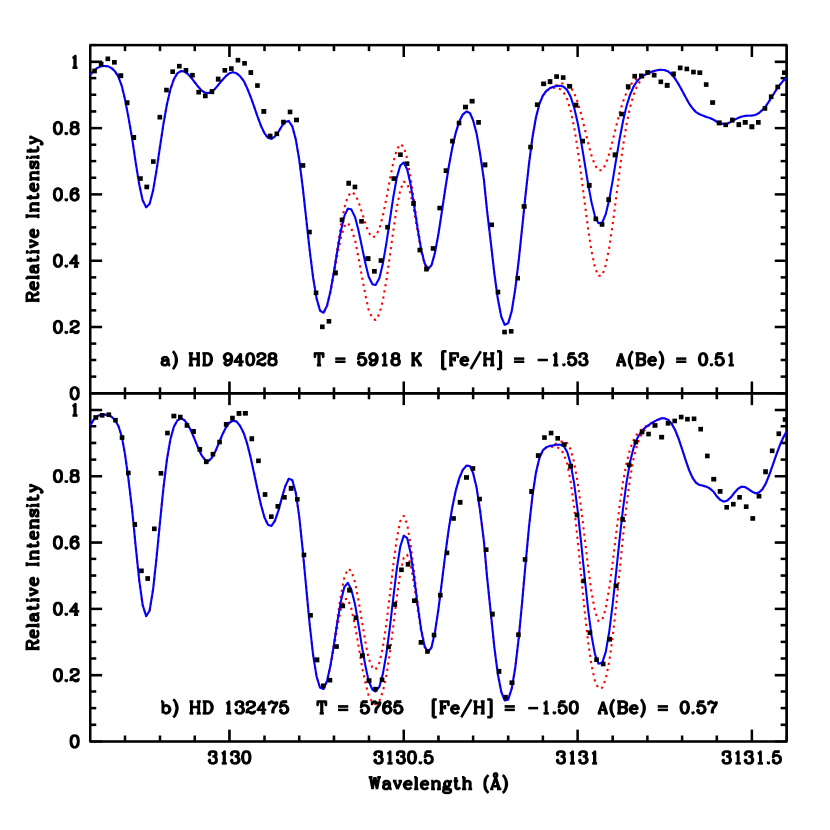
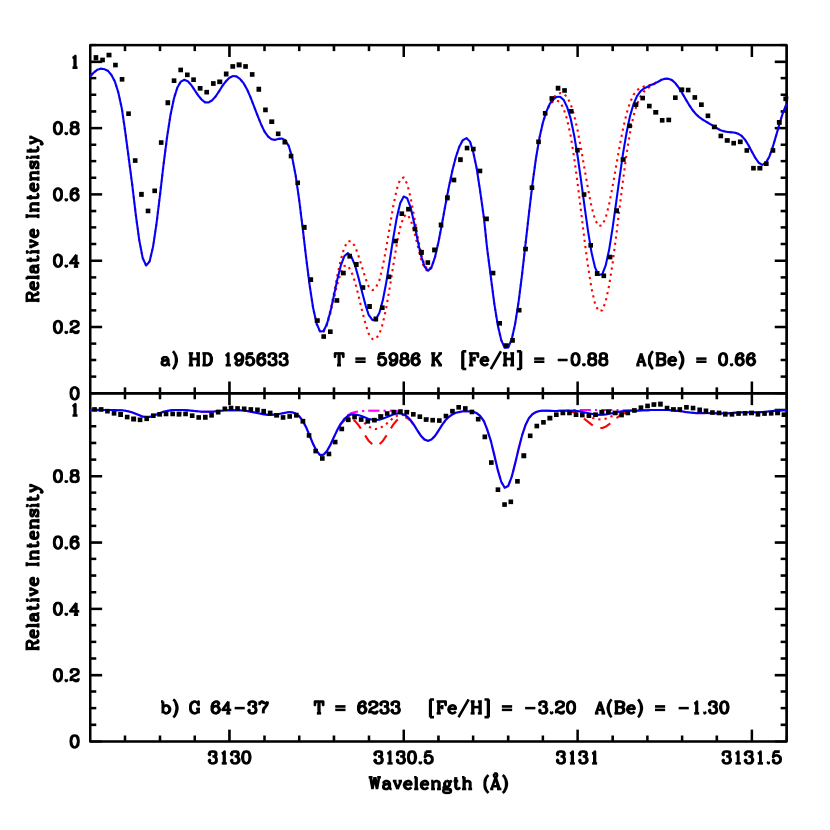
We have determined A(Be) = log N(Be)/N(H) +12.00 for our stars. The spectrum synthesis fits for all eight stars are shown by pairs in Figures 3 - 6. For clarity, these figures contain a smaller wavelength interval than that which we used to do the synthesis; the synthesis extends longward by another Å. We adjusted four parameters (continuum level, wavelength shift, broadening, and abundance) to get the best fit over this 3 Å region. To find the Be abundance in the higher metallicity stars we relied on the longer wavelength line, 3131, because it it less blended than the 3130 line. This can be seen in Figure 3 where the blended line is not as well reproduced as the 3131 line is. (In addition, those two stars have spectra that are broadened somewhat by rotation which increase the blending effect.) For the lower metallicity stars both lines could be used, but the longer wavelength line was weighted more, except for G 64-37 with [Fe/H] = 3.20 where all the lines are weak (including the Be II lines), so we used the stronger, i.e. shorter wavelength, of the two lines. The adopted Be abundances are given in Table 3 along with the errors (see next section). Also included in Table 3 are the Li abundances for each of these stars taken from Novicki (2005), Rebolo et al. (1988), Chen et al. (2001) and Boesgaard et al. (2001).
3.3 Error Estimates
We have estimated the uncertainty in the Be abundances from the errors of the stellar parameter determinations and from the accuracy of the spectrum synthesis fits. To do this we have used the Kurucz grid models at temperatures of 5750, 6000, 6250, and 6500 K, log g values of 4.0 and 4.5, and a range in [Fe/H] values: +0.10, 0.00, 0.10, 0.20, 0.30, 0.50, 1.00, 1.50, 2.00, 2.50, and 3.00. We have tested the dependency on A(Be) of the microturbulence parameter, , by running models with 2.0, 1.5, and 1.25 km s-1. Here is a brief summary: an error of 80 K in Teff gives an error in A(Be) of 0.01 (except there is no change from 6000 - 6250 K at log g of 4.5); an error of 0.10 in [Fe/H] gives an error of 0.03 - 0.04 in A(Be) (except at low [Fe/H] where a change of 0.5 in [Fe/H] gives an error of 0.01); and an uncertainty in log g of 0.2 produces errors in A(Be) from 0.07 (at the high temperature) to 0.10 (at the lower temperatures in our models); a change in 0.25 km s-1 in is typically 0.00 - 0.02 in A(Be). Thus the typical errors in A(Be) for our stars are 0.01, 0.02, 0.01, but 0.10. The accuracy of the spectrum synthesis fits is estimated from how large a change in A(Be) can still represent the observed spectrum with adjustments in the continuum (which is partly determined by the S/N of the spectrum) and gaussian smoothing in the synthetic spectra. This is typically 0.05 to 0.06 dex, but is 0.12 dex in G 64-37 which has S/N of only 87. The final errors (added in quadrature) for each star are given in Table 3.
In addition there may be uncertainties resulting from effects due to 1D vs. 3D models as discussed by Primas et al. (2000a). According to the work of García López, Severino & Gomez (1995) and Kiselman & Carlsson (1995), NLTE effects are found to be insignificant for Be.
4 Results and Discussion
The Be abundances determined here can be compared to those in the literature. For HR 8888 we find A(Be) = +1.38 0.10 in excellent agreement with 1.44 0.13 in Boesgaard et al. (2001) from CFHT/Gecko data. For HD 94028 we derive a value for A(Be) of +0.51 0.12, agreeing with 0.54 0.08 determined by Boesgaard et al. (1999a) from Keck/HIRES data.
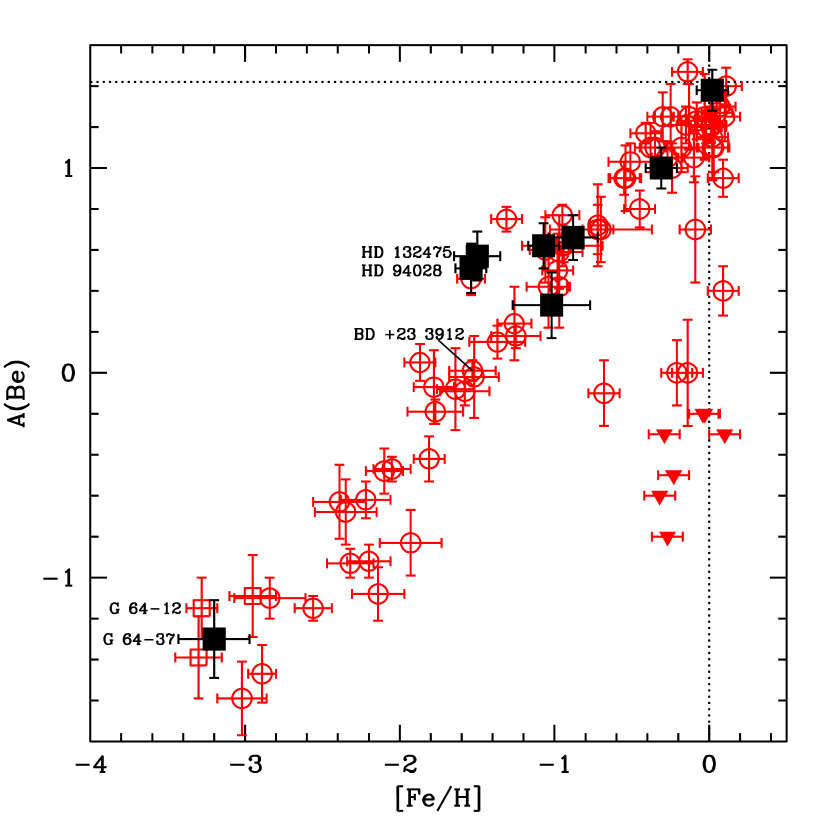
Figure 7 plots A(Be) vs. [Fe/H] for a larger sample of stars from several sources to put our results in context. In order to make meaningful comparisons the data shown are all on the same temperature scale, use Kurucz models, and use the same line list for the spectrum synthesis; they are results from Boesgaard et al. (1999a), Boesgaard (2000), Boesgaard et al. (2004). Three of the lowest metallicity stars (shown as open squares in the figure) are from Primas et al. (200a, 200b), who also used Kurucz models and our temperature scales. Our stars are superposed on the plot as large filled squares. The five stars with [Fe/H] 1.10 fit well in the context of the relationship between Be and Fe. The large square in the upper right is our value for HR 8888. Our large square labeled HD 94028 is offset a small amount from the circle below it from the Boesgaard et al. (1999a) value. Our result is a confirmation of the high Be abundance found earlier. It also indicates that the spread in A(Be) at this metallicity ([Fe/H] 1.5) is real; Boesgaard et al. (1999a) remarked in their discussion of this star that its high Be abundance might indicate an intrinsic dispersion in Be at a given Fe. Two other stars, HD 132475 and the low metallicity star, G 64-37, deserve individual discussion; they are shown with labels in Figure 7.
4.1 HD 132475
Novicki (2005) had observed that HD 132475 (with [Fe/H] = 1.50) has a Li abundance, A(Li) = 2.390.04, that is more than 3 above the “plateau” abundance (2.24 dex at its metallicity and temperature). As a result, we chose to measure the Be abundance of this star to see if its Be abundance is also greater than expected. Figure 5b shows the fit to the Be spectrum for this star, and it shows the best-fit abundance of A(Be) = 0.57. When plotted against the data from the literature (as shown in Figure 7), this star has a Be abundance which is about 0.5 dex above the other stars at that metallicity, but similar to HD 94028. There is another star in the Novicki (2005) Li sample which has a Li abundance significantly greater than the plateau value, BD +23 3912 at A(Li) = 2.510.01. The abundances in this star are discussed in detail by King, Deliyannis & Boesgaard (1996). They measured abundances of other elements (C, O, Na, Al, Eu, Y, Zr, Ba, La, Nd, Sm) and found them to be normal. This star has also been observed for Be by Boesgaard et al. (1999a) and has normal Be. These two stars (HD 132475 and BD +23 3912 have similar atmospheric parameters — Teff = 5765 K, [Fe/H] = 1.50, and log g = 3.60 for HD 132475, and Teff = 5695, [Fe/H] = 1.53, and log g = 3.77 for BD +23 3912 — and therefore might be expected to have similarly large Be abundances. In fact, BD +23 3912 has a Be abundance which is perfectly in line with the other stars at that metallicity: A(Be) = 0.18. It is possible that the Li enrichment is due to the -process in supernovae which produces Li and B, but not Be (Woosley et al. 1990, Timmes et al. 1995).
One possible explanation for the high measured Li and Be abundances for HD 132475 is that the Teff we use may be too high. It is not likely, though, that the Teff has been dramatically overestimated; the spectroscopic temperature (5765 K) and the photometric temperature (5777 K) are in excellent agreement with each other. Also, the literature estimates for this star’s temperatures range from 5550-5788 K, which is consistent on the high end with our estimate (and, as seen in 3.2, A(Be) is only weakly dependent on temperature). The other major factor in the Be abundance estimate is log g, which we get from our spectroscopic analysis to be equal to 3.60. Bonifacio & Molaro (1997) find log g= 3.65, Hartmann & Gehren (1988) find log g = 3.50 and Fulbright (2002) finds 3.60. These literature values agree with our log g within our error of 0.2 dex.
HD 132475 was included in the sample of Fulbright (2000, 2002) who studied the abundances and kinematics of a large group of field stars. He found [Fe/H] = 1.59 (similar to our 1.50), but A(Li) = 2.23 0.10. His lower Li abundance results from his use of Teff = 5575 K which is 190 K cooler than ours and the higher temperature would bring it into alignment with our Li value. In comparison to his other stars at the metallicity of HD 132475, we see that it is in the upper range of abundances, especially for [Na/Fe], [Mg/Fe], [Si/Fe], [Y/Fe], [Zr/Fe], and [Ba/Fe]. His lower temperature only affects the abundances of those elements by small amounts (0.02 to +0.07 dex) according to his Table 8 (Fulbright 2000), but those abundances in HD 132475 are typically 0.2 dex above the mean for the other stars at the metallicity and Galactic rest-frame velocity, vrf = 156 km s-1 of HD 132475. The enhancement of the alpha-elements, Mg and Si, indicates Galactic chemical evolution (GCE) has occurred which would also result in an enrichment of Li and Be.
The increase of Be with Fe shown in Figure 7 indicates that Be is enriched over time by galaxy-wide processes. However, stars like HD 132475 and HD 94028 seem to indicate that there may be additional local enrichments, perhaps by spallation in the vicinity of Type II supernovae where C, N, and O atoms may be accelerated into the local gas and are broken into smaller atoms such as Li, Be, and B. Given the typical errors bar shown in Figure 7, there does seem to be a spread in A(Be) at a given [Fe/H]. The idea that the CNO atoms can act as the “bullets” in spallation reactions was suggested by Duncan et al. (1997) in their paper on B abundances in the Galaxy.
In a series of papers by Parizot (2000, 2001) and Parizot & Drury (1999, 2000) these authors promote the idea that the light elements can be formed efficiently inside a superbubble with multiple supernovae. In this case the accelerated CNO atoms bombard the ambient material to create the “pieces” which are Li, Be, and B atoms (along with other products like 11C, He isotopes, etc.). In the 2000 paper Parizot & Drury discuss a bimodal production of the light elements: “standard” GCR production (originally suggested by Reeves, Fowler & Hoyle 1970) and spallation reactions from a collection of supernovae inside a superbubble. They point to the similar pair of stars, HR 94028 and HD 219617, from Boesgaard et al. (1999a) which differ in A(Be) by 0.6 dex although they have similar temperatures, metallicities and log g values; the “excess” Be in HD 94028 could be the “local” contribution from the superbubble component. We have confirmed the excess Be abundance in HD 94028 and now add HD 132475 as another candidate for extra enrichment from a superbubble of supernovae.
It is hypothesized by Fields et al. (2002) that hypernovae could produce large amounts of the light elements, Li, Be, and B from their exploding C-O cores. This mechanism provides the local enrichment of the light elements, including Be, in the next generation of stars. In these hypernovae the composition is basically C and O, the parent nuclei of the light elements. Furthermore, the high kinetic enery released would accelerate the envelope sufficiently for spallation to occur with C and O being the “bullets.” Hypernovae candidates have been observed, e.g. by Iwamoto et al. (1998, 2000), Kawabata, et al. (2003) and Mazzali et al. (2002, 2004) and may be associated with gamma-ray bursts.
4.2 G 64-37
A number of authors (Thorburn 1994, Ryan et al. 1996, 1999) have observed that G 64-12 and G 64-37 are two dwarf stars with several characteristics in common. They have similar temperatures (their temperatures differ from 20 K to 200 K depending on the author, with G 64-12 always being hotter), metallicities (3.6 vs. 3.2), log g values and locations on the sky. They have one key difference – their Li abundances are different by more than a factor of two: 2.40 vs. 2.06 (Novicki 2005).
With no obvious explanation for the difference in the Li abundances, we turn to Be to see if there are any clues there. Primas et al. (2000a) measured the Be abundance in G 64-12 to be A(Be) = 1.15 0.15, which is above the mean trend of Be vs. [Fe/H] at that metallicity (shown in Figure 7). These authors argue that the Be abundances of the stars at this metallicity strengthen the idea of a possible flattening in the Be-Fe trend – a possible plateau. A plateau in Be abundance at low metallicity could indicate that, as an analog to the Li plateau, some Be was produced in an inhomogeneous BBN. A high Be abundance could also result from some enrichment process as discussed in the previous section (e.g. Parizot & Drury 2000, Fields et al. (2002).
Novicki (2005) finds the Li abundance in G 64-12 to be 2.40 0.03 which is +0.3 dex above the Li plateau. If the abundance of Li in G 64-12 has been augmented to lift it significantly above the Li plateau value, it is also possible that the Be abundance could have been augmented as well by the same process. This star, G 64-12, is key to the argument that there is a Be plateau at low metallicities. If it does have augmented Li and Be, by definition the measured abundances of these elements are not primordial, and it should not be used in any plateau analysis. For G 64-37 Novicki (2005) derives a Li abundance of +2.06 0.04, or less than half the amount in G64-12.
We determine the abundance of Be in G 64-37 to be A(Be) = 1.30 0.19, which is lower than the abundance measured by Primas et al. (2000a) for G 64-12 of A(Be) = 1.15 0.15, but not different within the errors. The spectrum for this star is shown in Figure 6, along with four syntheses at 0.70, 1.00, 1.30, and . The stronger Be II line at 3130 Å is clearly present and 1.30 seems to give a reasonable fit. A higher S/N spectrum may allow us to make a more accurate determination. So both Li and Be are more abundant in G 64-12 than in G 64-37. The three stars at very low metallicity which have measurable Be abundance are G 64-12 as measured by Primas et al. (2000a), CD 24 17504 by Primas et al. (2000b) and this work on G 64-37.
It has been suggested by Vangioni-Flam et al. (1998) that the lowest metallicity stars may have increased Li and Be resulting from shock acceleration of light nuclei due to multiple supernovae in a superbubble. The excesses above the plateau for these oldest stars would come from the explosions of early generations of very massive stars, 60 – 100 . Since only G 64-12 is enhanced and apparently not G 64-37, the superbubble giving rise to G 64-12 apparently did not include G 64-37.
5 Summary and Conclusions
We have determined Be abundances in eight stars from high-resolution, high-S/N spectra from the 8.2 m Subaru telescope using HDS. The stars cover the metallicity range [Fe/H] from +0.02 to 3.20. The most metal-rich star, HR 8888, has the meteoritic abundance of Be, i.e. it is undepleted. The four stars with [Fe/H] between 0.3 and 1.1 fall perfectly along the previously established relationship between A(Be) and [Fe/H]. There are two stars, HD 94028 and HD 132475, with [Fe/H] = 1.5 and these both fall significantly above the observed trend of A(Be) with [Fe/H]. With HD 94028 we confirm the previous observation of a high Be abundance from Keck/HIRES observations (Boesgaard et al. 1999a). HD 132475 was observed for Be because we had found its Li abundance to be 3 higher than other Li-plateau stars at its metallicity. The Be abundance of HD 132475 is 4 above the Fe-Be trend. (Another star, BD +23 3912, which has similar stellar parameters and a high Li abundance has normal Be, not the same high Be abundance as HD 94028 and HD 132475.) Now there are two stars with Be abundances higher than typical at [Fe/H] = 1.5 by some 0.5 - 0.6 dex; this implies that there is a cosmic dispersion in the Be abundances, probably as a result of the environment around the star at the time of its formation.
The general trend in Be vs. Fe shows that there are Galaxy-wide processes at work that increase Be and Fe over time, but the two stars above the trend show that there are local enrichments in addition. Such Be enhancements could be caused by extra Be production by spallation in superbubbles from multiple supernova explosions (Parizot & Drury 2000) or in the vicinity of hypernovae (Fields et al. 2002).
There is some evidence in the most metal-poor stars that there is a plateau in the Be abundance. We have added a third star to the “plateau investigation” below [Fe/H] = 3.0 with our observation of G 63-37 with [Fe/H] = 3.20. This star has A(Be) = 1.30 which puts it in line with the general Fe-Be trend, and not evidence of a Be plateau.
We compared the two stars G 64-12 and G 64-37, which have similar temperatures and gravities and very low metallicities ([Fe/H] 3.3). They have different light element abundance patterns. G 64-12 has higher Li than the plateau value at A(Li) = 2.40, while G 64-37 is lower than the Li plateau at A(Li) = 2.06. Primas (2000a) found a high Be abundance in G 64-12 of A(Be) = 1.15, above the trend, while our A(Be) for G 64-37 of 1.30 is consistent with the general trend. This adds to the evidence for a dispersion in Be at a given metallicity.
We suggest that there are two types of spallation. One is responsible for the general increase of Be with Fe (or O) due to Galaxy-wide spallation. The other results from local enhancements by spallation near multiple supernovae or hypernovae.
References
- (1)
- (2) Alonso, A., Arribas, S. & Martinez-Roger, C. 1996, A&AS, 117, 227
- (3)
- (4) Beers, T.C., Rossi, S., Norris, J.E., Ryan, S.G. & Shefler, T. 1999, AJ, 117, 981
- (5)
- (6) Boesgaard, A.M. 2000, IAU Symp. 198, The Light Elements and their Evolution, ed. L. da Silva, R. de Medeiros, & M. Spite (San Francisco: Astr. Soc. Pacific), 389
- (7)
- (8) Boesgaard, A.M. 2004, in “The Origin and Evolution of the Elements” ed. A. McWilliam & M. Rauch, (Cambridge: Cambridge University Press), p. 117
- (9)
- (10) Boesgaard, A.M., Deliyannis, C.P., King, J.R., Ryan, S.G., Vogt, S.S. & Beers, T.C. 1999a, AJ, 117, 1549
- (11)
- (12) Boesgaard, A.M., Deliyannis, C.P., King, J.R. & Stephens, A. 2001, ApJ, 553, 754
- (13)
- (14) Boesgaard, A.M., King, J.R., Cody, A.M., Stephens, A. & Deliyannis, C.P. 2005, ApJ, 629, 832
- (15)
- (16) Boesgaard, A.M., King, J.R., Deliyannis, C.P. & Vogt, S.S. 1999b, AJ, 117, 492
- (17)
- (18) Boesgaard, A.M. & Novicki, M. 2005, ApJ, 633, L125
- (19)
- (20) Bonifacio, P. & Molaro, P. 1997, MNRAS, 285, 847
- (21)
- (22) Chen, Y.Q., Nissen, P.E., Benoni, T. & Zhao, G. 2001, A&A, 371, 943
- (23)
- (24) Chen, Y.Q., Nissen, P.E., Zhao, G., Zhang, H.W. & Benoni, T. 2000, A&AS, 141, 491
- (25)
- (26) Clementini, G., Gratton, R.G., Caretta, E. & Sneden, C. 1999, MNRAS, 302, 22
- (27)
- (28) Cutri, R.M. et al. 2003, VizieR Online Data Catalog, 2246, 0
- (29)
- (30) Carney, B. W. 1983, AJ, 88, 623
- (31)
- (32) Carney, B. W., Latham, D.W., Laird, J.B. & Aguilar, L.A. 1994, AJ, 107, 2240
- (33)
- (34) Duncan, D. K., Primas, F., Rebull, L.M., Boesgaard, A.M., Deliyannis, C.P., Hobbs, L.M., King, J.R., & Ryan, S.G. 1997, ApJ, 488, 338
- (35)
- (36) Fields, B., Daigne, F., Cassè, M. & Vangioni-Flam, E. 2002, ApJ, 581, 389
- (37)
- (38) Fulbright, J.P. 2000, AJ, 120, 1841
- (39)
- (40) Fulbright, J.P. 2002, AJ, 123, 404
- (41)
- (42) García López, R.J., Severino, G. & Gomez, M.T. 1995, A&A, 297, 787
- (43)
- (44) Gratton, R.G., Carretta, E. & Sneden, C 1996, A&A, 314, 191
- (45)
- (46) Grevesse, N. & Sauval, A.J. 1998, Space Sci. Rev., 85, 161
- (47)
- (48) Hartmann, K. Gehren, T. 1988, A&A, 199, 269
- (49)
- (50) Iwamoto, K. et al. 1998, Nature, 395, 672
- (51)
- (52) Iwamoto, K. et al. 2000, ApJ, 534, 660
- (53)
- (54) Johnson, H.L. 1968, in “Nebulae and Interstellar Matter,” (Chicago: The University of Chicago Press), 167
- (55)
- (56) Kawabata, K.S. et al. 2003, ApJ, 593, L19
- (57)
- (58) King, J.R. 2002, PASP, 114, 25
- (59)
- (60) King, J.R., Deliyannis, C.P. & Boesgaard, A.M. 1996, AJ, 112, 2839
- (61)
- (62) Kiselman, D. & Carlsson, M. 1996, A&A, 311, 680
- (63)
- (64) Kurucz, R.L. 1993, CD-ROM 1, Atomic Data for Opacity Calculations (Cambridge: SAO)
- (65)
- (66) Lemoine, M., Vangioni-Flam, E. & Cassé, M. 1998, ApJ, 499, 735
- (67)
- (68) Magain, P. 1984, A&A, 134, 189
- (69)
- (70) Malaney, R. & Mathews, G. 1992, Phys. Rev., 229, 147
- (71)
- (72) Mazzali, P.A. et al. 2002, ApJ, 572, L61
- (73)
- (74) Mazzali, P.A., Deng, J., Maeda, K., Nomoto, K., Filippenko, A.V. & Matheson, T. 2004, ApJ, 614, 858
- (75)
- (76) Nissen, P.E., Chen, Y.Q., Asplund, M. & Pettini, M. 2004, A&A, 415, 993
- (77)
- (78) Nissen, P.E., Hog, E. & Schuster, W.J. 1997 in ESA Symposium “Hipparcos-Venice ’97” ESA SP-402, ed. E. Battrick, Noordwijk, p. 225
- (79)
- (80) Noguchi, K., et al. 2002, PASJ, 54, 855
- (81)
- (82) Novicki, M. 2005, Ph.D. Thesis, Univ. of Hawaii at Manoa
- (83)
- (84) Orita, M., Kajino, T. Boyd, R.N. & Mathews, G. 1997, ApJ, 488, 515
- (85)
- (86) Parizot, E. 2000, A&A, 362, 786
- (87)
- (88) Parizot, E. 2001, Sp. Sci. Rev., 99, 61
- (89)
- (90) Parizot, E. & Drury, L. 1999, A&A, 349, 673
- (91)
- (92) Parizot, E. & Drury, L. 2000, A&A, 356, L66
- (93)
- (94) Primas, F., Asplund, M., Nissen, P.E. & Hill, V. 2000a, A&A, 364, L42
- (95)
- (96) Primas, F., Molaro, P., Bonifacio, P. & Hill, V. 2000b, A&A, 362, 366
- (97)
- (98) Ramaty, R., Lingenfelter, R.E. & Kozlovsky, B. 2000, IAU Symp. 198, The Light Elements and their Evolution, ed. L. da Silva, R. de Medeiros, & M. Spite (San Francisco: Astr. Soc. Pacific), p. 51
- (99)
- (100) Ramaty, R. & Lingenfelter, R.E. 1999, in LiBeB, Cosmic Rays, and Related X- and Gamma-Rays, ASP Conf Series, vol. 171, eds. R. Ramaty, E. Vangioni-Flam, M. Cassè & K. Olive (San Francisco: A.S.P.), p. 104
- (101)
- (102) Rebolo, R., Molaro, P. & Beckman, J.E. 1988, A&A, 192, 192
- (103)
- (104) Reeves, H., Fowler, W. & Hoyle, F. 1970, Nature, 226, 727
- (105)
- (106) Ryan, S.G., Gregory, S.G., Kolb, U., Beers, T.C. & Kajino, T. 2002, ApJ, 571, 501
- (107)
- (108) Santos, N.C., Garcia Lopez, R.J., Israelian, G., Mayor, M., Rebolo, R, Garcia-Gil, A., Pérez de Taoro, M.R. & Randich, S. 2002, å, 386, 1028
- (109)
- (110) Shuster, W.J. & Nissen, P.E. 1988, A&AS, 73, 225
- (111)
- (112) Shuster, W.J. & Nissen, P.E. 1989a, A&A, 222, 69
- (113)
- (114) Shuster, W.J. & Nissen, P.E. 1989b, A&A, 221, 65
- (115)
- (116) Sneden, C. 1973, Ph.D. thesis, Univ. of Texas at Austin
- (117)
- (118) Stephens, A, Boesgaard, A.M., King, J.R. & Deliyannis, C.P. 1997ApJ, 491, 339
- (119)
- (120) Stephens, A & Boesgaard, A.M. 2002, AJ, 123, 1647
- (121)
- (122) Thévenin, F. & Idiart, T.P. 1999, ApJ, 521, 753
- (123)
- (124) Timmes, F.X., Wooosley, S.E. & Weaver, T.A. 1995, ApJS, 98, 617
- (125)
- (126) Vangioni-Flam, E., Ramaty, R., Olive, K.A. & Cassé, M. 1998. A&A, 337, 714
- (127)
- (128) Woosley, S.E., Hartmann, D., Hoffman, R. & Haxton, W. 1990, ApJ, 356, 272
- (129)
- (130) Yi, S.K., Demarque, P. & Kim, Y. 2004, Ap&SS, 291, 261
- (131)
| Star | V | B-V | Night | Exp. Time | Total |
|---|---|---|---|---|---|
| (min) | S/N | ||||
| HD 94028 | 8.23 | 0.471 | 27 May 2003 | 10 | 134 |
| G 64-37 | 11.14 | 0.370 | 27 May 2003 | 270 | 87 |
| HD 132475 | 8.57 | 0.577 | 27 May 2003 | 20 | 96 |
| G 21-22 | 10.72 | 0.527 | 27 May 2003 | 90 | 96 |
| HD 195633 | 8.54 | 0.523 | 06 Jun 2001 | 5 | 143 |
| HR 7973 | 6.01 | 0.430 | 06 Jun 2001 | 25 | 146 |
| HD 201891 | 7.38 | 0.510 | 06 Jun 2001 | 14 | 188 |
| HR 8888 | 6.61 | 0.360 | 27 May 2003 | 3 | 116 |
| Star | Teff | (T) | (log g) | [Fe/H] | ([Fe/H]) | ||
|---|---|---|---|---|---|---|---|
| (K) | (K) | (dex) | (dex) | (dex) | (dex) | (km s-1) | |
| HD 94028 | 5907 | 69 | 4.44 | 0.20 | 1.54 | 0.10 | 1.5 |
| G 64-37 | 6233 | 69 | 4.41 | 0.30 | 3.20 | 0.23 | 1.5 |
| HD 132475 | 5765 | 62 | 3.60 | 0.20 | 1.50 | 0.15 | 1.4 |
| G 21-22 | 5916 | 84 | 4.59 | 0.30 | 1.02 | 0.25 | 1.5 |
| HD 195633 | 5986 | 115 | 3.89 | 0.08 | 0.88 | 0.16 | 2.0 |
| HR 7973 | 6339 | 70 | 4.20 | 0.10 | 0.31 | 0.10 | 1.8 |
| HD 201891 | 5806 | 110 | 4.42 | 0.20 | 1.07 | 0.10 | 1.2 |
| HR 8888 | 6722 | 50 | 4.00 | 0.20 | +0.02 | 0.10 | 2.5 |
| Star | Teff | [Fe/H] | A(Li) | Li refaaBN = this work; RMB = Rebolo et al. (1988); C01 = Chen et al. (2001); B01 = Boesgaard et al. (2001) | A(Be) | (Be) |
|---|---|---|---|---|---|---|
| (K) | (dex) | (dex) | dex | dex | ||
| HD 94028 | 5907 | 1.54 | 2.25 | BN | 0.51 | 0.12 |
| G 64-37 | 6233 | 3.20 | 2.06 | BN | 1.30 | 0.19 |
| HD 132475 | 5765 | 1.50 | 2.39 | BN | 0.57 | 0.12 |
| G 21-22 | 5916 | 1.02 | 2.48 | BN | 0.33 | 0.16 |
| HD 195633 | 5986 | 0.88 | 2.15 | RMB | 0.66 | 0.11 |
| HR 7973 | 6339 | 0.31 | 2.17 | C01 | 1.02 | 0.10 |
| HD 201891 | 5806 | 1.07 | 1.98 | BN | 0.62 | 0.11 |
| HR 8888 | 6722 | +0.02 | 3.30 | B01 | 1.42 | 0.10 |