The effect of a strong external radiation field on protostellar envelopes in Orion
We discuss the effects of an enhanced interstellar radiation field (ISRF) on the observables of protostellar cores in the Orion cloud region. Dust radiative transfer is used to constrain the envelope physical structure by reproducing SCUBA 850 m emission. Previously reported 13CO, C17O and H2CO line observations are reproduced through detailed Monte Carlo line radiative transfer models. It is found that the 13CO line emission is marginally optically thick and sensitive to the physical conditions in the outer envelope. An increased temperature in this region is needed in order to reproduce the 13CO line strengths and it is suggested to be caused by a strong heating from the exterior, corresponding to an ISRF in Orion times stronger than the “standard” ISRF. The typical temperatures in the outer envelope are higher than the desorption temperature for CO. The C17O emission is less sensitive to this increased temperature but rather traces the bulk envelope material. The data are only fit by a model where CO is depleted, except in the inner and outermost regions where the temperature increases above 30-40 K. The fact that the temperatures do not drop below K in any of the envelopes whereas a significant fraction of CO is frozen-out suggest that the interstellar radiation field has changed through the evolution of the cores. The H2CO lines are successfully reproduced in the model of an increased ISRF with constant abundances of 3–5.
Key Words.:
stars: formation, radiative transfer, astrochemistry1 Introduction
Giant molecular clouds are the formation sites of massive stars in our Galaxy with the nearby Orion molecular clouds being the prime candidates for detailed studies of the earliest protostellar stages. An interesting difference for the studies of these cores compared to isolated systems is the large number of OB stars in the immediate vicinity: the UV radiation from these early-type stars ionizes their surrounding material within a few parsecs, and also affects the thermal balance and chemistry in intermediate and low-mass protostellar cores distributed over much larger scales. As recent studies indicate that large numbers of solar-type stars may be formed in these regions, it is of great importance to address the feedback between high- and low-mass star formation, in particular, for comparison with low-mass protostars formed in relative isolation in clouds such as Taurus.
In this paper we present a radiative transfer study of three intermediate mass protostars in Orion from the sample of Johnstone et al. (2003). The physical properties of their envelopes are established from 1D dust radiative transfer modeling, and CO isotopic and H2CO line observations are analyzed using Monte Carlo line radiative transfer. In particular, we discuss the importance of heating the protostellar envelope via an enhanced external radiation field and the constraints on this heating from optically thick CO isotopomers.
Li et al. (2003) recently estimated the gas kinetic temperatures for a sample of pre-stellar cores in Orion using inversion transitions of NH3. They found that these cores had lower temperatures than their surroundings, which they attributed to the impact of the strong interstellar radiation field (ISRF) in the Orion region. This is reminiscent of the situation for pre-stellar cores in more quiescent star forming regions where temperature gradients due to a standard interstellar radiation field are found in radiative transfer models reproducing submillimeter continuum maps (e.g., Evans et al., 2001). Wilson et al. (1999) suggested that the ratios of peak temperatures of optically thick lines with different critical densities could be used as a diagnostic of temperatures. Applied to cores in Orion their results also suggested strong temperature gradients in the region around Orion BN/KL with more dense gas traced by NH3 inversion lines colder ( K) than less dense gas ( K) probed by CO lines. In contrast Wilson et al. found similar temperatures probed by the NH3 and CO lines for cores further south from the Orion BN/KL region and they argued that these cores are dominated by internal rather than external heating. This illustrates that an important point for the thermal balance of protostellar objects is whether external heating can compete with the central source luminosity.
The strong interstellar radiation field may also be reflected in the chemistry, for example by increasing the photodissociation and photoionization. The strength of the UV field can for example be probed by the emission of C+ and has been applied to the Orion clouds where UV fields enhanced by factors of have been suggested (e.g., Tielens & Hollenbach, 1985a, b; Burton et al., 1990; Stacey et al., 1993; Mookerjea et al., 2003). The strong UV field will also lead to enhanced abundances of electrons and thus abundance decreases of molecular ions, such as HCO+ and N2H+ that otherwise work as destroyers of common molecules. Support for this is found within the OMC1 cloud core located immediately behind the Orion Nebula Cluster where Ungerechts et al. (1997) infer abundance gradients along the cloud, with increasing abundances of species such as HCN, CH3OH, HC3N, and SO toward the Orion BN/KL region.
The astrochemistry study by Johnstone et al. (2003) considered a selection of cornerstone molecules in order to quantify the range of conditions for which individual molecular line tracers provide physical or chemical information. The morphological study compared a variety of locations along the Integral Shaped Filament (ISF) in Orion A (Bally et al., 1987; Johnstone & Bally, 1999), chosen to represent a range of physical conditions including enshrouded protostars, a bright PDR knot, and a shock front. The main conclusion of the paper was that the abundances of many molecular species correlate with source energetics, likely a result of the importance of temperature dependent desorption in maintaining gas-phase molecules. A significant finding of the study was the need for a warm outer envelope for all of the protostellar sources, as expected given the proximity of numerous O and B stars. The study suffered, however, from a simplistic treatment of the molecular line abundances derived from single temperature and density statistical equilibrium calculations and thus was unable to fully consider the effect of an enhanced radiation field on the outer regions of the embedded protostars.
This paper presents a continuation of the Johnstone et al. (2003) study, performing a detailed radiative transfer analysis of the physical and chemical properties of a subsample of the regions studied in that paper. We concentrate on the embedded intermediate mass protostellar sources, MMS6, MMS9, and FIR4 where the assumption of constant density and temperature throughout the envelope is most suspect. All three sources have large envelope masses, . The implied dust temperatures, , for the sources are K while the 13CO lines have peak brightness temperatures K which is difficult to produce unless the cores are bathed in an enhanced interstellar radiation field. The properties of the cores studied in this paper are summarized in Table 1 with further details presented in Johnstone et al. (2003). Even though the focus of this paper is on a few selected cores in Orion, a lot of the results brought up in this discussion are valid beyond these specific sources.
This paper is laid out as follows: sect. 2 introduces the general problem, including the observational indications for a strong interstellar radiation field, and describes the modeling approach, including the possible constraints from continuum and line observations. Sect. 3 then discusses possible refinements and implications of the models, in particular, the resulting CO abundance structures and the reproduction of H2CO multi-transition observations. The evolutionary implications are discussed in Sect. 4. Sect. 5 concludes the paper suggesting possible further tests and future work.
| Source | MMS6 | MMS9 | FIR4 | |
|---|---|---|---|---|
| [] | 60 | 90 | 400 | |
| Projected distance to the Trapeziuma | [pc] | 2.9 | 2.3 | 1.7 |
| (peak) | [Jy beam-1] | 7.5 | 2.5 | 7.5 |
| (13CO 3–2)b | [K km s-1] | 40.7 | 59.1 | 76.2 |
| (C17O 3–2)b | [K km s-1] | 4.78 | 2.88 | 3.97 |
| (H2CO )b | [K km s-1] | 5.33 | 3.07 | 9.82 |
| (H2CO )b | [K km s-1] | 0.53 | 0.28 | 2.96 |
| (H2CO )b | [K km s-1] | 2.56 | 0.94 | 5.24 |
aAssuming a distance to Orion of 450 pc. bLine intensity, .
2 Models: constraining the ISRF
Since the protostellar cores in Orion appear warmer than expected from heating by only the low luminosity central sources, they require the enhanced interstellar radiation field produced by the nearby OB stars for additional heating. In this section we present continuum and line radiative transfer models which describe the thermal structure of these cores and can be used for comparison to the observations. First, however, we describe direct evidence of the contribution from external heating of these cores - in particular from 13CO isotopic lines and dust continuum observations obtained with the James Clerk Maxwell Telescope in a 15″ beam (Johnstone et al., 2003; Jørgensen et al., 2004).
2.1 13CO 3–2 and ISRF
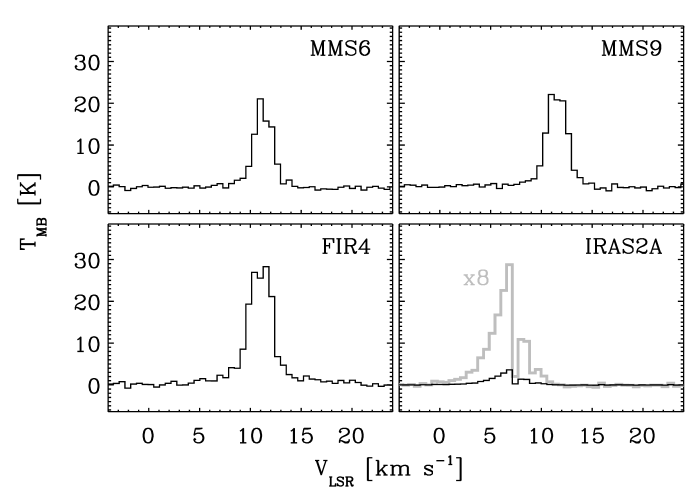
Fig. 1 compares the 13CO 3–2 spectra toward the three sources. Also shown is the low-mass protostar, NGC 1333-IRAS 2A (Jørgensen et al., 2004) which has a lower luminosity (16 ) than the Orion sources but also is located at shorter distances (220 pc). The peak temperatures for the three Orion sources are significantly higher than what is observed for NGC 1333-IRAS 2A. Also note that the lines are relatively Gaussian with less significant self-absorption. Since 13CO 3–2 is optically thick for the column densities representative of the studied cores, these spectra indicate that a relatively warm foreground layer must be present to prevent any self-absorption dip from the larger scale cold envelope. Comparing the 13CO and C17O 3–2 spectra from Johnstone et al. (2003) provides further evidence: the 13CO lines are about a factor 2 broader than those of C17O, suggesting that the lines are optically thick.
If the 13CO 3–2 line is optically thick, the peak temperature provides a measures of the excitation temperature in the region of the envelope where the optical depth reaches about unity. For the high densities in these envelopes the CO gas is in LTE (e.g., Jørgensen et al., 2002) and the excitation temperature directly measures the gas kinetic temperature. Furthermore at these densities the gas and dust temperatures are expected to be closely coupled (e.g., Ceccarelli et al., 1996; Doty & Neufeld, 1997) and can as a first approximation be assumed identical. In the following section we carry out the detailed line radiative transfer to calculate the full non-LTE line excitation and explore the relevance of the dust/gas temperature decoupling.
Correcting the peak brightness temperatures =17–28 K (Johnstone et al., 2003) for the Rayleigh-Jeans approximation, indicates gas temperatures of =24–35 K, assuming that the emission fills the beam. Such temperatures are, however, impossible to reconcile with the central star being the sole source of luminosity. For a spherically symmetric, optically thin envelope heated by a single central source of luminosity, the dust temperature distribution is approximated by:
| (1) |
where is related to the power-law index of the dust opacity law, , through , (Scoville & Kwan, 1976; Doty & Leung, 1994; Chandler et al., 1998; Chandler & Richer, 2000). This would be the temperature probed by the 13CO 3–2 lines if the emission comes from a shell with diameter larger than the JCMT beam which is very optically thick in these lines. To reach a specific temperature at this radius the required luminosity is determined from Eq. (1):
| (2) |
Therefore, to produce peak temperatures =17–28 K in the JCMT beam at 330 GHz at the distance of Orion (460 pc), central sources of are needed, significantly higher than the luminosity of the observed sources. In contrast, the K for NGC 1333-IRAS 2A requires only 15-20 , comparable to the bolometric luminosity of the source (Jørgensen et al., 2002). It therefore appears that the only way to explain the 13CO 3–2 line emission for the Orion sources is to introduce a strong external source of heating.
2.2 Continuum models
To establish the physical structure of each core we adopted the same approach as in Jørgensen et al. (2002), using the 1D radiative transfer code Dusty (Ivezić et al., 1999) to simulate 850 m SCUBA images and to constrain the density distribution of each core by comparing to observations. As in Jørgensen et al. the opacities for coagulated dust grains with thin ice mantles at a density of cm-3 from Ossenkopf & Henning (1994) were adopted. The density profile is assumed to have a single radial power-law, . The power-law index, , is constrained through comparison between observed and modeled brightness profiles. The Orion protostars are located in the dense ridge of the ISF (Johnstone & Bally, 1999) complicating the extraction of a unique brightness profile. Greyscale images of each protostar are shown in Figure 2. The hashed regions in each plot were not included in the circular averaging procedure used to define the brightness profiles. The flux at 850 m for each source from Johnstone et al. (2003) was used to constrain the overall dust content in the core, that is the optical depth at the fiducial wavelength (see, e.g., discussion in Jørgensen et al., 2002). Following Evans et al. (2001) we adopt the average ISRF from the solar neighborhood of Black (1994) with the UV field from Draine (1978) added and scale this at every wavelength with a constant factor, (i.e., for the standard ISRF).
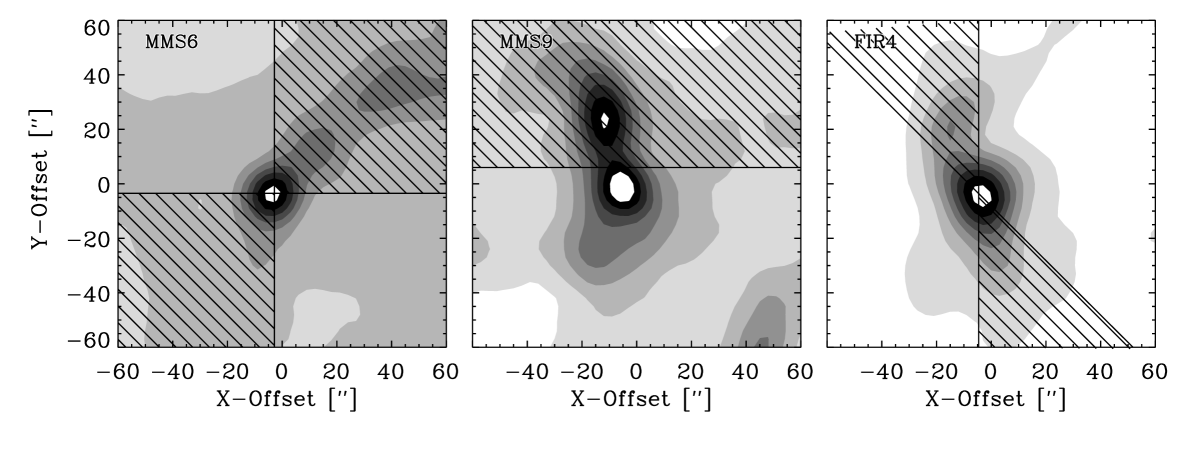
Fig. 3 illustrates the differences in the brightness profiles produced by varying the density profile slopes and the impact of the external interstellar radiation field. As shown, when including the ISRF a steeper density profile is required to fit the data. The best fit for MMS6 is a steep -envelope, whereas MMS9 and FIR4 have flatter -envelopes.

| ISRF | a | COb | C17Ob | In Figures | ||||
|---|---|---|---|---|---|---|---|---|
| 108 cm-3 | K | K km s-1 | K km s-1 | |||||
| MMS6 | 1 | 2.0 | 8.0 | 37 | 19 | 22.3 (56) | 10.2 (2.1) | 3a: dotted |
| 10 | 2.0 | 7.2 | 33 | 21 | 27.0 (51) | 9.95 (1.9) | 3a: dashed | |
| 100 | 2.0 | 6.5 | 30 | 26 | 37.4 (46) | 10.6 (1.7) | 3a: dotted-dashed | |
| 1000 | 1.5 | 2.4 | 5.9 | 31 | 58.6 (37) | 17.4 (1.4) | 3b: dashed | |
| 1000-D | 1.5 | 2.4 | 5.9 | 31 | 55.4 (37) | 17.2 (1.4) | ||
| 1000 | 1.75 | 3.9 | 13 | 32 | 56.2 (39) | 14.2 (1.5) | 3b: dotted | |
| 1000* | 2.0 | 5.6 | 26 | 36 | 53.6 (40) | 11.1 (1.5) | 3a,b: solid | |
| 1000-2 | 2.0 | 5.6 | 22 | 37 | 50.6 (40) | 11.4 (1.5) | 3b: dotted-dashed | |
| 10000 | 2.0 | 4.5 | 21 | 54 | 73.4 (28) | 10.2 (1.1) | ||
| MMS9 | 1 | 1.5 | 1.1 | 2.7 | 17 | 34.6 (12) | 8.30 (0.47) | |
| 1000* | 1.5 | 0.7 | 1.7 | 36 | 64.3 (6.7) | 7.13 (0.26) | 3c: solid | |
| 10000 | 1.5 | 0.45 | 1.1 | 57 | 70.9 (3.5) | 4.92 (0.13) | ||
| FIR4 | 1 | 1.5 | 2.3 | 5.6 | 22 | 50.3 (16) | 17.5 (0.61) | |
| 1000 | 1.5 | 1.8 | 4.4 | 34 | 81.3 (11) | 16.4 (0.43) | 3d: dotted | |
| 5000 | 1.5 | 1.5 | 3.7 | 45 | 99.2 (8.5) | 14.7 (0.32) | 3d: solid | |
| 10000* | 1.5 | 1.3 | 3.2 | 51 | 105.5 (6.9) | 12.9 (0.26) |
Notes: MMS6 model marked with “-D” is with gas and dust temperature decoupling taken into account. The inner and outer radii are 50 and 15,000 AU, respectively except for the MMS6 model marked with “-2” which has an outer radius of 30,000 AU. Models marked with “*” are the best fit models used in Table 3. Models for MMS6 have a constant turbulent broadening of 0.7 km s-1, those for MMS9 and FIR4 1.0 km s-1. aMass-weighted temperature: . bModeled line intensity in 15′′ JCMT beam with optical thickness toward line and source center given in parentheses.
| ISRF | COb | C17Ob | ||
|---|---|---|---|---|
| [K] | K km s-1 | K km s-1 | ||
| MMS6 | 1000 | 53.6 (40) | 11.1 (1.5) | |
| 1000a | 30 K | 40.3 (31) | 4.72 (1.2) | |
| 1000 | 35 K | 26.2 (27) | 2.63 (1.0) | |
| MMS9 | 1000 | 64.3 (6.7) | 7.13 (0.26) | |
| 1000a | 30 K | 54.0 (5.6) | 4.56 (0.21) | |
| 1000 | 35 K | 30.2 (4.3) | 1.88 (0.16) | |
| FIR4 | 1000 | 81.3 (11) | 16.4 (0.43) | |
| 1000 | 30 K | 71.0 (9.3) | 10.6 (0.35) | |
| 1000 | 35 K | 48.1 (7.4) | 5.68 (0.28) | |
| 5000a | 40 K | 66.7 (6.0) | 5.83 (0.23) | |
| 10000 | 45 K | 67.0 (4.8) | 4.92 (0.18) |
For all models, a depleted abundance has been used which is a factor 100 lower than the canonical CO abundance . aBest fit model. bSee footnote b, Table 2.
Fig. 4 compares the dust temperature profile for MMS6 with the JCMT beam size and the results for an optically thin envelope. The figure shows that a single pointing toward the source center will barely resolve the region where the dust temperature starts to increase due to the impact of the ISRF. This radius is therefore also very well-matched to the JCMT beam, which will selectively pick-up the outermost region. Since the envelope is optically thick, the temperature will be higher in the innermost region than predicted by the optically thin approximation, but decrease much more rapidly outside a few hundred AU. The luminosity derived from Eq. 2 above is therefore a lower limit to the required luminosity, further underscoring the need for a strong interstellar radiation field. Finally, it can be seen that the temperature does drop below K in the intermediate region at radii 1000–6000 AU, where CO depletion may occur. However, in the outermost region where the temperature increases again, CO will desorb rapidly from dust grains resulting in “standard” CO abundances.

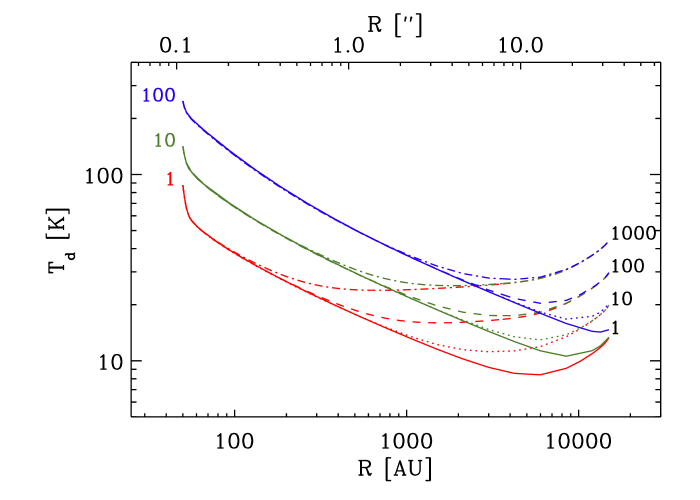
Fig. 5 compares the temperature profiles for varying strengths of the interstellar radiation field and internal luminosities. The figure clearly illustrates the competition between the interstellar radiation field and the internal source luminosity in defining the temperature structure - from the model with a standard interstellar radiation field where only the outer region ( AU) of the envelope is affected by the external heating to the model with where the interstellar radiation field dominates the temperature in to radii of AU. For such a strong ISRF even a core without a central source or heating (or of very low luminosity) remains at high temperatures K all the way through to its center. Currently, the fluxes of these sources shortward of 100 m are not known and model fits have only been made to the long-wavelength tail of the SED (see Johnstone et al., 2003, and references therein for data). It is therefore not possible to separate the internal luminosity of the cores from the contribution from the external radiation field, and the temperature structure at the smallest radii therefore remains poorly constrained. Sensitive infrared observations, e.g., from the Spitzer Space Telescope, are needed to separate the contributions from the internal luminosities and the dust heated by the external radiation field to the total radiation emitted by the cores - such as previously done for giant molecular cloud cores near the galactic center based on ISO-LWS data by Lis et al. (2001).
Another problem is the determination of the outer radius of the cores. These cores are not formed in isolation but located in the Orion ridge, which is also picked up at larger scales of the brightness profiles as seen in Fig. 3. The ridge is found to have a density profile on scales up to 60–300′′ (Johnstone & Bally, 1999). It would therefore seem more realistic to adopt an attenuated profile at the outer edge of 15,000 AU for the ISRF such as also suggested by the modeling by Shirley et al. (2005) and Evans et al. (2005). For a density profile the column density from the outer edge, , to infinity is , i.e., declining as . For MMS6, for example, this implies a maximum extinction between the outer edge at 15,000 AU and the outside radiation field of . If the outer radius of the cores is increased the resulting line intensities are unchanged, however (see Table 2): for the envelopes with density profile power-law slopes, , of 1.5–2.0, the main contribution to the beam averaged column density is located at radii corresponding to the beam size or smaller. The 13CO line becomes optically thick at roughly the same radius (and temperature) in the envelope.
2.3 Lines
Adopting the physical structure of each envelope from the dust models, the line emission is then modeled using the Monte Carlo radiative code of Schöier et al. (2002). This code was benchmarked together with other line radiative transfer codes by van Zadelhoff et al. (2002). The molecular data were taken from the database of Schöier et al. (2005). For each model a turbulent broadening of 0.7-1.0 km s-1 was adopted, reproducing the observed line widths. For the optically thick 13CO transitions inclusion of a more detailed velocity field may change the line opacity. On the other hand, if these objects indeed are young and the inside-out collapse model can be used to describe the velocity field or if the infall can be described by a power-law velocity field, the outermost regions should be close to static and the 13CO 3–2 lines dominated by turbulent broadening (see, e.g., discussion in Jørgensen et al., 2004).
To first order the gas and dust temperatures have been assumed to be perfectly coupled. This is justified by the high densities – generally cm-3 for radii AU – inferred throughout most of the envelope, which leads to strong thermal coupling between the gas and dust via collisions (Doty & Neufeld, 1997). In a strong external ISRF the dust temperature may be less closely coupled to the gas temperature due to photoelectric heating and UV pumping of H2. We tested the effect of the ISRF by calculating the gas temperature as described by Doty & Neufeld (1997). The results are shown in Fig. 6. As can be seen, even in these strong external radiation fields, the densities studied here lead to dominant collisional coupling, and thus only marginal ( a few K) differences between the dust and gas temperatures.

For the first radiative transfer iteration, the abundances are assumed to be constant adopting a canonical CO abundance and 12C:13C and 16O:17O ratios of 70 and 1950, respectively. The exact CO abundance will affect the derivation of the strength of the ISRF somewhat as it will regulate the location in the envelope where the observed 13CO emission becomes optically thick. On the other hand, as the 13CO 3–2 emission does become optically thick the exact abundance structure in the interior of the envelope where depletion may occur does not affect the constraints on the ISRF (see also discussion below).
As shown in Fig. 7, an interstellar radiation field 1000 times stronger than the standard field is needed to account for the peak temperatures of the observed 13CO spectra and fill out the self-absorption dip. It gives relatively Gaussian profiles and line widths of 2-2.5 km s-1 (FWHM) in agreement with observations. It is worth emphasizing here the differences between the observations of the 13CO and C17O lines: the C17O lines are significantly narrower (1.0-1.5 km s-1; FWHM) than the 13CO lines (Johnstone et al., 2003) (see Fig. 7). This simply reflects the fact that the C17O lines are optically thin and is confirmed by the models. Table 2 and 3 summarize the results of the models for each source and Table 4 lists the parameters for the best fit model for each source.

| Source | MMS6 | MMS9 | FIR4 |
|---|---|---|---|
| 1 | 1 | 1 | |
| CO depletion, | 100 | 100 | 100 |
| Desorption temp., | 30 K | 30 K | 45 K |
| p-H2CO | 2.8 | 3.6 | 5.5 |
3 Discussion
In the previous section, the contribution from the external heating of the cores through the interstellar radiation field has been determined using the established framework of dust and gas radiative transfer. However, some simplifying assumptions were made and this section discusses how these models can be refined by taking the importance of chemistry into account.
3.1 CO depletion and desorption temperature
Jørgensen et al. (2002) derived the CO abundances for a sample of 20 pre- and protostellar objects, among them NGC 1333-IRAS 2A. Clear signs of CO freeze-out were observed, with the highest degree of depletion found in the objects with the most massive envelopes. Models of the C17O lines suggest that freeze-out also occurs in the intermediate mass envelopes studied in this paper: adopting a constant canonical CO abundance of as was done for 13CO in the first iteration above, overproduces the observed C17O 3–2 line intensities by about a factor three. It therefore seems that, at least in the region where the C17O lines are sensitive, the abundances must be lower. Since the C17O 3–2 line generally is optically thin throughout the studied envelopes, the line is sensitive to the chemical structure in the interior of the envelope.
The freeze-out of CO – and thus its abundance – depends on temperature and density in the envelope and is therefore not constant but rather varies with radius. A CO desorption temperature higher than 20 K is suggested for low-mass protostellar cores from Monte Carlo modeling of multi-transition data and direct imaging through high-resolution interferometer observations. These observations show that CO evaporates off the dust grains in the innermost envelopes wherever the temperature becomes higher than 35–40 K (Jørgensen et al., 2002; Jørgensen, 2004; Jørgensen et al., 2005a). Detailed chemical models of the low-mass protostar IRAS 16293-2422 by Doty et al. (2004) suggest a desorption temperature of CO of 20–40 K.
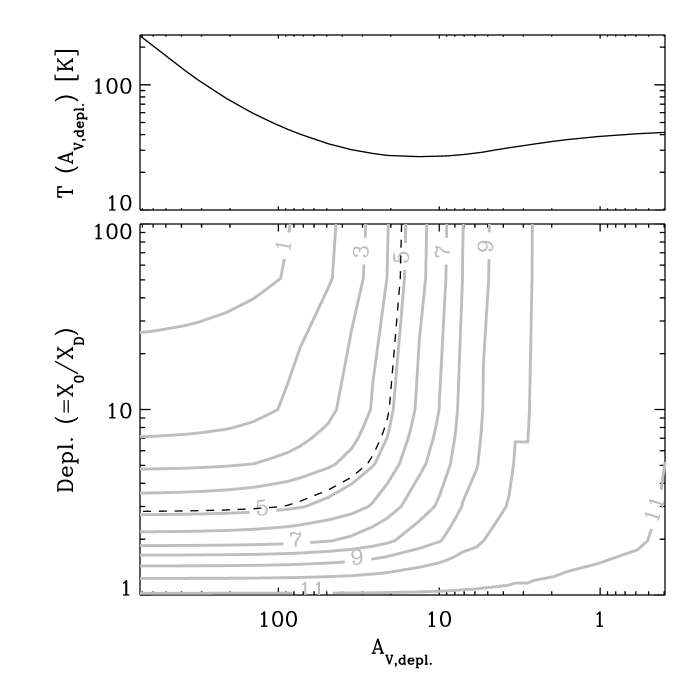
To simulate this effect, we introduce a simple piece-wise constant “drop” abundance structure: we fix the abundances in three regions of the envelope, adopting a standard [CO/H2] abundance of in the inner and outermost region of the envelope where CO desorbs due to the temperature increasing above the CO desorption temperature and a depleted abundance by two orders of magnitude in the region where the temperature drops below . This model then only has one free parameter, , which can be fit by comparison to the 13CO and C17O line intensities. In fact we are not sensitive to the temperature, , at the innermost of these radii as the region inside this contributes only a negligible amount of material to the beam averaged C17O column density. Similar abundance profiles have been suggested for low-mass protostellar envelopes: in these envelopes the densities in the exterior are low so that the timescale for CO freeze-out is longer than the “age” of the core, which results in un-depleted abundances there. This is less of an issue for the Orion cores, however, since for these sources the densities are high enough at the edge that CO depletion does occur in the lifetime in the core, provided the temperature is low enough.
For MMS6 and MMS9 the 13CO and C17O line intensities are well reproduced by these structures where the abundance decreases when (going from the inside) the temperatures decreases below 30 K at 1300 AU (MMS6) and 2300 AU (MMS9) and the abundance increases again when the temperature increases above 30 K (due to the external heating) at radii of 6400 AU (MMS6) and 5300 AU (MMS9) (Table 3). 13CO still becomes optically thick in the outermost envelope and is thus not sensitive to the depletion region, whereas the C17O lines require an abundance decrease by 2 orders of magnitude. For both sources, models with K are found to provide good fits to the data. A very interesting point is illustrated by the fits to FIR4: for this source it is not possible to fit the 13CO and C17O simultaneously with : for K the C17O line is overproduced by a factor 2 by the envelope models whereas the 13CO 3–2 line is well-reproduced. Increasing the CO desorption temperature to 35 K (i.e., increasing the size of the CO depletion zone) lowers the C17O 3–2 line intensity to the observed value, but due to the 13CO 3–2 line being only moderately thick, the temperature probed by this line simultaneously drops and the line intensity correspondingly decreases by 35%. If is increased by a factor 10 the envelope naturally becomes warmer, never dropping below 35 K. However, for such a model both 13CO and C17O line intensities are well-reproduced with a desorption temperature of 45 K (corresponding to radii of 1700 AU and 7700 AU). This suggests a difference in the environment of FIR4 and the two other cores, with a stronger contribution of the ISRF impacting FIR4. Such a difference is in fact reasonable: FIR4 is located at about half the distance from the illuminating Trapezium stars compared to MMS6 (Table 1), so from pure geometric dilution an enhancement of the ISRF by about a factor of 4 is to be expected. An even larger enhancement difference between FIR4 and the two other sources is possible if the radiation field is attenuated by any intervening cloud material.
Rather than the 13CO and C17O lines probing material with different levels of freeze-out, isotope selective photodissociation may result in changed abundances for the two species. As argued by van Dishoeck & Black (1988), the photodissociation is dominated by line absorption (rather than continuum absorption) so that self-shielding and mutual shielding lines of more abundant isotopes and H2 are important for regulating the photodissociation rate of the various isotopes. This can in principle affect the abundance ratios of the isotopic species, e.g., by decreasing the less abundant species such as C17O relative to 13CO compared to the “standard isotope ratios”. Fig. 8 shows the predicted C17O 3–2 line intensities for models with a low C17O abundance from the outside of the envelope in to a radius corresponding to a specific column density (or extinction, ) in the envelope simulating photodissociation of C17O. Inside this radius the C17O abundance is increased to its canonical value assuming the standard isotope ratios. As shown the C17O abundance has to either be lower by one to two orders of magnitude into an of about 15–20 or lower by a factor of about 3 into an . Photodissocation will most likely only affect the outermost ( a few) envelope and only decrease the abundance by a few, it is therefore not sufficient to invoke isotope selective photodissociation to explain the differences between the material probed by 13CO and C17O.
3.2 H2CO emission
An interesting test of the derived models is how they account for the emission from other molecular species. In particular, ratios between a few key lines of H2CO have been suggested as a useful temperature probe (Mangum & Wootten, 1993) and may therefore be particularly sensitive to the impact of the ISRF. Johnstone et al. (2003) assumed constant densities and temperatures for each of the protostars in this paper and found temperatures of 50 K for MMS6, 30 K for MMS9 and 80-90 K for FIR4. For comparison the mass-weighted temperatures,
| (3) |
from the derived envelope models are 36 K for MMS6 and MMS9 and 51 K for FIR4 (see Table 2). The variations of these temperatures between the studied sources therefore do appear to reflect the differences in the external heating, with FIR4 again being significantly warmer than the remaining sources.
The enhanced ISRF and thus more strongly varying temperature profile may, however, produce a discrepancy for sensitive temperature probes such as the ratios of the H2CO lines. To quantify this issue, simple constant abundance models were constrained by comparison to the observed H2CO line intensities. Table 5 lists the best fit models for models with both and the best fit, enhanced ISRF for each source. It is clear that the models with the enhanced ISRF provide significantly better fits to the observed H2CO line intensities. The abundances are found to be remarkably similar at 3–5. For comparison Jørgensen et al. (2005b) found constant abundances of 3–4 for a sample of 18 low-mass protostars.
The Orion cores are also interesting in the context of their H2CO abundance structures: enhanced H2CO abundances have been suggested for low-mass protostars in regions where ices evaporate from the dust grains at temperatures higher than 90–100 K although the evidence still is inconclusive (see discussions in Maret et al. (2004) and Jørgensen et al. (2005b)). Since the cores in Orion have higher luminosities, the innermost hot ( K) region is expected to be larger, and, despite their greater distances, these hot cores would be less diluted in the single-dish beam than the sources studied by Maret et al. (2004) and Jørgensen et al. (2005b) (diameters of for the Orion sources compared to the for the low-mass protostars). We find, however, that the observed H2CO lines are best fit by a constant abundance or a modest abundance jump at best. This conclusion is only based on a few lines, however, some of which may become optically thick and therefore more sensitive to the enhanced temperatures due to the external radiation field. Also, chemistry in the outer envelope, especially freeze-out, may affect the line intensities measured for H2CO (Schöier et al., 2004). Finally we reemphasize that it is not required that these sources have a luminous internal source from either the dust modeling or the gas modeling, which also is important in this aspect. Further studies of high excitation transitions at high angular resolution are needed to fully address these issues.
The large spread in H2CO abundances for the low-mass protostellar cores (Jørgensen et al., 2005b) may be related to CO depletion: Maret et al. (2004) and Jørgensen et al. (2005b) find that the average abundances of CO and H2CO are correlated in the outer cold envelopes of low-mass protostars and high resolution interferometer observations indicate that H2CO follows a similar abundance structure as CO (Schöier et al., 2004). H2CO abundances for the three Orion sources were therefore also calculated with drop abundance structures based on the CO results, i.e., varying the undepleted and depleted H2CO abundances ( and , respectively) and adopting found for the fits to the CO lines. Fig. 9 shows the confidence plots. Interestingly a drop in abundance is not indicated by the observed line intensities. Constant abundance or small increases in abundance within the CO depletion region are allowed by the 2 confidence levels for the observed sources.
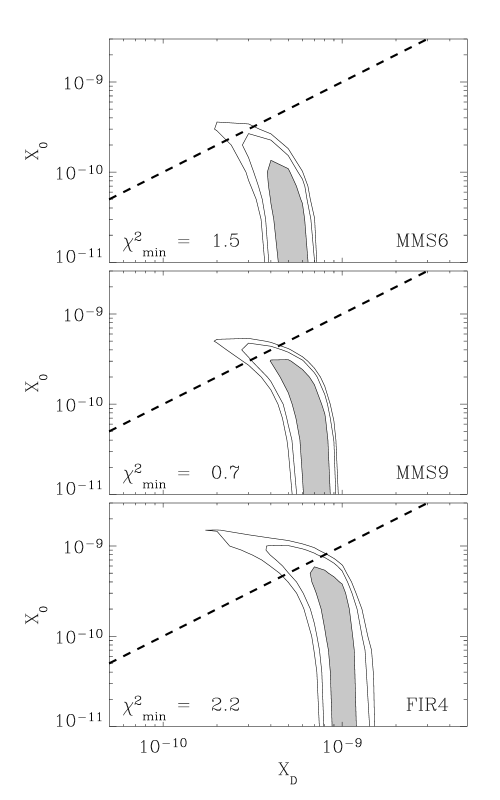
| Source | ISRF | Abundance (para-H2CO) | |
|---|---|---|---|
| MMS6 | 1 | 2.3 | 5.2 |
| 2.8 | 2.9 | ||
| MMS9 | 1 | 2.2 | 5.1 |
| 3.6 | 1.8 | ||
| FIR4 | 1 | 2.2 | 6.7 |
| 5.5 | 3.0 | ||
| NGC 1333-IRAS 2A | 0 | 3.9 | 1.3b |
a2 upper limit. bFor four fitted lines, including the H2CO transition at 363.946 GHz (Jørgensen et al., 2005b).
4 Evolutionary implications
The points discussed above have interesting implications related to the evolution of the cores. The first concerns their history: as shown in Fig. 5 even for a pre-stellar core, i.e., a core with no internal source of heating, the temperature never decreases below 25 K in such an enhanced external radiation field considered in this paper. Under these conditions a given CO molecule would desorb again almost instantaneously after freeze-out so that only little depletion should be expected. It is, however, clear that CO is frozen-out in parts of the observed envelopes, suggesting that these regions must have been at lower temperatures earlier in the evolution of the cores.
An explanation may be that the strength of the UV field in the Orion region has changed significantly during the evolution of the studied cores. Plenty of circumstantial evidence suggests that the Trapezium cluster, which produces the majority of the local UV photons, is relatively young (O’Dell, 2001). For example, Palla & Stahler (2001) determine the age for Ori B to be less than 100,000 years. The most massive star in the Trapezium, Ori C, shows considerable variability in its X-ray emission (Gagne et al., 1997) a likely indicator of extreme youth. Most, if not all of the low-mass stars in the Trapezium cluster are still proplyds, despite losing mass from their disks due to UV induced photoevaporation at rates of to yr-1 (Bally et al., 1998; Johnstone et al., 1998). Assuming that each disk has a minimum Solar nebula mass of , this implies a lifetime of yr since the initiation of evaporation. Finally, the H+O [III] arcs observed around young low-mass stars near the high mass Trapezium stars trace out a wind driven bubble the size of which is very small, again suggesting extreme youth (O’Dell et al., 1997; Bally et al., 1998).
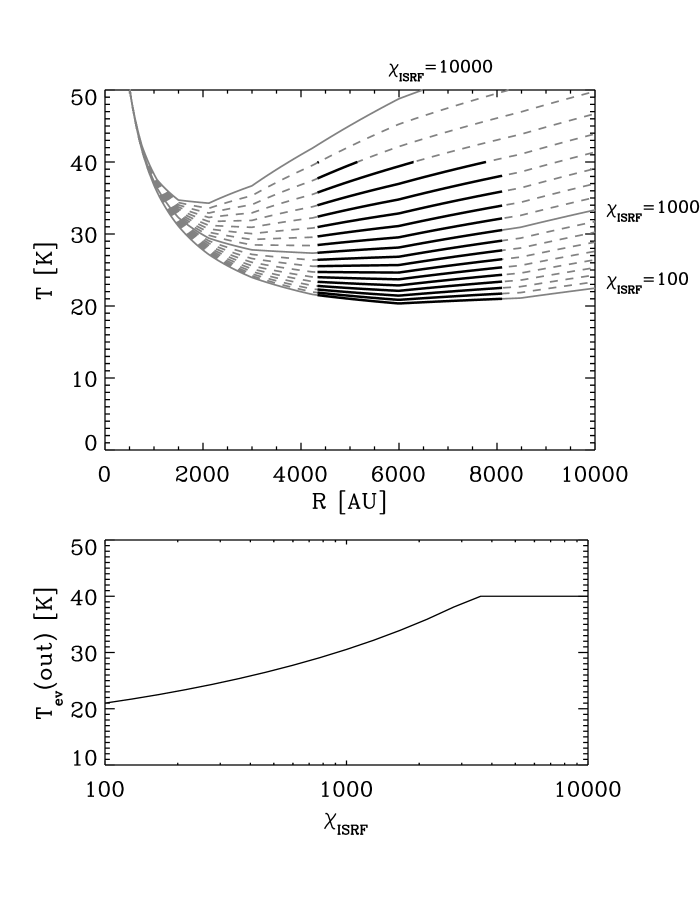
If the CO molecule is frozen-out at lower temperatures it may stay bound to the dust grains at the higher temperatures observed at present day, such as seen in low-mass protostellar envelopes where CO is expected to freeze-out in the cold ( K) stages and evaporate as the protostar starts heating the envelope, increasing the temperature above K. One explanation for this according to laboratory experiments is that CO migrates into a porous ice when heated (Collings et al., 2003). It is therefore also not clear whether the determined values for in this paper correspond to the radii where the ice was formed at a lower temperature in an earlier stage or rather the radius where the temperature is high enough so that it evaporates at present. In fact the difference between FIR4 on one hand and MMS6 and MMS9 on the other may reflect such effects: Fig. 10 shows the evolution of the temperature distribution in a 100 envelope with a similar density profile as in Fig. 5 but for varying ISRF strengths. At the earliest stages CO freezes out between radii where the temperature is lower than 21 K, but as the ISRF strength increases the same radii will correspond to increasing temperatures. As the temperature then increases above , CO desorbs and the radius for the outer edge of the depletion zone moves inwards.
If this interpretation is true – the cores had CO freeze-out in the outer regions when formed, and then had CO evaporate when the OB stars “turned on” – this will also have important chemical implications in relation to the grain chemistry and for gas-phase species regulated by the amount of CO. The H2CO and CO correlation can easily can be understood since the amount of CO and related C+ and O is the main bottleneck for gas-phase H2CO production (Schöier et al., 2004). In a gas-phase chemical model using the approach of Doty et al. (2004), and adopting the physical conditions (incl. temperature and density) in MMS6, the H2CO abundances follows the CO abundance structure after years.
Although the abundance structures are similar in the Orion cores and in the low-mass protostellar envelopes, the grain chemistry might be significantly different. In both cases high abundances of, e.g., CO are expected in the outer envelopes, but whereas this is caused by low densities (and thus long timescales for freeze-out) in the low-mass protostellar envelopes, it is a result of direct desorption (high temperatures) in the Orion protostars. This has the consequence that the timescale where CO is available for surface chemical reactions e.g., hydrogenation forming CH3OH and the rates of these reactions are different in the Orion cores due to their dependence on temperature.
It will naturally be very interesting to test the importance of any photochemistry. In particular an increased CO abundance provides high amount of atomic carbon, which will lead to higher abundances of for example CN and CS in the outer envelopes relative to related species such as HCN and SO.
5 Conclusions
We have presented an analysis of submillimeter continuum and line observations toward three intermediate mass protostellar cores in the Orion molecular cloud using detailed radiative transfer models. The main conclusions of this study are:
-
•
From simple luminosity and temperature considerations these sources must be subject to a strong external heating to reproduce observed 13CO 3–2 line temperatures and profiles.
-
•
Detailed radiative transfer modeling confirms this, constraining the ISRF enhancement to times the standard ISRF from the studied sources. Different strengths of the ISRF between MMS6 and MMS9 in one case and FIR4 in the other can be explained in part due to the latter being closer to the Trapezium stars supplying the strong UV field.
-
•
The C17O 3–2 lines are optically thin and thus not sensitive to the same temperature enhancement. Differences between the 13CO and C17O line widths reflect this difference between the optically thick and thin lines, which is well reproduced by the models. To reproduce the C17O line intensities, significant CO depletion must have occurred in the part of the envelope where the temperature is lower than 30-45 K. A difference in the CO desorption temperatures derived for the sources, however, suggest an evolutionary difference with the OB stars (and thus UV field) evolving over similar timescales as the protostellar cores themselves.
-
•
Multi-transition H2CO observations indicate high temperatures in the cores and their line ratios can only be reproduced in models with a strong ISRF. Constant abundances of 3–5 provide a good fit to the line intensities.
This work illustrates the necessity of establishing the environmental impact for the evolution of pre- and protostellar cores - for example in regions such as Orion where the impact of the radiation stars have a large impact on newly formed low- and intermediate mass protostars. As the above discussions also illustrate, detailed radiative transfer models can be used to address some of these issues, in particular if the chemistry is taken into account.
Additional mid-infrared observations of the cores can further constrain the relative contributions of the internal and external radiation field to the observed spectral energy distributions as it has previously been done for cores near the galactic center (Lis et al., 2001). Further continuum observations with (sub)millimeter interferometers such as the SMA, CARMA and eventually ALMA could further confirm the temperature structure of the envelopes at smaller scales and in particular whether desorption of molecules are seen toward their centers due to the heating by the central protostar. Likewise in an extreme interstellar radiation field such as that of the Orion further studies of the chemistry in the outer envelopes and intervening material in the ridge are interesting to fully understand the impact of the ionizing sources. Understanding these processes are important as the thermal balance and pressure of the cores controls the conditions and outcome of the collapse and thus establishing the properties of the newly formed stars.
Acknowledgements.
We thank the referee, Neal Evans, for insightful comments which greatly improved the paper. The research of JKJ was funded through a Ph.D. stipend from the Netherlands Research School for Astronomy (NOVA) and NASA Origins Grant NAG5-13050. This research was also supported by a grant from the Natural Science and Engineering Research Council of Canada to DJ and a grant for from The Research Corporation (SDD). Astrochemistry research in Leiden is supported by an NWO/Spinoza grant. DJ wishes to thank the Sterrewacht Leiden for its kind hospitality during the past four summers, during which much of this research was conducted.References
- Bally et al. (1987) Bally, J., Stark, A. A., Wilson, R. W., & Langer, W. D. 1987, ApJ, 312, L45
- Bally et al. (1998) Bally, J., Sutherland, R. S., Devine, D., & Johnstone, D. 1998, AJ, 116, 293
- Black (1994) Black, J. H. 1994, in ASP Conf. Ser. 58: The First Symposium on the Infrared Cirrus and Diffuse Interstellar Clouds (ed. R.M. Cutri and W.B. Latter)
- Burton et al. (1990) Burton, M. G., Hollenbach, D. J., & Tielens, A. G. G. M. 1990, ApJ, 365, 620
- Ceccarelli et al. (1996) Ceccarelli, C., Hollenbach, D. J., & Tielens, A. G. G. M. 1996, ApJ, 471, 400
- Chandler et al. (1998) Chandler, C. J., Barsony, M., & Moore, T. J. T. 1998, MNRAS, 299, 789
- Chandler & Richer (2000) Chandler, C. J. & Richer, J. S. 2000, ApJ, 530, 851
- Collings et al. (2003) Collings, M. P., Dever, J. W., Fraser, H. J., McCoustra, M. R. S., & Williams, D. A. 2003, ApJ, 583, 1058
- Doty & Leung (1994) Doty, S. D. & Leung, C. M. 1994, ApJ, 424, 729
- Doty & Neufeld (1997) Doty, S. D. & Neufeld, D. A. 1997, ApJ, 489, 122
- Doty et al. (2004) Doty, S. D., Schöier, F. L., & van Dishoeck, E. F. 2004, A&A, 418, 1021
- Draine (1978) Draine, B. T. 1978, ApJS, 36, 595
- Evans et al. (2005) Evans, N. J., Lee, J.-E., Rawlings, J. M. C., & Choi, M. 2005, ApJ, 626, 919
- Evans et al. (2001) Evans, N. J., Rawlings, J. M. C., Shirley, Y. L., & Mundy, L. G. 2001, ApJ, 557, 193
- Gagne et al. (1997) Gagne, M., Caillault, J., Stauffer, J. R., & Linsky, J. L. 1997, ApJ, 478, L87
- Ivezić et al. (1999) Ivezić, Ž., Nenkova, M., & Elitzur, M. 1999, User Manual for DUSTY, University of Kentucky Internal Report
- Johnstone & Bally (1999) Johnstone, D. & Bally, J. 1999, ApJ, 510, L49
- Johnstone et al. (2003) Johnstone, D., Boonman, A. M. S., & van Dishoeck, E. F. 2003, A&A, 412, 157
- Johnstone et al. (1998) Johnstone, D., Hollenbach, D., & Bally, J. 1998, ApJ, 499, 758
- Jørgensen (2004) Jørgensen, J. K. 2004, A&A, 424, 589
- Jørgensen et al. (2002) Jørgensen, J. K., Schöier, F. L., & van Dishoeck, E. F. 2002, A&A, 389, 908
- Jørgensen et al. (2004) Jørgensen, J. K., Schöier, F. L., & van Dishoeck, E. F. 2004, A&A, 416, 603
- Jørgensen et al. (2005a) Jørgensen, J. K., Schöier, F. L., & van Dishoeck, E. F. 2005a, A&A, 435, 177
- Jørgensen et al. (2005b) Jørgensen, J. K., Schöier, F. L., & van Dishoeck, E. F. 2005b, A&A, 437, 501
- Li et al. (2003) Li, D., Goldsmith, P. F., & Menten, K. 2003, ApJ, 587, 262
- Lis et al. (2001) Lis, D. C., Serabyn, E., Zylka, R., & Li, Y. 2001, ApJ, 550, 761
- Mangum & Wootten (1993) Mangum, J. G. & Wootten, A. 1993, ApJS, 89, 123
- Maret et al. (2004) Maret, S., Ceccarelli, C., Caux, E., et al. 2004, A&A, 416, 577
- Mookerjea et al. (2003) Mookerjea, B., Ghosh, S. K., Kaneda, H., et al. 2003, A&A, 404, 569
- O’Dell (2001) O’Dell, C. R. 2001, ARA&A, 39, 99
- O’Dell et al. (1997) O’Dell, C. R., Hartigan, P., Bally, J., & Morse, J. A. 1997, AJ, 114, 2016
- Ossenkopf & Henning (1994) Ossenkopf, V. & Henning, T. 1994, A&A, 291, 943
- Palla & Stahler (2001) Palla, F. & Stahler, S. W. 2001, ApJ, 553, 299
- Schöier et al. (2002) Schöier, F. L., Jørgensen, J. K., van Dishoeck, E. F., & Blake, G. A. 2002, A&A, 390, 1001
- Schöier et al. (2004) Schöier, F. L., Jørgensen, J. K., van Dishoeck, E. F., & Blake, G. A. 2004, A&A, 418, 185
- Schöier et al. (2005) Schöier, F. L., van der Tak, F. F. S., van Dishoeck, E. F., & Black, J. H. 2005, A&A, 432, 369
- Scoville & Kwan (1976) Scoville, N. Z. & Kwan, J. 1976, ApJ, 206, 718
- Shirley et al. (2005) Shirley, Y. L., Nordhaus, M. K., Grcevich, J. M., et al. 2005, ApJ, 632, 982
- Stacey et al. (1993) Stacey, G. J., Jaffe, D. T., Geis, N., et al. 1993, ApJ, 404, 219
- Tielens & Hollenbach (1985a) Tielens, A. G. G. M. & Hollenbach, D. 1985a, ApJ, 291, 747
- Tielens & Hollenbach (1985b) Tielens, A. G. G. M. & Hollenbach, D. 1985b, ApJ, 291, 722
- Ungerechts et al. (1997) Ungerechts, H., Bergin, E. A., Goldsmith, P. F., et al. 1997, ApJ, 482, 245
- van Dishoeck & Black (1988) van Dishoeck, E. F. & Black, J. H. 1988, ApJ, 334, 771
- van Zadelhoff et al. (2002) van Zadelhoff, G.-J., Dullemond, C. P., van der Tak, F. F. S., et al. 2002, A&A, 395, 373
- Wilson et al. (1999) Wilson, T. L., Mauersberger, R., Gensheimer, P. D., Muders, D., & Bieging, J. H. 1999, ApJ, 525, 343