Submillimeter emission from the hot molecular jet HH 211
Abstract
We observed the HH 211 jet in the submillimeter continuum and the CO(3–2) and SiO(8–7) transitions with the Submillimeter Array. The continuum source detected at the center of the outflow shows an elongated morphology, perpendicular to the direction of the outflow axis. The high-velocity emission of both molecules shows a knotty and highly collimated structure. The SiO(8–7) emission at the base of the outflow, close to the driving source, spans a wide range of velocities, from up to 40 km s-1. This suggests that a wide-angle wind may be the driving mechanism of the HH 211 outflow. For distances ( AU) from the driving source, emission from both transitions follows a Hubble-law behavior, with SiO(8–7) reaching higher velocities than CO(3–2), and being located upstream of the CO(3–2) knots. This indicates that the SiO(8–7) emission is likely tracing entrained gas very close to the primary jet, while the CO(3–2) is tracing less dense entrained gas. From the SiO(5–4) data of Hirano et al. we find that the SiO(8–7)/SiO(5–4) brightness temperature ratio along the jet decreases for knots far from the driving source. This is consistent with the density decreasing along the jet, from (3–10) cm-3 at 500 AU to (0.8–4) cm-3 at 5000 AU from the driving source.
Subject headings:
ISM: individual: HH 211 — ISM: jets — ISM: outflows — stars: formation1. Introduction
HH 211 is a warm and energetic molecular outflow located in the IC 348 complex at 315 pc, which was discovered by McCaughrean et al. (1994) from observations of H2 (at 2.12 m). The inclination from the plane of the sky is supposed to be small, around 10 (Hirano et al. 2005). The outflow in the CO(2–1) transition shows a well collimated structure at high velocities, and traces the outflow cavity walls at low velocities (Gueth & Guilloteau 1999, hereafter GG99). On the other hand, the SiO emission has been detected with single-dish telescopes up to the 11–10 transition, indicative of gas densities cm-3 along the jet (Nisini et al. 2002; Chandler & Richer 2001). Recently, Hirano et al. (2005) observed HH 211 in the SiO(5–4) transition and found a highly collimated structure consisting of a chain of knots. The innermost knots likely trace the primary jet launched at the close vicinity of the protostar. In order to follow up the study of the excitation conditions along the outflow, we have carried out observations of the high-J transitions CO(3–2) at 345.796 GHz and SiO(8–7) at 347.331 with high-angular resolution.
2. Observations
Observations of HH 211 with the Submillimeter Array111The Submillimeter Array is a joint project between the Smithsonian Astrophysical Observatory and the Academia Sinica Institute of Astronomy and Astrophysics, and is funded by the Smithsonian Institution and the Academia Sinica. (SMA; Ho et al. 2004) in the 345 GHz band were carried out on 2004 October 4 and October 18, with seven antennas for each day in the compact configuration. The phase reference center of the observations was , , and the projected baselines ranged from 14.7 to 127 m. The half-power width of the SMA primary beam at 345 GHz is . During each track, we observed 3 pointing fields, separated from the central pointing by (to southeast) and (to northwest) along the axis of the jet. The correlator was configurated in the standard mode, providing a uniform spectral resolution across the full 2 GHz IF band in each sideband of 0.8125 MHz (or 0.7 km s-1). The frequency range covered by the lower and upper sidebands was 335.58–337.55 GHz, and 345.59–347.56 GHz, respectively. The passband of each dataset was calibrated in MIR-IDL by using both sidebands of Saturn for the Oct 4 dataset, and the lower sideband of Venus for the Oct 18 dataset (lower sideband of Venus was used to calibrate the lower sideband and the upper sideband). The maximum error due to passband calibration across the full 2 GHz sideband was about %. Gain calibration of the visibility phases and amplitudes and flux calibration was performed in MIRIAD using 3C 84 as the gain and flux calibrator, for which we set the flux to be 1.7 Jy (value independently measured with the SMA at 345 GHz within 15 days from our observations). The typical rms of the gain phases was , and the overall flux uncertainty is estimated to be about 15%.
Imaging of data cubes was made in MIRIAD by combining the data from the 3 pointings in the visibility plane, and cleaning in a box covering the full extent of the jet. The final maps include both Oct 4 and Oct 18 datasets, and have a synthesized beam of (PA), with an rms noise level per channel (of 2 km s-1 wide) of 0.30 and 0.25 for the CO(3–2) and SiO(8–7), respectively. Although weather conditions were not very good on Oct 4 (, compared with for Oct 18), the combination of Oct 4 and Oct 18 datasets improved the S/N for the line emission. Continuum emission at 345 GHz was obtained by averaging the spectral channels free of line emission. The continuum image shown in this letter is the result of combining the upper and lower sideband data of the Oct 18 dataset only, with natural weighting of the uv data and without spatial restrictions in the image cleaning process. The synthesized beam of the continuum map was (PA), and the rms noise level was 7 m.
3. Results
3.1. CO(3–2) and SiO(8–7) emission
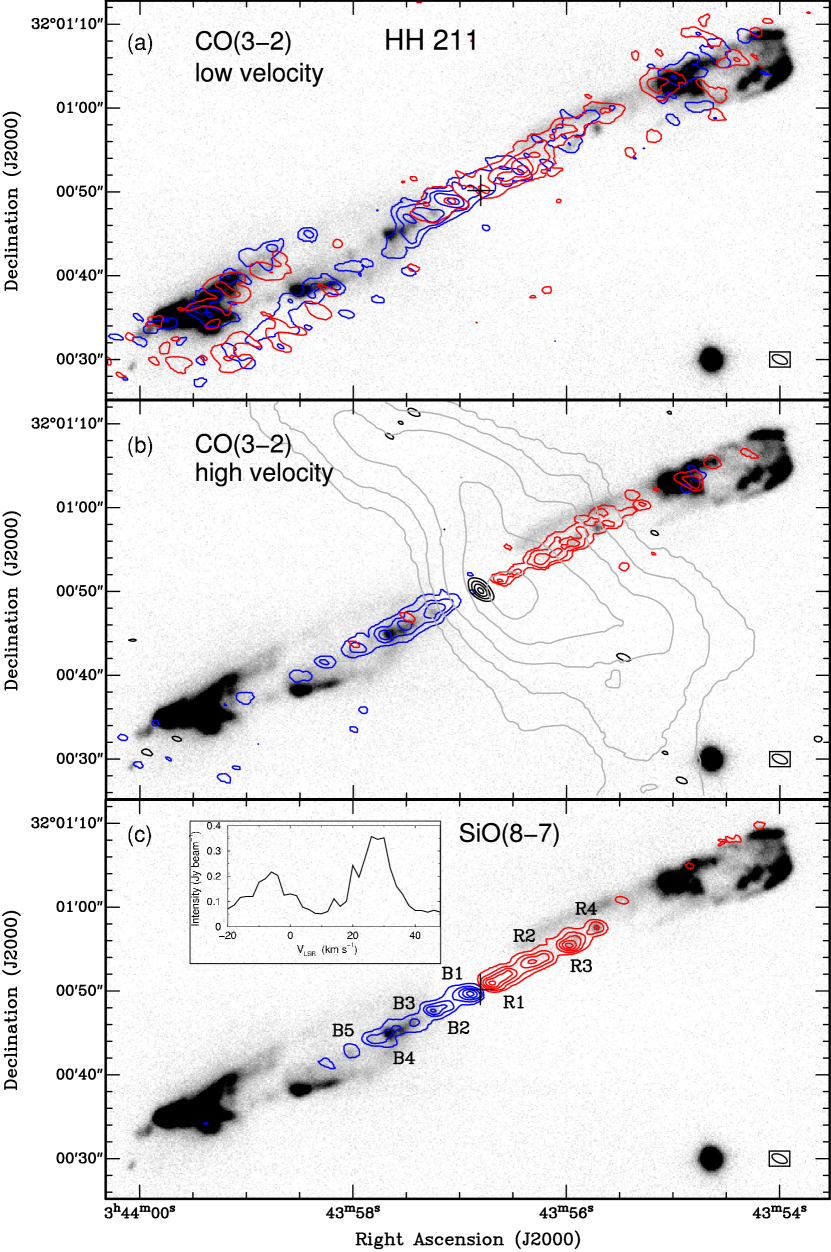
The systemic velocity of HH 211 is 9.2 km s-1 (velocities in this paper are LSR). CO(3–2) emission is detected up to km s-1 for the blue side of the outflow, and up to 40 km s-1 for the red side. In Fig. 1a we show an overlay of the low-velocity CO(3–2) emission on the H2 emission at 2.12 m from Hirano et al. (2005). We find CO(3–2) low-velocity emission associated with the brightest infrared knots, as well as weak emission tracing a shell-like structure, similar to the CO(2–1) emission in the same velocity range (GG99).
The CO(3–2) high-velocity emission ("high-velocity" refers to velocitites lower than 0 km s-1 and higher than 20 km s-1) traces a very well collimated and knotty jet-like structure, and is very close to the axis of the cavity traced by the low-velocity CO and the H2 emission (see Fig. 1b).
The SiO(8–7) emission is very weak for velocities close to the systemic velocity, but is detectable up to and 42 km s-1 (see spectrum in Fig. 1c). The high-velocity SiO(8-7) emission (Fig. 1c) is also very well collimated and clumpy. However, the SiO is found much closer to the protostar than the CO for the high-velocity emission. We have adopted the same nomenclature for the knots as Hirano et al. (2005). Toward the strongest H2 features, there is no significant high-velocity CO(3–2) or SiO(8–7) emission (for a discussion on H2 excitation and a comparison with SiO emission in HH 211, see Chandler & Richer 2001). Regarding the medium in which the HH 211 jet is propagating, the emission from NH3 and H13CO+ reveals an elongated condensation of , located on the red side of the jet, as shown in Fig. 1b (Bachiller et al. 1987; GG99; Wiseman et al. 2001).
We estimated the physical parameters of the outflow from the CO(3–2) emission (Table 1), following Yang et al. (1990) and assuming optically thin emission in the wing, and an excitation temperature of K (derived from the line intensity). The values shown in the Table are not corrected for the inclination effect. The derived age and mass are consistent with those obtained by GG99 from CO(1–0) and CO(2–1) with the PdBI.
| Age | Mass | |||||||
|---|---|---|---|---|---|---|---|---|
| (yr) | (cm-2) | () | ( yr-1) | ( km s-1) | ( km s-1 yr-1) | (erg) | () | () |
| 1400 | 1.4 | 0.0024 | 1.7 | 0.040 | 2.8 | 6.9 | 0.027 | 3.6aaFrom Froebrich (2005). |
3.2. Continuum emission
In Fig. 1b, we show the continuum emission overlaid on the high-velocity CO(3–2) emission. We detected the source at the center of the outflow with . The position for the source derived from a Gaussian fit is , . The deconvolved size of the source is , corresponding to AU, and the deconvolved position angle (PA) is . The PA of the large-scale jet in the integrated SiO emission has been determined to be . Thus, we find that the submillimeter continuum source, which is likely tracing the disk, is exactly perpendicular to the large-scale collimated jet emanating from it, to within the measurement error.
The peak intensity of the source is , and the flux density is Jy. Assuming that the dust emission is optically thin and well described by a modified black body law, we can estimate the mass of the disk, for a given dust emissivity index and dust temperature. We assumed the opacity law of Beckwith et al. (1990), and an emissivity index . Then, for dust temperatures of 20–40 K, we derive a mass for the disk ranging from 0.02 to 0.06 , only % of the mass of the large-scale NH3 condensation (§ 3.1). The derived mass is 2–3 times lower than the values obtained at 230 GHz by GG99 and Hirano et al. (2005), indicating that our measurements at 345 GHz could be tracing only the warmer part of the dusty disk.
4. Discussion and Conclusions
4.1. SiO(8–7) versus SiO(5–4)
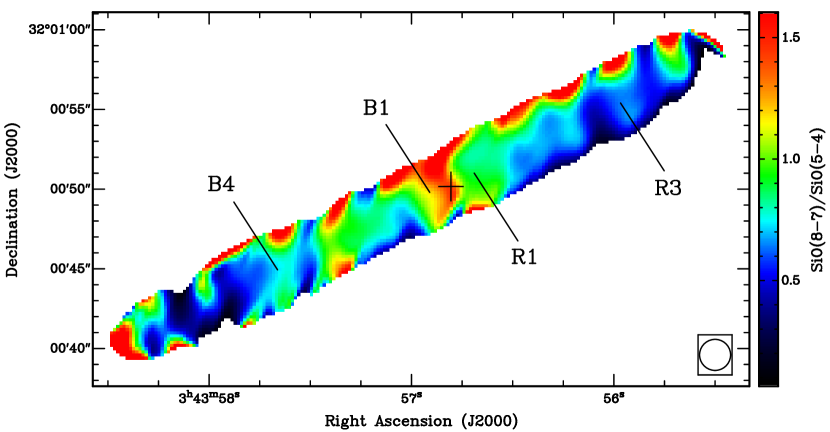
Observations toward HH 211 in the SiO(5–4) transition at 217 GHz were carried out by Hirano et al. (2005), with similar angular resolution. In order to compare the maps from both transitions, we convolved the moment-zero maps (integrated over all velocities) with a Gaussian to achieve a final beam of , the largest major axis of the SiO(8–7) and SiO(5–4) beams.
We computed the SiO(8–7)/SiO(5–4) ratio map after correcting for the offset found in the position of the continuum source of both images ( in declination), and the result is shown in Fig. 2. The uncertainty in the ratio is %. While the value for the ratio at the position of the innermost knots, B1 and R1, is , far away from the protostar the ratio decreases down to . Comparing the ratio with the results of LVG modeling of Nisini et al. (2002), we set ranges for the density. Note that the SiO(8–7)/SiO(5–4) ratio is not very sensitive to temperature variations for K, since the SiO(8–7) upper level energy is K. At the position of B1 and R1 ( AU) we estimate that, for temperatures in the range 100–1000 K, the density must be (3–10) cm-3. On the other hand, (or 5000 AU) away from the center of the jet the ratio is 0.5, and this yields a density of (0.8–4) cm-3. This is consistent with the density derived by Hirano et al. (2005) from the SiO(5–4) jet and by Nisini et al. (2002) from the single-dish data. Therefore, the density of the innermost knots seems to be about one order of magnitude higher than that of the knots further out along the jet.
4.2. SiO(8–7) versus CO(3–2)
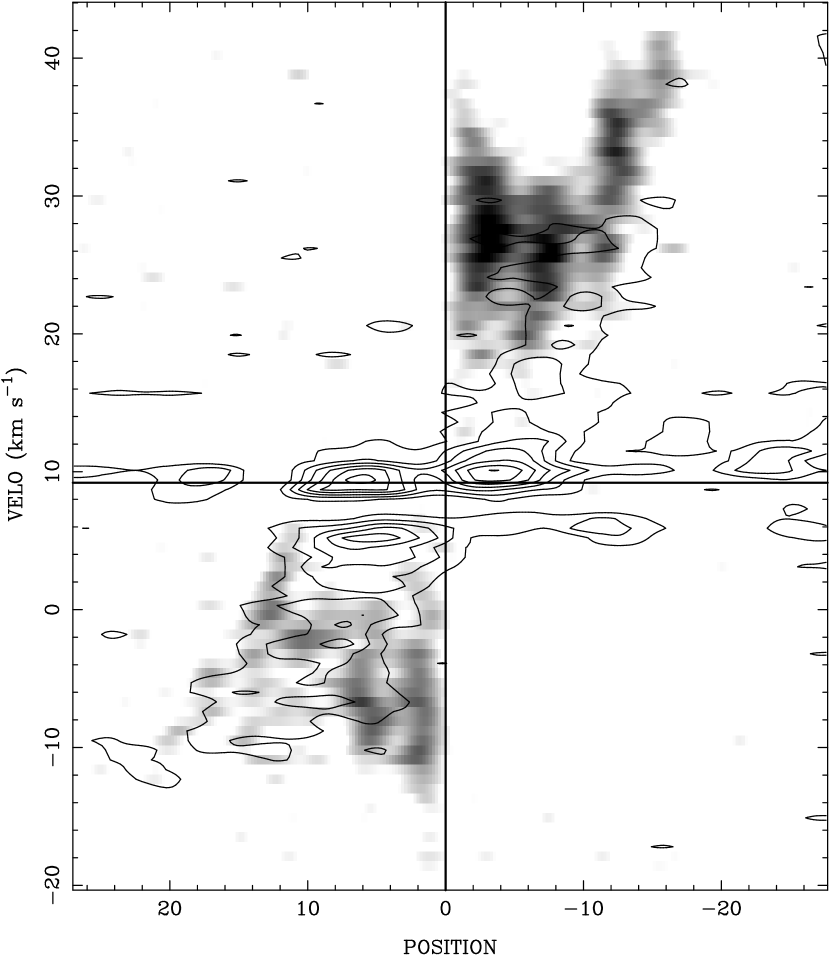
Position-velocity (p-v) plots were computed for both CO(3–2) and SiO(8–7) emission from 0.7 km s-1 wide channel maps along the axis of the jet, PA. Since the CO emission is somewhat extended in the direction perpendicular to the jet axis, we have smoothed the image with a gaussian twice the beam of the observations, and with a position angle perpendicular to the axis of the jet, in order to enhance the S/N of the CO emission in the p-v plot. An overlay of SiO on the CO p-v plot is presented in Fig. 3.
First of all, there is a distinct gap in CO emission from 7 to 8 km s-1, affecting all positions along the jet. CO(3–2) and (1–0) observations of low angular resolution (; Hirano et al., in preparation) show an absorption feature at the same velocity. The gap is probably due to an intervening cold cloud along the line of sight.
In the CO(3–2) p-v plot, one can see a low-velocity component, extending along all positions and tracing the shell structure seen in the low-velocity map from Fig. 1a, and a second component tracing the high-velocity material, with velocities increasing with distance from the protostar (Hubble-law), up to velocities of km s-1 (blue side) and km s-1 (red side). Note that for CO no high-velocity emission comes from the positions close to the protostar. As for SiO(8–7), the p-v plot shows several features. Contrary to the CO case, only very weak SiO emission is coming from the low-velocity material. The SiO emission resembles the CO emission at distances greater than , with velocities increasing with distance. However, the most remarkable characteristic of the SiO p-v plot is that the emission close to the protostar has the widest range of velocities, including the highest, up to km s-1 in the blue side and up to 40 km s-1 in the red side. This is a striking feature of the SiO jet, that is, that very high velocities are found very close ( AU) to the protostar.
A possible explanation for the wide range of velocities found for SiO at the spatial scales of the disk would be that SiO close to the protostar is tracing a protostellar wind, with a large opening angle, and thus yielding a maximum spread of velocities. This interpretation favors a wide-angle wind as the mechanism for driving the outflow (e. g., Shu et al. 1991), since a pure jet model, in which velocity vectors point only in the polar direction, cannot produce this feature (e. g., Masson & Chernin 1993; Smith et al. 1997). However, the overall structure of the SiO emission is highly collimated, and is very reminiscent of a pure jet (see Fig. 1b,c). In the wind-driven model, such a collimated structure would be the densest portion of a wide-angle wind. In this model, at distances AU (the position of the innermost SiO knots), the density decreases steeply with distance perpendicular to the axis of the jet, while the velocity vectors still span a wide angle around the jet axis (see e. g., Shang et al. 1998). Note that the SiO emission close to the driving source is not due to mixing with entrained material. The highly collimated morphology, together with the observed high velocity (up to 40 km s-1), and the derived high density ( cm-3) and high temperature ( K, Hirano et al. 2005) for the SiO gas very close to the center are strongly suggestive of material from the primary jet, and not of ambient material being entrained.
Finally, we also see from the p-v plot that for distances larger than (1500 AU), the velocity of both CO and SiO emission increases with distance. This is consistent with high-velocity CO and SiO tracing entrained material, dragged by the primary jet. However, the velocities reached by SiO are km s-1 higher than those of CO, especially on the red side. This feature is also seen when superposing the SiO(5–4) p-v plot on the CO(2–1) (Hirano et al. 2005). Presumably, SiO at distances larger than from the protostar comes from entrained material with higher density than CO. This is consistent with the critical density of SiO(8–7) being higher than that of CO(3–2). Such higher-density material would be likely closer to the primary jet, resulting in entrained SiO showing higher velocities than entrained CO.
In order to compare the peak positions of the high-velocity SiO emission with those of the CO emission, we cross correlated the map of high-velocity SiO with that of high-velocity CO. The cross correlation function on the blue side of the jet has a single maximum at , meaning that the SiO knots are on average closer to the protostar than the CO knots on the blue side. For the red side, the cross correlation function had two maxima, one at , and the other one at , with the SiO knots closer to the protostar. Thus, for both sides of the jet, the SiO knots are found closer to the driving source than the CO knots. This suggests that chemical differentiation can be important in the jet.
In particular, we measured (in the high-velocity maps) the distance to the center for the SiO knots B1 and R1, and found that the peak is at (470 AU) from the center. Since B1 and R1 are only slightly resolved by the beam (even if we include the low-velocities), no significant emission of SiO is closer to the protostar than the peak of the innermost knots.
In summary, from the comparison of SiO(8–7) with SiO(5–4) and CO(3–2), it seems that the SiO(8–7) emission close to the protostar has contributions from the primary jet, which could be driven by a wide-angle wind. At projected distances AU from the protostar, the SiO(8–7) shows velocities increasing with distance, likely tracing entrained gas. For the same distances, the CO(3–2) also shows velocities increasing with distance, but reaching systematically lower velocities than the SiO(8–7). We interpret this feature as SiO(8–7) tracing entrained gas which is denser, and therefore closer to the primary jet, than the entrained CO(3–2) gas.
References
- (1)
- (2) Bachiller, R., Guilloteau, S., & Kahane, C. 1987, A&A, 173, 324
- (3)
- (4) Beckwith, S. V., Sargent, A. I., Chini, R. S., & Güsten, R. 1990, AJ, 99, 924
- (5)
- (6) Chandler, C. J., & Richer, J. S. 2001, ApJ, 555, 139
- (7)
- (8) Froebrich, D. 2005, ApJSS, 156, 169
- (9)
- (10) Gueth, F., & S., Guilloteau 1999, A&A, 343, 571 (GG99)
- (11)
- (12) Hirano, N., Liu, S.-Y., Shang, H., et al. 2005, submitted to ApJL
- (13)
- (14) Ho, P.T.P., Moran, J.M., & Lo, K.Y. 2004, ApJ, 616, L1
- (15)
- (16) Masson, C. R., & Chernin, L. M. 1993, ApJ, 414, 230
- (17)
- (18) McCaughrean, M. J., Rayner, J. T., & Zinnecker, H. 1994, ApJ, 436, L189
- (19)
- (20) Nisini, B., Codella, C., Giannini, T., & Richer, J. S. 2002, A&A, 395, 25
- (21)
- (22) Shang, H., Shu, F. H., & Glassgold, A. E. 1998, ApJ, 493, L91
- (23)
- (24) Shu, F. H., Ruden, S. P., Lada, C. J., & Lizano, S. 1991, ApJ, 370, 31
- (25)
- (26) Smith, M. D., Suttner, G., & Yorke, H. W. 1997, A&A, 323, 223
- (27)
- (28) Wiseman, J. J. 2001, in ASP Conf. Ser. 235, Science with the Atacama Large Millimeter Array, ed. A. Wooten (San Francisco: ASP), 179
- (29)
- (30) Yang, J., Fukui, Y., Umemoto, T., & Ogawa, H. 1990, ApJ, 362, 538
- (31)