A multisite photometric campaign on the Pre-Main-Sequence Scuti pulsator IP Per
We present the results of a photometric multisite campaign on the Scuti Pre-Main-Sequence star IP Per. Nine telescopes have been involved in the observations, with a total of about 190 hours of observations over 38 nights. Present data confirms the multiperiodic nature of this star and leads to the identification of at least nine pulsational frequencies. Comparison with the predictions of linear non-adiabatic radial pulsation models allowed us to identify only five of the nine observed frequencies, and to constrain the position of IP Per in the HR diagram. The latter is in good agreement with the empirical determination of the stellar parameters obtained by Miroshnichenko et al. (2001). An initial interpretation of the observed frequencies using the Aarhus non-radial pulsation code suggests that three frequencies could be associated with non-radial (=2) modes.
Finally, we present new evolutionary and pulsation models at lower metallicity (Z=0.008) to take into account the possibility that IP Per is metal deficient, as indicated by Miroshnichenko et al. (2001).
Key Words.:
stars: variables: Scuti – stars: oscillations – stars: pre-main sequence – stars: fundamental parameters – individual IP Per1 Introduction
Intermediate mass (M 1.5 M⊙) Pre-Main-Sequence (PMS) stars are known as Herbig Ae/Be stars (Herbig (1960)). This class of stars is characterized by spectral type A or B with emission lines, an infrared excess due to hot or cool circumstellar dust or both, and luminosity class III to V (Waters & Waelkens (1998)). Herbig Ae/Be are also well known for their photometric and spectroscopic variability on time scales of minutes to years mainly due to photospheric activity and interaction with the circumstellar environment (see e.g. Catala (2003)). However, the fact that these young stars during their contraction towards the Main-Sequence (MS) move across the pulsation instability region of more evolved stars has prompted the suggestion that at least part of the activity could be due to stellar pulsation (see Baade & Stahl (1989); Kurtz & Marang (1995)).
| HJD-2450000 | HJD-2450000 | Duration | Filter |
|---|---|---|---|
| start (days) | end (days) | (hours) | |
| Loiano CCD (Italy) | |||
| 2545.585 | 2545.659 | 1.8 | B |
| 2547.599 | 2547.681 | 2.0 | B |
| 2548.547 | 2548.611 | 1.5 | B |
| 2549.503 | 2549.623 | 2.9 | B |
| 2628.347 | 2628.627 | 6.7 | B |
| 2629.286 | 2629.453 | 4.0 | B |
| 2630.454 | 2630.513 | 1.4 | B |
| 2654.252 | 2654.332 | 1.9 | B |
| Fairborn-APT (USA) | |||
| 2976.875 | 2976.892 | 0.4 | BV |
| 2977.851 | 2977.936 | 2.0 | BV |
| 2978.721 | 2978.933 | 5.1 | BV |
| 2983.573 | 2983.920 | 8.3 | B |
| 2984.711 | 2984.917 | 4.9 | BV |
| 2987.765 | 2987.902 | 3.3 | BV |
| SOAO (Korea) | |||
| 2977.170 | 2977.333 | 3.9 | BV |
| 2980.910 | 2981.063 | 3.7 | V |
| 2983.007 | 2983.191 | 4.4 | BV |
| OSN (Spain) | |||
| 2988.267 | 2988.500 | 5.6 | uvby |
| 3047.364 | 3047.472 | 2.6 | uvby |
| 3048.299 | 3048.459 | 3.8 | uvby |
| Loiano TTCP (Italy) | |||
| 2946.330 | 2946.703 | 9.0 | BV |
| 2947.287 | 2947.441 | 3.7 | BV |
| 2973.393 | 2973.636 | 5.8 | BV |
| SARA (USA) | |||
| 2970.631 | 2970.756 | 3.0 | B |
| SPM (Mexico) | |||
| 2970.494 | 2970.818 | 7.8 | uvby |
| 2972.495 | 2972.841 | 8.3 | uvby |
| 2973.493 | 2973.775 | 6.8 | uvby |
| 2974.487 | 2974.585 | 2.4 | uvby |
| 2977.485 | 2977.847 | 8.7 | uvby |
| BAO (China) | |||
| 2972.974 | 2973.383 | 9.8 | V |
| 2974.032 | 2974.146 | 2.7 | V |
| 2974.939 | 2975.382 | 10.6 | V |
| 2976.940 | 2977.078 | 3.3 | V |
| 2984.196 | 2984.292 | 2.3 | V |
| Teide-OGS (Spain) | |||
| 2977.506 | 2977.603 | 2.3 | V |
| Serra la Nave (Italy) | |||
| 2966.462 | 2966.62 | 3.9 | BV |
| 2967.337 | 2967.61 | 6.7 | BV |
| 2973.348 | 2973.61 | 6.4 | BV |
The possible presence of pulsators among Herbig Ae/Be stars is particularly attractive since the precise observables which can be measured, i.e. the pulsation frequencies can, in principle, allow us to test evolutionary models by constraining the internal structure using asteroseismological techniques.
The existence of pulsating Herbig stars was originally suggested by Breger (1972) who discovered two candidates in the young open cluster NGC 2264. This initial finding was confirmed by subsequent observations of Scuti-like pulsations in the Herbig Ae stars HR5999 (Kurtz & Marang (1995)) and HD104237 (Donati et al. (1997)).
This empirical evidence stimulated the first theoretical investigation of the PMS instability strip based on non-linear convective hydrodynamical models (Marconi & Palla 1998). As a result, the topology of the PMS instability strip for the first three radial modes was identified. Marconi & Palla (1998) also pointed out that the interior structure of PMS stars entering the instability strip differs significantly from that of more evolved Main Sequence stars (with the same mass and temperature), even though the envelopes structures are similar. This property was subsequently confirmed by Suran et al. (2001) who made a comparative study of the seismology of a 1.8 PMS and post-MS star. Suran et al. (2001) found that the unstable frequency range is roughly the same for PMS and post-MS stars, but that some non-radial modes are very sensitive to the deep internal structure of the star. In particular, it is possible to discriminate between the PMS and post-MS stage using differences in the oscillation frequency distribution in the low frequency range ( modes, see also Templeton & Basu (2003)).
Up to now new observational programs have been carried out by various groups. The current number of known or suspected candidates amounts to about 30 stars (see the updated list at http://ams.astro.univie.ac.at/pms_corot.php, and the reviews by Zwintz et al. (2004), Marconi & Palla (2004) and Marconi et al. (2004)). However, only a few stars have been studied in detail, so that the overall properties of this class of variables are still poorly determined.
In this context, our group has started a systematic monitoring program (see Marconi et al. (2001), Ripepi et al. (2002), Pinheiro et al. (2003), Ripepi et al. (2003), Bernabei et al. (2004)) of Herbig Ae stars with spectral types from A to F2-3 with the following aims: 1) to identify the largest number of pulsating objects in order to observationally determine the boundaries of the instability strip for PMS Scuti pulsation; 2) to study in detail through multisite campaigns selected objects showing multiperiodicity (see Marconi et al. (2001), Ripepi et al. (2002),Pinheiro et al. (2003), Ripepi et al. (2003), Bernabei et al. (2004)). The multiperiodic pulsators are potential candidates for future asteroseismological analysis.
| Observatory | Telescope | Instrument | noise |
|---|---|---|---|
| (mmag) | |||
| Loiano (Italy) | 1.5m | BFOSC- 2002 | 0.2 |
| Loiano (Italy) | 1.5m | TTCP - 2003 | 0.2 |
| BAO (China) | 0.85m | TCP | 0.4 |
| SPM (Mexico) | 1.5m | Phot. | 0.6 |
| SARA (USA) | 0.9m | CCD | 1.5 |
| Teide (Spain) | 1.0m OGS | CCD | 0.6 |
| Fairborn (USA) | 0.75m T6 | SCP | 0.8 |
| OSN (Spain) | 0.9m | Phot. | 0.6 |
| Serra la Nave (Italy) | 0.9m | SCP | 1.3 |
| SOAO (Korea) | 0.6m | CCD | 0.7 |
During this project our attention turned to the star IP Per, already listed as Herbig Ae star by Thé et al. (1994) with spectral type A3e, and studied in detail by Miroshnichenko et al. (2001) both photometrically and spectroscopically. The main properties of this interesting object are:
-
•
IP Per is a typical UX Ori type star showing photometric variations with an amplitude of 0.3 mag and with duration of the minima of 10-50 days.
-
•
the fundamental stellar parameters are: spectral type A7, K, , km s-1 and [M/H] . Thus, IP Per is a dwarf metal-poor star.
-
•
its radial velocity and proper motion suggest that it most likely belongs to the Per OB2 association ( 300 pc, de Zeeuw et al. (1999)). At 300 pc and =1.0, IP Per falls onto the ZAMS at a mass of 1.8 M⊙.
In the following, we present the results of a photometric multisite campaign to study in detail the pulsational properties of IP Per. In Section 2. we describe the observations and data reduction techniques; in Section 3. we discuss the frequency analysis; Section 4 presents a comparison with theoretical models. A brief discussion concludes the paper. Preliminary results of our observations have been presented in Ripepi & Marconi (2004) and Ripepi et al. (2004).
2 Observations and data reduction
The campaign on IP Per was conducted in two parts: 1) single site observations during winter 2002/2003 (Loiano telescope); 2) multisite campaign during winter 2003/2004, involving 9 different telescopes/instruments, as described in Table 2 and more in detail in the next section. A total of about 190 hours of observations spanning 38 nights have been gathered. A detailed log of the observations is shown in Table 1.
As for the comparison star, we typically used the star TYC 2359-802-1 (03h 41m 15.36s +32∘ 23 49.7 (2000) BT=12.029 mag, VT=11.299 mag). It has been checked on the basis of CCD data obtained in Loiano in 2002, see below). HD 278941 (03h 41m 01.67s +32∘ 07 06.1 (2000) BT=9.957, VT=9.576 mag, A5) was the check star.
2.1 Details on single site observations
The exploratory run on IP Per was carried out in 2002/2003 with the Loiano 1.5m telescope (Italy). The observations has been gathered in the B filter by using the BFOSC instrument (http://www.bo.astro.it/loiano/observe.htm#manuals) equipped with a CCD EEV 1300x1340 pixel (R.O.N.=1.73 e-/pixel; GAIN=2.13 e-/ADU). The pixel scale was 0.58 arcsec/pixel, for a total field of view of 12.6 13 acrmin2. Sky flats, dark and bias exposures were taken every night. All data were reduced using standard IRAF routines. Aperture photometry was carried out by using the DAOPHOT II package (Stetson (1987)).
The multisite campaign in 2003 was carried out by using a variety of instruments, as described in some details in the Appendix.

2.2 Merging the data from different sites
In order to use simultaneously all the data gathered during the campaign we had to convert the data coming from Sierra Nevada and San Pedro Martir sites from Strömgren filters to the Johnson and ones. This was straightforward for the because (where means ), whereas to obtain we used the linear approximation by Warren & Hesser (1977) (equation 5), obtaining .


The different datasets from the various telescopes were inspected carefully, and scattered points due to bad weather (very frequent for data obtained with single channel photometers data) or other causes have been removed.
Due to the differences of the various instruments and filters used, and in order to prevent problems with zero point differences between different datasets, as well as to prepare the data for Fourier analysis, we decided to detrend the data to a common average zero value.
In total, during our study of IP Per we obtained three different time series:
-
1.
B filter data from Loiano 2002/2003 observations (2002 B dataset here after)
-
2.
B filter data from multisite campaign 2003/2004 (2003 B dataset here after)
-
3.
V filter data from multisite campaign 2003/2004 (2003 V dataset here after)
The light curve for the 2002 B dataset is shown in Fig. 1, while the left and right panels of Fig. 2 show the light curves for the 2003 V and B datasets respectively. In order to appreciate the quality of the V data taken in 2003 we report in Fig. 3 a zoom of Fig. 2 (left panel) including only the Loiano TTCP data (V filter), which is representative of our highest quality photometry.
2.3 uvby Hβ measurements for IP Per
During our uvby measurements collected at Sierra Nevada Observatory, two brighter comparison stars C1=HD 22418 and C2=HD 21913 were used for purposes of calibration. In addition, a few Hβ observations were also obtained. Then, instrumental magnitude differences were obtained relative to C1. To transform these instrumental differences into the standard uvbyβ system, we have followed the procedure described in Rodríguez et al. (1997). Thus, the transformation equations, obtained using a set of 19 standards stars selected from the list of Crawford & Mander (1966) and Crawford & Barnes (1970), were used.
Next, the absolute standard uvbyβ indices of IP Per, C1 and C2 were obtained following the method described in Rodríguez et al. (2003), using C1 and C2 as zero-points. The results are listed in Table 3 together with those listed in the bibliography for the comparison stars. The error bars in this table represent the standard deviations of magnitude differences relative to C1. As seen, our results are in very good agreement with the values found in the homogeneous catalogue of Olsen (1996, private communication). Similar results can be found in the list by Olsen E.H. (1983) and Hauck B. & Mermilliod (1998).
| Star | V | b-y | m1 | c1 | |
|---|---|---|---|---|---|
| (mag) | (mag) | (mag) | (mag) | (mag) | |
| IP Per | 10.374 | 0.239 | 0.144 | 0.834 | 2.763 |
| (49,5) | 6 | 6 | 6 | 15 | 9 |
| C1=HD22418 | 6.963 | 0.280 | 0.163 | 0.420 | 2.646 |
| (49,6) | 4 | 3 | 4 | 9 | 4 |
| C2=HD21913 | 7.627 | 0.297 | 0.136 | 0.473 | 2.640 |
| (21,5) | 4 | 3 | 4 | 9 | 5 |
| C1=HD22418 | 6.962 | 0.281 | 0.167 | 0.419 | 2.645 |
| C2=HD21913 | 7.628 | 0.296 | 0.132 | 0.473 | 2.640 |
| 2003 V dataset | 2003 B dataset | 2002 B dataset | |||||||
|---|---|---|---|---|---|---|---|---|---|
| Frequency | Amplitude | confidence | Frequency | Amplitude | confidence | Frequency | Amplitude | confidence | |
| (c/d) | (mmag) | (%) | (c/d) | (mmag) | (%) | (c/d) | (mmag) | (%) | |
| 22.89 | 1.9 | 99.9 | 22.89 | 3.1 | 99.9 | 22.88 | 3.3 | 99.9 | |
| 34.60 | 1.5 | 99.9 | 34.82 | 2.1 | 99.9 | 34.64 | 3.3 | 99.9 | |
| 30.45 | 1.8 | 99.9 | 30.45 | 1.8 | 99.9 | 30.48 | 3.2 | 99.9 | |
| 48.23 | 1.6 | 99.9 | 48.45 | 2.0 | 99.9 | 48.23 | 1.9 | 99.9 | |
| 28.79 | 1.5 | 99.9 | 27.73 | 1.9 | 99.9 | ||||
| 23.99 | 1.3 | 99.9 | |||||||
| 9.30 | 1.3 | 99.9 | |||||||
| 41.11 | 1.2 | 99.9 | 42.08 | 1.9 | 99.0 | 42.27 | 2.3 | 99.9 | |
| 52.00 | 1.1 | 99.9 | |||||||
3 Frequency Analysis
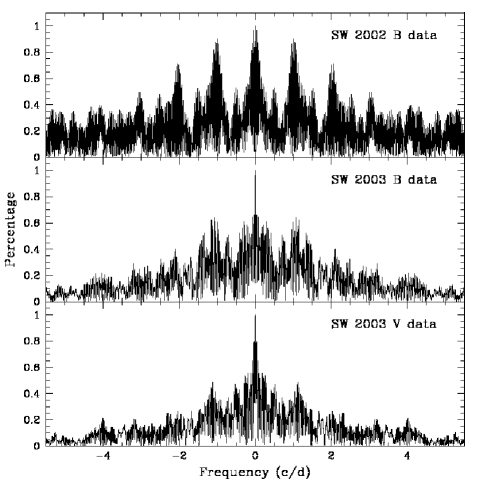
The frequency analysis was performed using the period04 package (Lenz & Breger (2005)), based on the Fourier transform method. For a better interpretation of the results, we have first calculated the spectral window (SW) for each dataset. The result is shown in Fig. 4 where from top to bottom we report the SW for the three time series identified in the previous section (see labels in the figure). The SW was used as a diagnostic to distinguish between real and spurious frequencies.

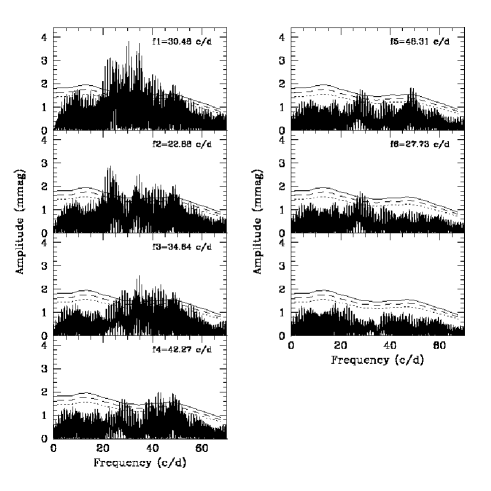
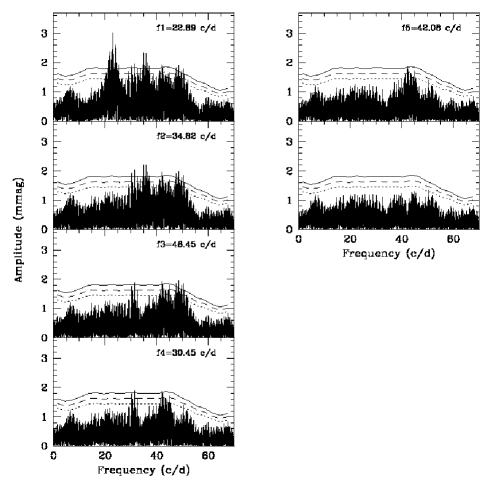
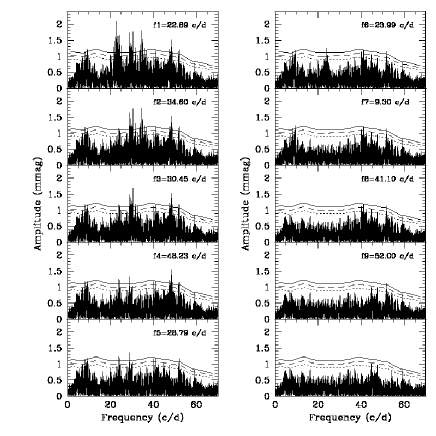
Each data set described in the previous Section has been analysed separately. Figures 5, 6, 7 show the Fourier transform for the datasets 2002 B, 2003 B and 2003 V respectively. Here, in each panel the peak with largest amplitude is selected and then removed, obtaining a new spectrum shown in the following panel. The last panel shows the periodogram after the prewithening with all the significant frequencies. The solid, dashed and dotted lines show the 99.9%, 99% and 90% confidence levels calculated following the widely used recipe by Breger et al (1993) and Kuschnig et al. (1997). The error on the measured frequencies (apart from the 1 c/d alias) can be roughly estimated from the FWHM of the main lobe in the spectral window (see Alvarez et al. (1998) and references therein). As a result we found 0.25 c/d, 0.15 c/d and 0.11 c/d for the datasets 2002 B, 2003 B and 2003 V respectively.
The frequencies found for the three datasets are summarized in Table 4. In order to discuss in detail the results of the frequency analysis, let us take as reference the frequencies obtained with the 2003 V dataset which is the best one. Then we find:
-
•
c/d, c/d, c/d, c/d are present, within the quoted errors, in every dataset.
-
•
c/d is the +1 c/d alias of the c/d frequency found in the 2002 B dataset. Due to the better duty cycle of the V data we shall retain c/d for comparison with the models.
-
•
c/d is probably the -1 c/d alias of c/d in the 2003 B dataset and c/d in the 200V B dataset. As before, we shall use the frequency obtained in the V filter.
-
•
=23.99 c/d, =9.30 c/d and c/d are found only in the V filter probably because of the better S/N of this dataset.
In summary, the multisite campaign allowed us to identify up to 9 significant frequencies for IP Per. The fit to the observed data points obtained with period04 including the nine is shown in Fig.3. Five of these are present in each dataset. In particular we confirm all the six frequencies (within the errors and taking into account the 1 c/d alias) found during the single site CCD study (i.e. the 2002 B dataset) of IP Per.
4 Comparison with theoretical models
The results presented in the previous Section can be used to constrain the intrinsic stellar properties of IP Per and in particular its mass and position in the HR diagram, through comparison with stellar pulsation models. Using a linear non-adiabatic pulsation code (see Marconi & Palla 1998, Marconi et al. (2004) for details) we could not reproduce all the observed frequencies. In fact, we can recover at most 5 of the 9 observed frequencies for , , . This solution corresponds to a radial pulsation model which simultaneously oscillates in the first (), second (), third (), fifth () and sixth () overtones. Its position in the HR diagram is shown in Fig. 8 together with the predicted instability strip by Marconi & Palla (1998) and the PMS evolutionary tracks computed for the labelled stellar masses with the FRANEC stellar evolution code (Chieffi & Straniero (1989), Castellani et al. (1999)). The PMS track is represented by the dotted line.
In order to reproduce the observed frequencies that were not found from the radial analysis and, at the same time to investigate the possibility, strongly supported by empirical evidence on other PMS Scuti stars (see e.g. Balona et al. (2002)), that non-radial modes are also present in IP Per, we have attempted an asteroseismological interpretation of the data using the Aarhus adiabatic non-radial pulsation code (http://astro.phys.au.dk/jcd/adipack.n/). A preliminary application of this code to the PMS evolutionary structure corresponding to the best-fit radial pulsating model seems to suggest that , and are associated to non-radial modes with . As for , neither the radial nor the non-radial analyses are able to match the observed value for the selected stellar parameters.

4.1 Comparison with post-MS pulsation models
Both spectroscopic measurements and PMS model predictions seem to suggest that the position of IP Per in the HR diagram is near the MS, in a region where PMS and post-MS evolutionary tracks, at fixed stellar mass, are known to intersect and remain quite close to each other. In order to investigate the effect of the assumed evolutionary status on the predicted frequencies, we have taken into account the post-MS evolution of stellar models with masses ranging from 1.7 to 1.8 , computed with the FRANEC code. As a result, we find that the post-MS evolutionary model located at the same luminosity and effective temperature of our PMS best fit model (see Fig. 8), has a stellar mass of 1.73 , i.e. only slightly lower than the PMS counterpart (1.77 ). As a consequence the structure of this post-MS model produces periods slightly longer than the best fit PMS solution, but differences are of the order of minutes for both radial and non-radial modes. The 1.73 post-MS model, reproducing the same number of frequencies as the PMS one, would require a slightly different luminosity and effective temperature, namely , . The values of the predicted mode periodicities are in this case very similar to the PMS ones. However, we know that the small differences in the non-radial frequencies can produce evident changes in the large and small frequency separations, in particular for , as extensively discussed by Suran et al. (2001). This occurrence would in principle allow to verify the PMS nature of IP Per if very accurate and long time based observations (e.g. from space) were available.
4.2 Effect of the metal abundance
All the above evolutionary and pulsational analysis is based on models with solar chemical composition, namely Z=0.02, Y=0.28. If the evidence pointed out by Miroshnichenko et al. (2001) that IP Per has significantly lower metal abundance () is confirmed, the above theoretical interpretation would have to be modified, as discussed in the following.
4.2.1 The instability strip
We computed new nonlinear radial pulsation models, with the same code and the same numerical and physical assumptions as in Marconi & Palla (1998), but with Z=0.008, Y=0.25. The resulting instability strip for the first three radial modes is reported in Fig.9 (dashed lines). As shown in this figure, where the instability strip for Z=0.02 is also plotted for comparison, the metallicity effect on the theoretical boundaries is rather small (200 K at most for each luminosity level) and decreases toward the higher luminosities, with a global shift of the instability region toward higher effective temperatures, as Z decreases from Z=0.02 to Z=0.008.
4.2.2 Pulsational frequencies
We also computed new PMS evolutionary models at Z=0.008, Y=0.25 with the FRANEC code and the same assumptions used for solar chemical composition. Then we computed linear nonadiabatic radial pulsation models111We did not compute nonradial models because our version of the Aarhus nonradial code assumes solar metallicity. The extension of nonradial computations to other chemical compositions will be addressed in a future work. along the Z=0.008 PMS tracks, in order to match the observed frequencies of IP Per. The resulting best fit radial model for Z=0.008 Y=0.25, again pulsating in five radial modes with , , , and , corresponds to a PMS structure with , , . Its position in the HR diagram is shown in Fig. 10 together with the predicted instability strip for Z=0.008 and the corresponding PMS evolutionary track. Inspection of this figure clearly indicates that the predicted position in the HR diagram of IP Per, assuming Z=0.008, is in good agreement with the empirical spectroscopic determination by Miroshnichenko et al. (2001) (filled circle).
However, the observationally derived metal deficit reflects only the current state of the atmosphere and may be due to recent effects, such as interaction with the circumstellar medium (see Gray & Corbally (1998)). In this case it would represent only a surface effect. As the PMS structure of our best fit model is characterized by a radiative envelope, such a contamination should not have any effect on the pulsation properties which involve deeper layers across the Hydrogen and Helium ionization regions.On the other hand the different abundances in the surface layer would affect the position in the HR diagram due to the opacity variation. A detailed modeling of this case is beyond the purposes of the present paper. At the same time a more accurate determination of the metal poor nature of IP Per would be important.


5 Conclusions
A total of about 190 hours of observations obtained during 38 nights at 9 different telescopes on the PMS Scuti star IP Per have been presented. The Fourier analysis of this data set confirms the multiperiodic nature of this pulsator: we have identified nine frequencies of pulsation which are significant on the basis of the Breger et al (1993) and Kuschnig et al. (1997) criteria.
Comparison with the predictions of linear non-adiabatic radial pulsation models allows us to recover only five out of the nine observed frequencies for a 1.77 model. Non-radial pulsation is also present in this star. A preliminary interpretation of the observed frequencies through the Aarhus non-radial code, applied to the evolutionary structure of the 1.77 model reproducing , , , and with radial modes, seems to indicate that , and are associated with non-radial modes with . Specific post-MS evolutionary and pulsational models were computed in order to investigate the dependence of radial and non-radial output frequencies on the assumed evolutionary status. The resulting post-MS solution has similar stellar parameters and mode frequencies.
Finally the possible effect of the metal poor nature of IP Per detected by Miroshnichenko et al. (2001) on both pulsation and evolutionary properties is discussed. We find that if the metallicity of IP Per is as low as Z=0.008 the best fit radial model has a significantly lower mass than the case at solar chemical composition but the pulsation characteristics are similar.Also the estimated position of IP Per in the HR diagram appears to be in good agreement with the independent determination by Miroshnichenko et al. (2001). Whether the low metallicity is a property only of the surface layers or represents a systematic deficit throughout the interior, as we have assumed in our modeling, should be clarified before final conclusions on the stellar parameters of IP Per can be reached.
Acknowledgements.
We wish to thank our referee, Dr. Miroshnichenko for his valuable suggestions which helped improving the paper. This work made use of CDS database in Strasbourg. It is a pleasure to thank J. Christensen-Dalsgaard for useful comments and suggestions on the use of the Aarhus adiabatic non-radial pulsation code. We also thank S. Degl’Innocenti and P.G. Prada Moroni for their help with the FRANEC code. We are indebted to S. Leccia for useful discussions. V.R. wishes to thank the personnel of the Loiano Observatory for their help with the observations. T.D.O. acknowledges support from NSF grant AST0206115.References
- Alvarez et al. (1998) Alvarez, M., Hernandez, M.M., Michel, E., et al. 1998, A&A, 340, 149
- Baade & Stahl (1989) Baade, D. & Stahl, O. 1989, A&A, 209, 255
- Balona et al. (2002) Balona, L. A., Koen, C. & van Wyk, F. 2002, MNRAS, 333, 923
- Bernabei et al. (2004) Bernabei, S., Ripepi, V., Marconi, M., et al. 2004, in IAU symp.224, The A star puzzle, J. Zverko, J. Žižňovský, S.J. Adelman, W.W. Weiss eds, p. 812
- Breger (1972) Breger, M. 1972 ApJ, 171, 539
- Breger & Hiesberger, (1999) Breger, M. & Hiesberger, F. 1999, A&AS, 135, 547
- Breger et al (1993) Breger, M., Stich, J., Garrido, R., et al. 1993, A&A, 271, 482
- Castellani et al. (1999) Castellani, V., Degl’Innocenti, S., Marconi, M. 1999, MNRAS, 303, 265
- Catala (2003) Catala, C. 2003, Ap&SS, 284, 53
- Chieffi & Straniero (1989) Chieffi, A. & Straniero, O. 1989, ApJS, 71, 47
- Crawford & Barnes (1970) Crawford, D.L. & Barnes, J.V. 1970, AJ, 75, 978
- Crawford & Mander (1966) Crawford, D.L. & Mander J. 1966, AJ, 71, 114
- de Zeeuw et al. (1999) de Zeeuw, T., Hoogerwerf, R., de Bruijne, J.H.J., Brown, A.G.A., Blaaw, A. 1999, AJ, 117, 354
- Donati et al. (1997) Donati, J.-F., Semel, M., Carter, B. D., Rees, D. E., & Cameron, A. C. 1997, MNRAS, 291, 658
- Hauck B. & Mermilliod (1998) Hauck B. & Mermilliod M. 1998, A&AS, 129, 431
- Herbig (1960) Herbig, G.H. 1960, ApJS, 4, 337
- Kurtz & Marang (1995) Kurtz, D. W., & Marang, F. 1995, MNRAS, 276, 191
- Gray & Corbally (1998) Gray, R. O., Corbally, C. J. 1998, AJ, 116, 2530
- Kuschnig et al. (1997) Kuschnig, R., Weiss, W.W., Gruber, R., Bely, P.Y., Jenkner, H. 1997, A&A, 328, 544
- Lenz & Breger (2005) Lenz, P. & Breger, M. 2005, CoAst, 146, 53
- Marconi & Palla (1998) Marconi, M.,& Palla, F. 1998, ApJ, 507, L141
- Marconi & Palla (2004) Marconi, M. & Palla, F. 2004, in IAU symp.224, The A star puzzle, J. Zverko, J. Žižňovský, S.J. Adelman, W.W. Weiss eds, p. 69 (astro-ph/0410141)
- Marconi et al. (2001) Marconi, M., Ripepi, V., Bernabei, et al. 2001, A&A, 372, L21
- Marconi et al. (2004) Marconi, M., Ripepi, V., Palla, F., Ruoppo, A., 2004, CoAst, 145, 61
- Miroshnichenko et al. (2001) Miroshnichenko, A.S., Bjorkman, K.S., Chentsov, E.L., et al.2001, A&A, 377, 854
- Olsen E.H. (1983) Olsen, E.H. 1983, A&AS, 54, 55
- Palla & Stahler (1993) Palla, F. & Stahler, S.W. 1993, ApJ, 418, 414
- Pinheiro et al. (2003) Pinheiro, F. J. G., Folha, D. F. M., Marconi, M., et al. 2003, A&A, 399, 271
- Ripepi et al. (2002) Ripepi, V., Palla, F., Marconi, M., et al. 2002, A&A, 391, 587
- Ripepi et al. (2003) Ripepi, V., Marconi, M., Bernabei, et al. 2003, A&A, 408, 1047
- Ripepi et al. (2004) Ripepi, V., Bernabei, S., Marconi, M., et al. 2004, in IAU symp.224, The A star puzzle, ed. J. Zverko, J. Žižňovský, S.J. Adelman, W.W. Weiss, p. 799
- Ripepi & Marconi (2004) Ripepi, V. & S., Marconi, M. 2004, in Second Eddington Workshop: Stellar structure and habitable planet finding, F. Favata, S. Aigrain and A. Wilson eds, ESA SP-538, p. 397
- Rodríguez et al. (1997) Rodríguez, E., González-Bedolla, S.F., Rolland, A., Costa, V., López de Coca, P. 1997, A&A, 324, 959
- Rodríguez et al. (2003) Rodríguez, E., Costa, V., Handler, G., García, J.M. 2003, A&A, 399, 253
- Stetson (1987) Stetson, P.B. 1987, PASP, 99, 191
- Strassmeier et al. (1997) Strassmeier, K.G., Boyd, L.J., Epand, D.H., Granzer, Th. 1997, PASP, 109, 697
- Suran et al. (2001) Suran, M., Goupil, M., Baglin, A., Lebreton, Y., Catala, C. 2001, A&A, 372, 233
- Templeton & Basu (2003) Templeton, M.R., Basu, S., 2003, in: Asteroseismology across the HR Diagram, M.J. Thompson, M.S. Cunha and M.J.P.F.G. Monteiro eds., Kluwer, 565
- Thé et al. (1994) Thé, P.S., de Winter, D., Perez, M.R. 1994, A&AS, 104, 315
- Warren & Hesser (1977) Warren, W.H.& Hesser, J.E. 1977,ApJS, 34, 207
- Waters & Waelkens (1998) Waters, L. B. F. M.& Waelkens, C. 1998,ARA&A, 36, 233
- Zwintz et al. (2004) Zwintz K., Marconi M., Kallinger T., Weiss W.W., 2004, in IAU symp.224, The A star puzzle, ed. J. Zverko, J. Žižňovský, S.J. Adelman, W.W. Weiss eds, p. 353
Appendix A Details on the instrumentation used
In this appendix we describe in some detail the combinations telescope/instrument used during the 2003 multisite campaign and summarized in Tab. 2. An indication on data reduction procedures is reported too.
-
1.
The Loiano (2003) observations were obtained with the 1.5m telescope equipped with the Toppo Three Channel Photometer (TTCP, see http://www.na.astro.it/%7Esilvotti/TTCP.html for details). This instrument allows the simultaneous observation of the variable and comparison stars, as well as of the sky. Therefore it is possible to obtain high precision photometry with fast sampling. The data reduction is also straitforward.
-
2.
The BAO measurements were obtained with the 0.85m telescope placed at the Beijing Astronomical Observatory. The telescope is equipped with a Three Channel Photometer (TCP) which is very similar to the TTCP quoted above. More details on BAO instruments can be found at www.bao.ac.cn.
-
3.
The OSN measurements were obtained with the 0.90 m telescope located at the Observatorio de Sierra Nevada in Granada, Spain. The telescope is equipped with a simultaneous four-channel photometer ( Strömgren photoelectric photometer). More details on the instrument can be found at http://www.osn.iaa.es/fotometro_eng.html.
-
4.
The SPM measurements were carried out with the 1.5 m telescope at the San Pedro Martir Observatory, Mexico. The 1.5 m telescope was equipped with a simultaneous Strömgren photoelectric photometer, which is the twin of the OSN instrument mentioned above. The SPM instrument (named “Danish”) is described at http://haro.astrossp.unam.mx/Instruments/.
-
5.
The Serra la Nave data were obtained with the 0.91cm telescope of the Catania Astrophysical Observatory, Italy. The telescope is equipped with a Single Channel Photometer (SCP here after) which is described at http://w3c.ct.astro.it/sln/strumenti.html.
- 6.
-
7.
The SARA measurements were collected by using the 0.9 m automated telescope at Kitt Peak in Arizona (USA). Images were collected using an Apogee AP7p camera with a back-illuminated SITe SIA 502AB 512x512 pixel CCD. The pixels are 24 microns square, corresponding to 0.73” at the telescope focal plane scale. Sky flats, dark and bias exposures were taken every night. All data was calibrated and reduced using standard IRAF routines.
-
8.
The OGS observations were collected with the 1.0m OGS telescope placed at the Teide Observatory (Tenerife, Canary Islands, Spain). The telescope was equipped with a 1024x1024 pixel CCD. The pixel scale was 0.32 for a total field of view of 5.5x5.5. Typical integration times were 10-15 sec, depending upon sky conditions. Sky flats, dark and bias exposures were taken every night. All data was calibrated and reduced using standard IRAF routines.
-
9.
The SOAO data were obtained with the 0.61m telescope placed at the Sobaeksan Optical Astronomy Observatory (SOAO) in Korea. The telescope was equipped with a SITe 2K CCD camera. The field of view of a CCD image is about arcmin2 on the f/13.5 Cassegrain focus of the telescope. Data reduction has been performed using the standard IRAF/CCDRED package. Instrumental magnitudes were obtained via the simple aperture photometric routine in the IRAF/APPHOT package.