SiO =5–4 in the HH 211 protostellar jet imaged with the SMA
Abstract
We have mapped the SiO =5–4 line at 217 GHz from the HH2̇11 molecular outflow with the Submillimeter Array (SMA). The high resolution map (1.60.9′′) shows that the SiO =5–4 emission comes from the central narrow jet along the outflow axis with a width of 0.8′′ ( 250 AU) FWHM. The SiO jet consists of a chain of knots separated by 3–4′′ ( 1000 AU) and most of the SiO knots have counterparts in shocked H2 emission seen in a new, deep VLT near-infrared image of the outflow. A new, innermost pair of knots are discovered at just 2′′ from the central star. The line ratio between the SiO =5–4 data and upper limits from the SiO =1–0 data of Chandler & Richer (2001) suggests that these knots have a temperature in excess of 300–500 K and a density of (0.5–1)107 cm-3. The radial velocity measured for these knots is 30 km s-1, comparable to the maximum velocity seen in the entire jet. The high temperature, high density, and velocity structure observed in this pair of SiO knots suggest that they are closely related to the primary jet launched close to the protostar.
1 INTRODUCTION
Several highly-collimated molecular outflows driven by deeply-embedded young stellar objects are known to have an extremely-high velocity (EHV) flow component, with terminal velocities of 50–150 km s-1(e.g., Bachiller, 1996). These EHV components are closely confined to the axes of the lobes and have large momenta, comparable to those of the slowly-moving (20–30 km s-1) “classical” outflows. As a result, it is felt that the EHV flow is closely connected with the “primary jet” responsible for driving the broader molecular outflow.
The HH 211 outflow (D 315 pc) was discovered via near-infrared H2 imaging (McCaughrean et al., 1994) and is an archetypal outflow with a highly-collimated EHV jet. The outflow is driven by a low-luminosity (3.6 ) Class 0 protostar ( 33 K) and is thought to be extremely young ( 750 yr). The CO =2–1 images of Gueth & Gulloteau (1999, hereafter GG99) with a spatial resolution of 1.5′′ show remarkable features: the low-velocity CO delineates a pair of cavities whose tips are associated with the near-infrared H2 emission, while the high-velocity CO traces a narrow jet whose velocity increases linearly with distance from the star. In spite of a small opening angle of 22∘, the CO =2–1 emission from the cavity appears on both sides of the central star at velocities close to the systemic velocity of = 9.2 km s-1 (GG99), implying that the outflow axis lies within 10∘ of the plane of the sky. The jet component (but not the cavity) is also traced by thermal SiO emission, in =1–0 (Chandler & Richer, 2001, hereafter CR01), =5–4 (Gibb et al., 2004), =8–7 and =11–10 (Nisini et al., 2002) transitions. Since these lines have critical densities larger than cm-3 and the energy level of =11 is higher than 100 K, the detection of these SiO lines means that the jet is much denser and warmer than the lower-velocity cavity component.
2 OBSERVATIONS
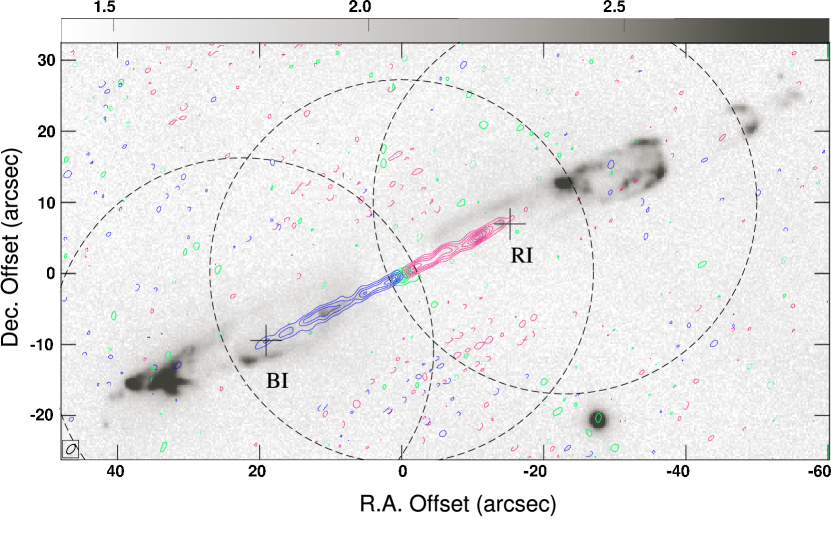
The observations of the SiO =5–4 transition at 217.105 GHz were carried out on January 30, 2004 with the six antennas of the Submillimeter Array (SMA)111The Submillimeter Array (SMA) is a joint project between the Smithsonian Astrophysical Observatory and the Academia Sinica Institute of Astronomy and Astrophysics, and is funded by the Smithsonian Institution and the Academia Sinica. on Mauna Kea, Hawaii (Ho, Moran, & Lo, 2004). We used an extended array configuration that provides baselines ranging from 17 m to 179 m. The primary-beam size (HPBW) of the 6 m diameter antennas at 217 GHz was measured to be 54′′. Thus, in order to cover the whole outflow ( 90′′ along the major axis), we observed three fields separated by 25′′ along the major axis of the outflow (Fig. 1). The spectral correlator was set to provide a uniform frequency resolution of 406.25 kHz across a 2 GHz wide band. The visibility data were calibrated using the MIR package, with 3C84 used as a phase and amplitude calibrator, and Ganymede and Titan as flux calibrators: uncertainty in the flux scale is estimated at 20%. The bandpass was calibrated by observations of Jupiter or Saturn. The calibrated visibility data were imaged using MIRIAD, followed by a non-linear joint deconvolution using the CLEAN-based algorithm, MOSSDI, with robust weighting of 0.5 providing a synthesized beam of 1.60.9′′ at a position angle of 41∘. A continuum map was obtained by averaging the line-free channels of both sidebands separated by 10 GHz, this time with natural weighting providing a synthesized beam of 1.70.9′′ at a position angle of 44∘. Figure 1 shows a compact 220 GHz continuum source at = 03h43m56.79s, = 32∘00′50.0′′ (J2000.0) with a peak flux of 73 mJy beam-1 (12) and a total integrated flux of 200 mJy. This latter flux is approximately 70% of the 230 GHz flux measured by GG99 using similar baselines (24–180 m) to ours, and it is likely that the relatively poor sensitivity of our measurements ( 6.2 mJy beam-1) failed to recover all of the low-level emission seen in the higher sensitivity ( 3 mJy beam-1) data of GG99.
A new, deep near-infrared image of HH 211 was obtained using the ISAAC instrument of the ESO Very Large Telescope at Paranal, Chile on January 4, 2002 under clear conditions. Images were taken through a 1% wide filter centered on the v=1–0 S(1) line of H2 at 2.122 m. A 22 position mosaic was used to cover a 55 arcmin region centered near HH 211-mm at an image scale of 0.148 arcsec/pixel. In the central, fully-overlapping region, the total integration time was 8 min pixel-1 after mosaicing. The data reduction was standard, including the subtraction of a blank sky image made from a median-filtered stack of the source images and flat fielding using a sequence of twilight-illuminated images. The data were corrected for the small geometric distortion in ISAAC using the coefficients determined from images of M 16 by McCaughrean & Andersen (2002), before being aligned and mosaiced. Despite a mean airmass of 1.9, the resulting resolution is 0.60 arcsec FWHM and accurate astrometry (0.10 arcsec rms) was derived from 17 stars in common with the 2MASS Point Source Catalog. An approximate flux calibration yields a 3 surface brightness limit of W m-2 pixel-1. The central portion of this new image shown in greyscale in Figure 1 well delineates the key structures in the outflow, including the knots along the central axis and the excavated cavity (part of which is continuum emission as shown in Figure 1 of Eislöffel et al., 2003) outside them.
3 RESULTS AND DISCUSSION
3.1 The highly-collimated SiO jet
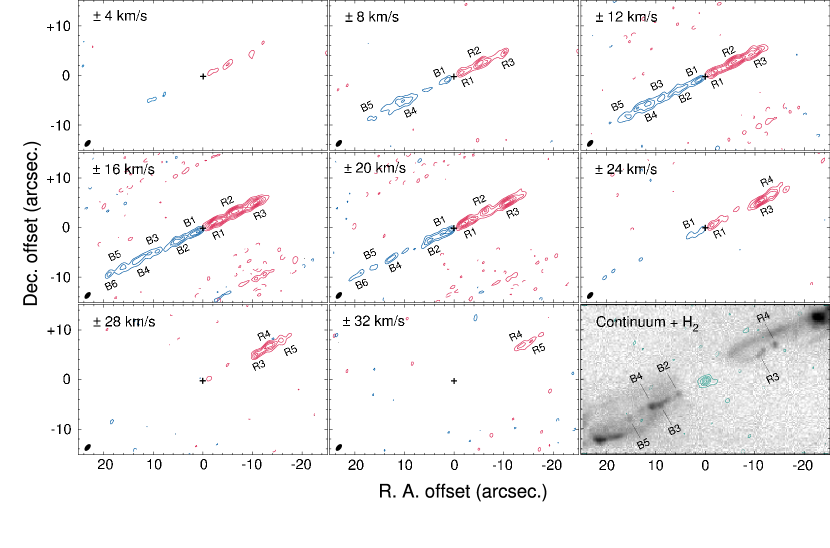
SiO =5–4 emission was detected from HH 211 in two velocity ranges from 24km s-1 to 4 km s-1 (blueshifted) and from +4 km s-1 to +32 km s-1 (redshifted) with respect to the systemic velocity of = 9.2 km s-1. Integrated intensity maps of the blueshifted and redshifted emission are shown in Figure 1 and velocity channel maps at 4 km s-1 intervals are presented in Figure 2. The SiO =5–4 emission is seen to be concentrated exclusively in the jet-like narrow region along the outflow axis and there is no counterpart to the low-velocity cavity component seen in CO =2–1 (GG99). We have smoothed the SMA map to a resolution of 22′′ and compared it with the SiO =5–4 spectrum observed with the JCMT (Gibb et al., 2004), finding that 80–100% of the single-dish flux is recovered by the SMA, despite the missing short spacing information. This confirms that almost all of the SiO =5–4 emission arises from a narrow jet. After deconvolution of the SMA beam, the width of the SiO =5–4 jet is 0.8′′ ( 250 AU) FWHM. It comprises a chain of knots each separated by 3–4′′ ( 1000 AU), with five discrete knots (R1–R5 in Fig. 2) on the redshifted side and six (B1–B5) on the blueshifted side. Knots B2–B5, R3, and R4 all appear to have near-infrared H2 counterparts, while the lack of H2 emission coincident with B1, R1, and R2 is probably due to the very high extinction associated with the dense protostellar envelope as traced in H13CO+ (GG99) and NH3 (Wiseman, 2001). In addition, the innermost knots, B1 and R1, have no counterparts in SiO =1–0 (CR01) or CO =2–1 (GG99).
The blueshifted side of the SiO =5–4 jet ends near an H2 knot roughly 23′′ to the east of the protostar and the redshifted side 18′′ to the west of the center. The SiO =5–4 does not not extend as far as the CO =2–1 jet observed by GG99, terminating at features BI and RI (marked on Figure 1), respectively: no SiO =5–4 is seen beyond these positions, even though our three-pointing mosaic covered almost the entire outflow. The lowest transition SiO =1–0 also terminates at BI and RI (CR01), and the implication is that beyond these points, the jet is no longer dense enough to excite SiO emission. An alternative hypothesis is that beyond BI and RI, the SiO has been destroyed via chemical processing in shocks, as described by CR01.
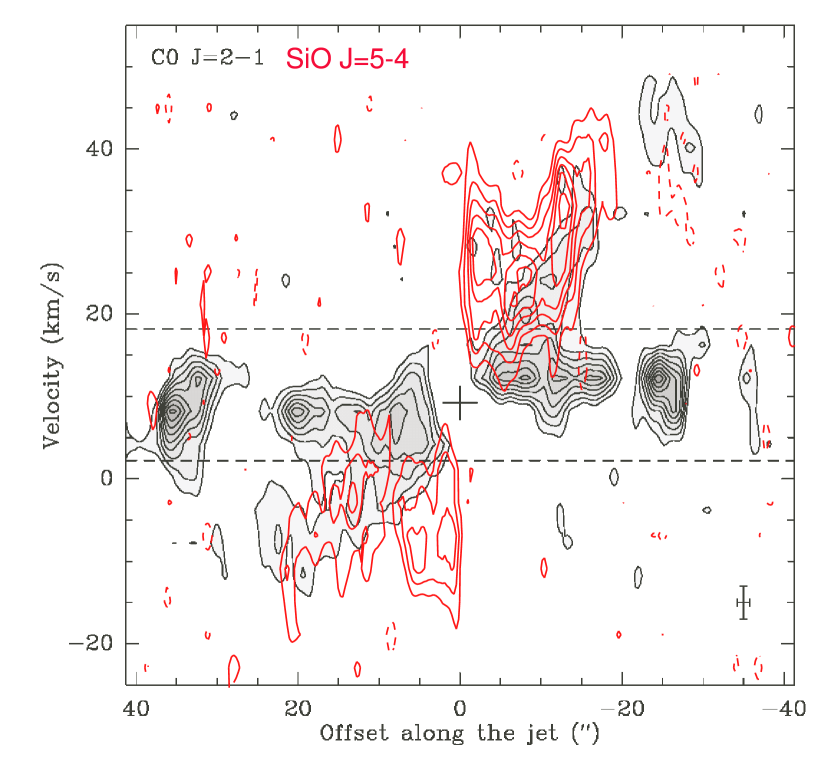
An SiO =5–4 position-velocity diagram along the jet axis (Figure 3) shows a different velocity structure to that seen in CO =2–1 (GG99). In particular, the SiO =5–4 exhibits a large velocity dispersion at the innermost knots B1 and R1, suggesting that these knots are kinematically distinct from those in the outer part. At 2′′ ( 630 AU) from the protostar, the velocity centroid and the terminal velocity reach 18 km s-1 and 30 km s-1, respectively . The outer part of the SiO =5–4 shows a Hubble-like velocity structure, previously seen for the CO =2–1. However, the SiO jet is moving 5 km s-1 faster than the CO jet, reaching a maximum radial velocity of 35 km s-1. Assuming that the axis of the flow is inclined by 10∘ out of the plane of the sky, the deprojected outflow velocity in the jet would correspond to 200 km s-1, typical of the velocity of the primary jet driven by low-mass stars.
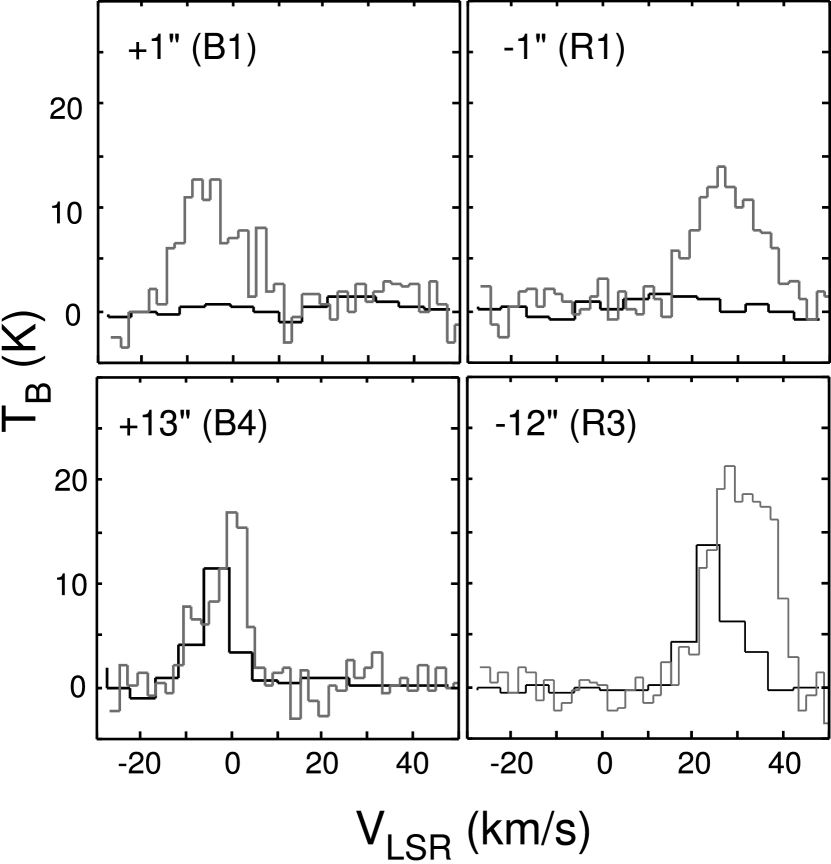
In Figure 4, we compare line profiles of the SiO =5–4 at knots B1, R1, B4, and R3, with those observed in =1–0 with the VLA by CR01. In order to obtain line intensity ratios (Table 1), we convolved the data cubes of the two transitions to an equal angular resolution of 1.6′′. Then, to derive physical parameters in the jet as traced by SiO emission, we carried out large velocity gradient (LVG) statistical equilibrium calculations following the method of Nisini et al. (2002). CR01 reported peak brightness temperatures of the SiO =1–0 of 54 K and 47 K in the redshifted and blueshifted gas, respectively, averaged over a 0.580.43′′ beam. These SiO =1–0 emission peaks correspond to the positions of R3 and B4 in our data, where the 5–4/1–0 ratio is seen to be 2. The LVG calculations suggest that a density of (0.5–1)107 cm-3, a temperature of 60–120 K, and an SiO abundance (SiO) of (0.5–1)10-6 are required to satisfy both the lower limit of the SiO =1–0 brightness temperature and the 5–4/1–0 ratio. As no =1–0 emission was detected at the innermost knots, B1 and R1, the 5–4/1–0 ratio must exceed 10: in order to reproduce such ratios, the same density range of (0.5–1)107 cm-3 is again required, but at a much higher gas kinetic temperature, in excess of 300–500 K. These density and temperature ranges for B1 and R1 agree with those derived from the higher- transition SiO lines observed with a single-dish telescope (Nisini et al., 2002) and the high- CO lines observed with the ISO Long Wavelength Spectrometer (Giannini et al., 2001).
3.2 The structure of the HH211 outflow
The rim-brightened shapes seen in the near-infrared and CO =2–1 images suggest that the outflow lobes are the cavities filled with lower-density gas. Since the mean density of the molecular cloud core in which HH 211 lies is 4104 cm-3 (Bachiller et al., 1987), the density inside the cavities should be on the order of 104 cm-3 or less. On the other hand, the SiO jet along the lobe axis has a much higher density of (0.5–1)107 cm-3. The strong H2 emission observed in HH 211 suggests that the shocks in this outflow are nondissociative C-shocks (e.g., Hollenbach, 1997) and therefore, it is unlikely that this emission is coming from cavity gas which has been compressed by a factor of 500 from the ambient 104 cm-3. Rather, it is much more likely that the primary jet itself is has an intrinsically high density or that dense gas in the protostellar disk or envelope is being entrained by the primary jet. While the FWHM of the dense SiO =5–4 jet is 0.8′′, the CO =2–1 jet was seen to be somewhat broader at 1.5′′ near the protostar and increasing up to 3′′ further out, and with a density of 105 cm-3, roughly 50 times lower than seen in the SiO (GG99). These results suggest that the jet has an axial structure, with the higher density (106 cm-3) gas close to the axis surrounded by a sheath of less dense gas 105 cm-3.
The Hubble law velocity structure seen in Figure 3 at from the source is predicted from shells driven by wide-angle winds (e.g., Shu et al., 1991; Lee et al., 2001). On the other hand, turbulent entrainment models require an acceleration region near the star followed by a deceleration region (e.g., Raga et al., 1993), and bow shock entrainment models show a broad range of velocities near the bow tips (e.g., Lee et al., 2001); these do not explain the Hubble low shown in Figure 3. The highly-collimated morphology of the SiO =5–4 jet can be explained as an on-axis density enhancement within the -wind type of wide-opening angle wind (Li & Shu, 1996; Shang et al., 2002). Since the wide-angle wind model has large radial velocity component, this will explain the large velocity dispersion observed near the base (at B1 and R1) combined with the jet-like density enhancement, which cannot be explained by any other entrainment models.
The density and velocity structures observed with the SMA suggest that the highly-collimated jet traced by the SiO =5–4 is closely related to the primary jet. In particular, the innermost pair of knots, B1 and R1, have a high density of 106 cm-3, a high temperature of 300–500 K, and a large velocity dispersion of 30 km s-1, and quite plausibly represent the primary jet itself, immediately after being launched from the protostar/disk system.
References
- Bachiller (1996) Bachiller, R. ARA&A, 34, 111
- Bachiller et al. (1987) Bachiller, R., Guilloteau, S., & Kahane, C. 1987, A&A, 173, 324
- Chandler & Richer (2001) Chandler, C. J. & Richer, J. S. 2001, ApJ, 555, 139 (CR01)
- Eislöffel et al. (2003) Eislöffel, J., Froebrich, D., Stanke, T., & McCaughrean, M. J. 2003, ApJ, 595, 259
- Giannini et al. (2001) Giannini, T., Nisini, B., & Lorenzetti, D. 2001, ApJ, 555, 40
- Gibb et al. (2004) Gibb, A. G., Richer, J. S., Chandler, C. J., & Davis, C. J. 2004, ApJ, 603, 198
- Gueth & Gulloteau (1999) Gueth, F. & Guilloteau, S. 1999, A&A, 343, 571 (GG99)
- Ho, Moran, & Lo (2004) Ho, P. T. P., Moran, J. M. & Lo, K. Y. 2004, ApJ, 616, L1
- Hollenbach (1997) Hollenbach, D. 1997, in Proc. IAU Symp. 182, Herbig Haro Flows and the Birth of Low-Mass Stars, eds. B. Reipurth & C. Bertout (Dordreicht: Kluwer), 181
- Lee et al. (2001) Lee, C.-F., Stone, J.M., Ostriker, E.C., & Mundy, L.G. 2001, ApJ, 557, 429
- Li & Shu (1996) Li, Z. Y. & Shu, F. H. 1996, ApJ, 472, 211
- McCaughrean & Andersen (2002) McCaughrean, M. J. & Andersen, M. 2002, A&A, 389, 513
- McCaughrean et al. (1994) McCaughrean, M. J., Rayner, J. T., & Zinnecker, H. 1994, ApJ, 436, L189
- Nisini et al. (2002) Nisini, B., Codella, C., Giannini, T., & Richer, J. S. 2002, A&A, 395, L25
- Raga et al. (1993) Raga, A.C., Cantó, J., Calvet, N., Rodríguez, L.F., & Torrelles, J.M. 1993, A&A, 276, 539
- Shang et al. (2002) Shang, H., Glassgold, A. E., Shu, F. H. & Lizano, S. 2002, ApJ, 564, 853
- Shu et al. (1991) Shu, F.H., Ruden, S.P., Lada, C.J., & Lizano, S. 1991, ApJ, 370, L31
- Wiseman (2001) Wiseman, J. J. 2001, in ASP Conf. Ser. 235, Science with the Atacama Large Millimeter Array, ed. A. Wootten (San Francisco: ASP), 179
| Integrated intensity (K km s-1) | |||||
|---|---|---|---|---|---|
| Offset | knot | =5–4 | =1–0 | I(5–4)/I(1–0) | |
| 12′′ | R3 | 342.914.4 | 148.68.3 | 2.310.16 | |
| 1′′ | R1 | 232.414.4 | 23.98.3 | 9.723.43 | |
| 1′′ | B1 | 189.913.4 | 22.5 | 8.44 | |
| 13′′ | B4 | 163.813.4 | 101.97.5 | 1.670.18 | |