Spatially-resolved mid-infrared spectroscopy of NGC 1068: the nature and distribution of the nuclear material
Abstract
We present spatially-resolved, near-diffraction-limited 10 m spectra of the nucleus of the Seyfert 2 galaxy NGC 1068, obtained with Michelle, the mid-IR imager and spectrometer on the 8.1 m Gemini North telescope. The spectra cover the nucleus and the central 6.0″ 0.4″ of the ionization cones at a spatial resolution of approximately 0.4″ (30 parsecs). The spectra extracted in 0.4″ steps along the slit reveal striking variations in continuum slope, silicate feature profile and depth, and fine structure line fluxes on subarcsecond scales, illustrating in unprecedented detail the complexity of the circumnuclear regions of this galaxy at mid-IR wavelengths. A comparison of photometry in various apertures reveals two distinct components: a compact (radius 15 pc), bright source within the central 0.4″ 0.4″ and extended, lower brightness emission. We identify the compact source with the AGN obscuring torus, and the diffuse component with the AGN-heated dust in the ionization cones. While the torus emission dominates the flux observed in the near-IR, the mid-IR flux measured with apertures larger than about 1″ is dominated instead by the dust emission from the ionization cones; in spite of its higher brightness, the torus contributes less than 30% of the 11.6 m flux contained in the central 1.2″ region. Many previous attempts to determine the torus spectral energy distribution are thus likely to be significantly affected by contamination from the extended emission. The observed spectrum of the compact source is compared with clumpy torus models, the first detailed comparison of such models with observational data. The models require most of the mid-IR emitting clouds to be located within a few parsecs of the central engine, in good agreement with recent mid-IR interferometric observations. We also present a UKIRT/CGS4 5 m spectrum covering the R(0) – R(4) lines of the fundamental vibration-rotation band of 12CO. None of these lines was detected, and we discuss these non-detections in terms of the filling factor and composition of the nuclear clouds.
1 Introduction
The advent of the unified model of active galactic nuclei (AGN; e.g. Antonucci, 1993), with its torus of dusty material, helped make sense of many of the observed properties of the numerous classes of active galaxy, but has brought with it its own set of challenges. An intense modeling effort has been under way with the aim of understanding and predicting the emission from dusty tori and explaining the observational data (Pier & Krolik, 1992, 1993; Granato & Danese, 1994; Efstathiou et al., 1995; Manske et al., 1998; Nenkova et al., 2002; van Bemmel & Dullemond, 2003; Schartmann et al., 2005), and with some success in matching the gross infrared properties of AGN, but several observations have proven particularly difficult to reproduce. Especially problematic have been the width of the IR spectral energy distributions (SEDs), the similarity of the observed SEDs given the wide range of variation in X-ray column densities, and, most notoriously, the behavior of the 9.7 m silicate feature. While the feature is commonly seen in absorption in type 2 objects (Roche et al., 1991; Siebenmorgen et al., 2004), the corresponding emission feature expected for type 1 objects has to date only been detected in a handful of objects, mostly QSOs (Hao et al., 2005; Siebenmorgen et al., 2005; Sturm et al., 2005). Torus models must therefore be capable of producing a silicate feature in type 2 AGN while suppressing it in most type 1 objects.
Recently, progress has been made towards overcoming some of these problems. For instance, using a model in which the dust is contained in discrete clouds, thought to be necessary to ensure dust survival in the harsh AGN environment, Nenkova et al. (2002) were able to construct SEDs broad enough to match typical observed SEDs. In these models, the silicate absorption feature was visible in an edge-on view of the torus but the emission could be greatly weakened in a face-on view. By biasing the grain size distribution to large sizes, van Bemmel & Dullemond (2003) were able to suppress the silicate emission feature, although their models tend to predict larger torus inner radii (10 pc) than recent observational limits (see below). Schartmann et al. (2005) were also able to suppress the silicate emission and fit the mean type 1 SED by introducing different sublimation radii for large and small grains. Given advances such as these, torus models will benefit from high-quality observations against which they can be thoroughly tested.
Recent high spatial resolution observations of several active galaxies at 10 and 20 m, where a torus re-emits a substantial fraction of the radiation incident upon it, indicate that the tori may be very small. For example, the outer diameter of the mid-IR emitting dust associated with the torus has been shown to be no greater than a few parsecs in NGC 1068 and the Circinus galaxy (Jaffe et al., 2004; Packham et al., 2005), and 35 pc in NGC 4151 (Radomski et al., 2003), although cooler dust at larger distances is not ruled out. At the same time, some AGN are also associated with extended mid-IR emission from dust on scales of a few hundred parsecs or larger (Maiolino et al., 1995; Krabbe et al., 2001; Radomski et al., 2002; Gorjian et al., 2004; Siebenmorgen et al., 2004). On moving from large to small apertures, the IR spectrum of an active galaxy will often change from being dominated by PAH emission bands to showing a featureless continuum or silicate absorption feature (Le Floc’h et al., 2001; Soifer et al., 2002; Siebenmorgen et al., 2004). Where the AGN component can be spectrally isolated from large-aperture data, the expected clear dichotomy in hard X-ray/mid-IR flux ratios between types 1 and 2 AGN is not observed, perhaps because dust heated by the nuclear source but not associated with the torus itself is contributing to the mid-IR flux (Lutz et al., 2004a). It is therefore clear that observations at the highest possible spatial resolution will be necessary to disentangle the torus and extended emission and provide a fair test for models of the dusty torus.
As one of the nearest, brightest and best-studied AGN, the archetypal Seyfert 2 galaxy, NGC 1068 (14.4 Mpc distant for ; 1″ = 72 pc), is an excellent candidate for mid-IR observations at high spatial resolution. The existence of a hidden broad line region in NGC 1068, as revealed by the broad emission lines detected in polarized light (Antonucci & Miller, 1985), along with evidence for high extinction along our line of sight, strongly suggests the presence of obscuring dust in a toroidal geometry. Further evidence for a torus comes from the strong nuclear mid-IR source coupled with emission from ionized gas extended in a roughly conical structure oriented approximately northeast - southwest (e.g. Macchetto et al., 1994). Modeling of 10 m interferometric observations of the nucleus suggests a hot, compact (1 pc) structure, surrounded by a more extended (approx. 23 pc) warm component, interpreted as dust in the hot inner wall of the torus (Jaffe et al., 2004). Larger-scale 10 and 20 m emission from NGC 1068 is observed to extend out from the central source to the northeast and southwest (Braatz et al., 1993; Cameron et al., 1993; Alloin et al., 2000; Galliano et al., 2005); further out, low surface brightness mid-IR emission is detected from a ring of star formation located at kiloparsec distances from the nucleus (Telesco & Decher, 1988).
The 9.7 m silicate feature is seen in absorption in NGC 1068 (Roche et al., 1984; Jaffe et al., 2004; Siebenmorgen et al., 2004; Rhee & Larkin, 2005). Previous narrow-band imaging suggests that the depth of the absorption varies over the nuclear region (Bock et al., 2000; Galliano et al., 2003), but the spatial coverage and spectral resolution of those studies has been insufficient to allow detailed conclusions about the distribution and profile of the feature to be drawn. We have therefore performed spatially resolved N band spectroscopy of the nucleus and ionization cones of NGC 1068 with Michelle, the mid-IR imager and spectrometer on the 8.1 m Gemini North telescope. The spatial resolution of the spectra, approximately 0.4″, allows us to separate the nuclear and extended emission regions and reveals the distribution of the silicate feature across the nuclear region. Having largely isolated the spectrum of the torus in the spectrum of the central 0.40.4″ ( 3030 pc) of NGC 1068, we compare it with the clumpy torus model of Nenkova et al. (2002). The data set also allows us to examine the detailed spatial distribution of fine structure emission lines in the 10 m region, which have been reported previously only in very large aperture ISO measurements (Lutz et al., 2000) or in few-arcsecond aperture ground-based spectroscopy (Siebenmorgen et al., 2004).
In §2 we describe the observations and reduction of the data, while §3 presents the results obtained for the acquisition images, nuclear spectra and model comparison, extended silicate feature and emission lines. We also report the results of a sensitive search at 5 m for CO lines towards the nucleus of NGC 1068, which serves as a probe of the nature and distribution of molecular gas near the center of this galaxy. The implications of this work are discussed in §4 and summarized in §5.
2 Observations and data reduction
2.1 N-band spectroscopy
N-band acquisition images and spectra of the nucleus of NGC 1068 were obtained during commissioning of Michelle (Glasse et al., 1997) on Gemini North. Observations were performed on UT 2004 August 10 (epoch 1) and repeated on 2005 January 31 (epoch 2). In each case the 2-pixel (0.4″) wide slit, oriented at 20 east of north, was used together with the lowN grating, resulting in a dispersion of 0.024 m/pixel and R200. Observations were made using a standard chop-nod technique to remove time-variable sky background, telescope thermal emission and to reduce the effect of 1/f noise from the array/electronics. The chop throw was 15, fixed at 20 east of north, and the target was nodded the same amount along the slit. Extended emission has been detected at 15″ from the nucleus, but its surface brightness (usually 10 mJy/arcsec2; Telesco & Decher, 1988) is negligible compared to that of the region from which spectra were extracted. As fast tip/tilt guiding is possible in only the on-source beam, the data used were on-source only and the quoted exposure times are for the on-source data.
In both epochs we obtained acquisition images with on-source integration times of 4 seconds through the Si-5 11.6m filter ( = 1.1m, 50 cut-on/off). In spectroscopic mode, on-source integration times were 1043 s for the first epoch and 680 s for the second. The plate scale of Michelle is 0.099″/pixel in imaging mode and 0.198″/pixel in spectroscopic mode. The weather was good for both epochs and the FWHM of the standard star was measured to be 0.35″ on the first and 0.43″ on the second. The diffraction limit (1.22/D) of the telescope at the cut-on of the Si-5 filter is 0.34″.
The orientation of the slit on the galaxy, and the area from which spectra were extracted, are shown in Fig. 1. The figure illustrates that the slit was aligned to the peak brightness of NGC 1068 to better than 0.1″ on the second epoch and to around 0.2″ on the first, with the difference attributable to slight pointing errors during instrument commissioning. To investigate the possibility that the object drifted out of the spectroscopic slit during the observation, due to effects such as guiding errors or differential refraction between the optical guide camera and the mid-IR science beam, we split the observation into several sections and measured the peak emission in each. The counts changed by 6% and 10% on the first and second nights respectively, typical of MIR photometric variations (e.g. Radomski et al., 2002; Packham et al., 2005), implying that any drifts in guiding were less than 0.1″.
Michelle data files contain planes consisting of the difference for each chopped pair for each nod-set. Using the Gemini IRAF package, these difference images were combined until a single frame was created. During this process the chopped pairs were examined to identify any obviously compromised by anomalously high background, electronic noise, or other problems; it was not judged necessary to exclude any frames from the final images. Finally, the resultant image was divided by a spectroscopic flat field. The spectra were extracted in 0.4″ sections (2 pixels along the slit in spectroscopic mode, corresponding well to the average seeing disc over the two epochs), covering the central few arcseconds of NGC 1068, stepping outwards from an aperture centered on the flux peak. Michelle spectra show a slight ( 1 pixel) curvature across the array, which was measured using the standard star data and the resulting apertures used in extracting the NGC 1068 spectra. The spectra were wavelength calibrated to an accuracy of 0.02 m using the telluric absorption lines present in the peak NGC 1068 spectrum, and then divided by the standard star (BS 1101, F9V) and multiplied by a 6000 K blackbody curve.
Cancellation of the deep telluric O3 band in the spectra extracted at distances 4 pixels (0.8″) from the nucleus was poor, so a spectrum of the O3 feature (derived from the standard star spectra set to zero outside the band) was added back into the star spectra in varying amounts and these “composite” star spectra used to divide out the telluric band in those NGC 1068 spectra. The scaling of the O3 band in the star spectra was determined by comparing the depth of the resulting, ratioed NGC 1068 spectra at 9.7 m with that of a spline fit to the ratioed NGC 1068 spectra, with the 9.3-10.0 m region excluded from the fit.
Flux calibration was achieved through comparison with BS 1101, whose N band magnitude was taken to be 2.9111www.gemini.edu/sciops/instruments/michelle/MichSpecStd.html. The resulting spectral flux densities are expected to be accurate to about 20%. The calibration agreed to within 40% between the two epochs, with the second epoch’s data being higher in flux and thus closer to other small-aperture measurements in the literature (Tomono et al., 2001; Jaffe et al., 2004). The difference in flux between the two epochs is probably mainly due to the small difference in the positioning of the slit.
Fine structure line emission by the [Ar III]+[M VII] blend at 8.99 m, [S IV] at 10.51 m, and [Ne II] at 12.81 m (rest wavelengths) was readily apparent out to several arcseconds from the nucleus. Line fluxes were computed from the averages of 4-6 data points centered on each of the line wavelengths and five continuum points on either side of each line. The uncertainty in the derived line fluxes is expected to be small except very near the center, where line-to-continuum ratios are very low and systematic errors dominate (particularly in deriving the [Ne II] flux at the edge of the N band window). Apart from these lines, no other narrow spectral features are apparent in the reduced spectra.
Slit losses were estimated from the profile of the star along the slit (which was assumed to be circularly symmetric) to be 50% on both nights. The spatial distributions of all three fine structure lines appear to be fairly smooth, with no major contributions from pointlike sources, so to correct for systematic overestimates in fluxes resulting from slit losses in the standard star spectrum used for flux calibration, measured line fluxes at all slit positions were multiplied by a factor of 0.5. At positions 6 pixels from the peak, the continuum flux also approaches a smooth spatial distribution, whereas at the nucleus it appears dominated by a pointlike source (although somewhat smoothed by small tracking errors, differential refraction etc. during the long integration). No correction for slit losses has been applied to the continuum flux density, but the effect of any correction would be to increase the degree to which it is concentrated on the nucleus.
2.2 M-band spectroscopy
A high resolution M-band spectrum of NGC 1068 was obtained at UKIRT on UT 1998 December 29. The spectrum was acquired with the facility instrument, CGS4 (Mountain et al., 1990), using its 31 l/mm echelle. The slit width was 0.9″ and the velocity resolution was 20 km/s (R=15,000). The total exposure time was 18.7 minutes. The spectrum of NGC 1068 was ratioed by the spectrum of HR 804 (A3V), which was observed both before and after NGC 1068 in order to provide a precise airmass match. The pressure-broadened Pf beta line in HR 804 produces a broad emission bump in the ratioed spectrum, centered at 4.654 m; this was removed by dividing by a heavily smoothed (Gaussian FWHM = 300 km/s) version of the ratioed spectrum.
3 Results
3.1 The acquisition images
The 11.6 m acquisition images (Fig. 1), taken to assist in positioning the nucleus in the slit, reveal features similar to those detected in previous high spatial resolution mid-IR imaging of NGC 1068. As shown by Tomono et al. (2001), NGC 1068 is initially extended in a roughly north-south direction centered on the nucleus. The northerly extension is at a position angle (PA) of 14 within 0.5″, turning easterly to a PA of 20 around 1″ from the nucleus. The southern extension is at a PA of 190 at 0.5″ from the nucleus, bending westerly further from the nucleus. The features described above agree well with those in the literature, especially those described by Bock et al. (2000), Tomono et al. (2001) and Galliano et al. (2005).
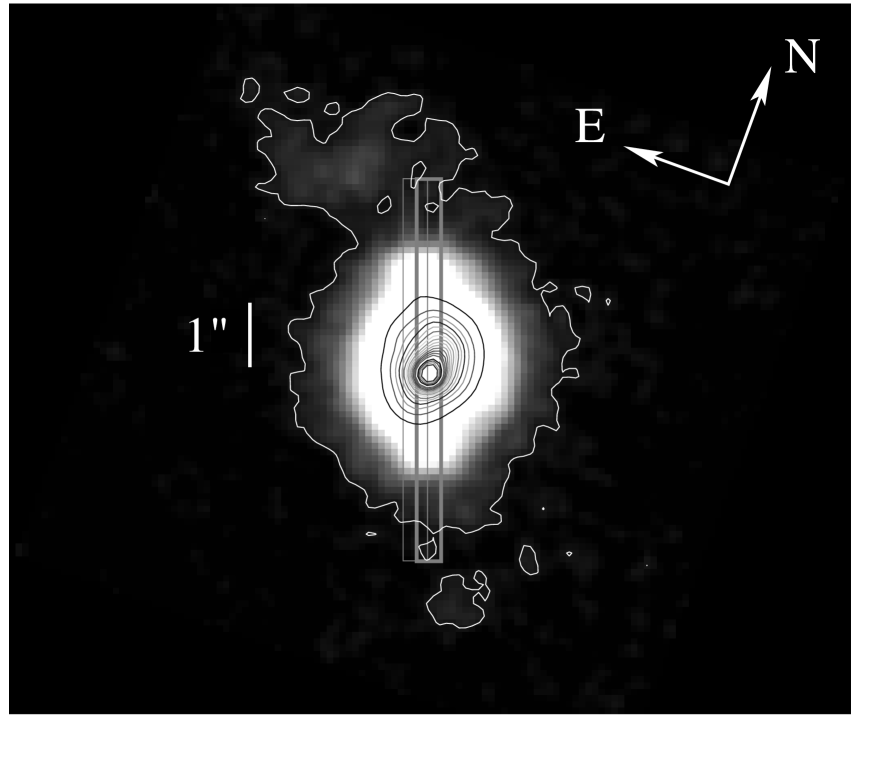
Northeast of the nucleus, at around PA=35 and 1.8″ and 3.7″ from the nucleus, extended knots of emission previously detected by Alloin et al. (2000) are observed. However, in our higher spatial resolution data, we also resolve a low surface brightness south-southwestern knot of emission just under 4″ from the nucleus at PA=205°, also recently detected by Galliano et al. (2005). The approximate centers of the northeastern and south-southwestern knots are located close to a line running radially through the nucleus. The mid-IR extensions are enclosed within the near-IR polarization structures observed both north and south of the nucleus by Packham et al. (1997), who interpreted the structure as scattering from electrons within the ionization cones. Clearly the 20 position angle of the slit closely matches the orientation of the regions of extended emission 1″ from the nucleus described above.
| Aperture diameter | Flux density 11Flux calibration is expected to be accurate to around 15%, as is typical at mid-IR wavelengths (Packham et al., 2005; Radomski et al., 2003). | Brightness |
|---|---|---|
| (arcsec) | (Jy) | (Jy arcsec-2) |
| 0.4 | 8.7 | 54 |
| 1.2 | 30 | 21 |
| 1.8 | 39 | 12 |
| 2.0 | 40 | 10 |
| 4.0 | 46 | 2.9 |
| 8.9 | 48 | 0.61 |
In the Gemini images the central core is resolved in the direction along the ionization cones (PA20°), with FWHM0.5″, but is unresolved perpendicular to the cones. This implies a deconvolved extent of 0.3″ along the cones and 0.2″ perpendicular. That is similar to the size derived by Tomono et al. (2001) from deconvolution of Subaru images. Table 1 lists the flux density measured in various apertures together with the corresponding beam-averaged surface brightness . At the 14.4 Mpc distance to NGC 1068, the observations cover dust emission within radial distances from 15 pc to 300 pc around the nucleus. The results are in good agreement with the findings of Jaffe et al. (2004), whose reported flux density for a 0.4″ aperture is 12 Jy, with a scatter between 11 Jy and 13.5 Jy.
Together, the observations reveal the presence of two distinct emission components: low-brightness emission from dust in the ionization cones extending to hundreds of pc, and bright emission from a central compact source, identified as the AGN obscuring torus by Jaffe et al. (2004). The torus is resolved by the interferometric observations, which show that its mid-IR size is 3pc (0.04″), much smaller than our angular resolution. Therefore in our observations the torus is effectively a point source within the central 0.4″ diameter region. However, because the brightness of this region is much higher than that of the surrounding area, its spectrum is dominated by the torus flux. Indeed, the mean color temperature estimated from our flux densities at 8 m and 13 m in the central spectrum (§3.2) is 330 K, in good agreement with Jaffe et al. (2004). On the other hand, the flux collected by the larger apertures is dominated by the ionization cones’ lower surface brightness diffuse emission. For example, in 1.2″ and 4″ diameter apertures centered on the nucleus, the core contributes less than 30% and 20%, respectively, of the total flux. The extended dust emission from the ionization cones was previously noted by Alloin et al. (2000) and Bock et al. (2000), and our observations clarify the relative importance of the flux from the torus and the cones. Like previous high spatial resolution mid-IR imaging studies, our images show no evidence for mid-IR emission extending several tenths of an arcsecond east and west of the nucleus, as reported by Marco & Alloin (2000) at L and M.
3.2 The mid-IR spectra
Spectra of the nucleus and ionization cones of NGC 1068, extracted in 0.4″ steps (as described in §2), are shown in Fig. 2 for both epochs. All of the spectra consist of a strong dust continuum upon which a broad silicate absorption feature and narrow fine structure lines are present. At each slit position the shapes of the two spectra are similar, showing broadly similar changes in spectral slope and silicate depth with distance from the nucleus. The relative weakness of the epoch 1 spectrum on the nucleus results from the slit on that date being slightly offset from the peak of the emission which, unlike the emission from the ionization cones, is unresolved in the east-west direction. Fig. 3 highlights the good agreement of the profiles of the two central spectra.

The depth of the silicate absorption feature is an important parameter in modeling of the spectral energy distribution (SED) of AGN and hence has been studied in detail for NGC 1068 and several other AGN (Roche et al., 1991; Siebenmorgen et al., 2004). However, most previous MIR observations of AGN have lacked the spatial and/or spectral resolution to probe the nucleus with minimal contamination from the surrounding MIR-emitting regions. The observations presented here accomplish this and also provide the opportunity to spectroscopically study the extended silicate feature along the ionization cones of NGC 1068, as well as the emission lines within the cones.
We quantify the depth of the observed silicate feature using . This quantity would be the 9.7 m optical depth of an absorbing screen in front of a background source when the screen emission is negligible. In realistic configurations the relation of to actual optical thickness is more complex, but it is still a meaningful phenomenological indicator. To estimate the 9.7 m continuum we interpolated between the median of the spectrum near 8.2 and 12.4 m, wavelengths chosen to be outside the silicate feature as far as possible without including regions of poor telluric cancellation or the 12.8 m [Ne II] emission line. The procedure is equivalent to fitting a linear continuum to the spectra; the limited wavelength extent of the N-band atmospheric window, only slightly wider than the silicate feature itself, makes determination of the true underlying continuum shape difficult, but we believe that this simple approach is at least indicative. 1 uncertainties were estimated from the scatter of the data points around 8.2, 9.7 and 12.4 m used in the calculation of .
It has been pointed out by many authors that PAH emission features on the short and long wavelength sides of the silicate absorption feature (8.6 and 11.3 m) can serve to exaggerate the depth of the feature, particularly when the spectral resolution is very low and/or spatial resolution is limited. The larger-aperture spectra of Le Floc’h et al. (2001) and Siebenmorgen et al. (2004) show no evidence of the PAH features, but by themselves cannot rule out contributions by PAHs in regions as small as the Gemini/Michelle slit segments. In the high spatial resolution R200 Michelle spectra presented here, however, there is no indication, in any of the spectra, of the PAH features, in particular of the 11.3 m band, which would be easily recognized at this resolving power. The absence of PAH emission simplifies estimates of . However, the peak of the silicate band unfortunately coincides with the broad atmospheric O3 absorption band centered at 9.6 m, which limits the accuracy of , particularly in spectra far from the nucleus.
In the following sections, we discuss in detail the continuum slope, the silicate absorption at the nucleus, the more extended silicate feature, and the emission lines. We assume throughout that the brightest mid-IR continuum point marks the buried central engine of NGC 1068.

3.2.1 Continuum slope
The slope of the continuum is markedly different within about 0.4″ of the nucleus than at larger distances. Although there is some variation outside this region, at all of the outer slit positions the continuum increases strongly to longer wavelengths. In the central three spectra, however, the spectral slope in is significantly less steep, with the bluest continuum seen at the nucleus. The color temperature of the mid-IR emitting dust, as estimated from the difference in flux densities at 8 m and 13 m in the central spectrum, is 330 K in the core (as noted above), whereas the dust temperature is typically 275 K for distances of 0.8″ and greater. Note that although the radio emission to the northeast of the nucleus is attributed to synchrotron emission with (in places) a fairly flat spectrum (Gallimore et al., 1996b), the integrated 5 GHz flux density in a 1″.5 x 1″.9 beam, about 600 mJy (Gallimore et al., 1996a), can only account for a small fraction of the observed mid-IR emission (see also Villar-Martín et al., 2001).
3.2.2 The nuclear silicate absorption feature
In the Michelle spectra of the central 0.4″ core (Fig. 3), for epoch 1 and for epoch 2. The N-band spectrum of NGC 1068 has also been measured by Jaffe et al. (2004) in a 0.4″ slit and by Rhee & Larkin (2005) in a 0.25″ 0.25″ aperture (Fig. 3). We estimate for the total flux spectrum of Jaffe et al. (2004), in rough agreement with the results presented here, although their spectrum has a somewhat shallower decline towards shorter wavelengths than ours. The Rhee & Larkin (2005) data bear a close resemblance to the Michelle spectra.

To gain insight into the dust distribution in the central 0.4″ ( 30pc) of NGC 1068, we compare the nuclear spectrum with the models of Nenkova et al. (2002), who consider radiative transfer in clumpy distributions of material. In these models the angular distribution of the clouds is a Gaussian centered on the equatorial plane. The clouds follow a power law distribution in radius, , with number declining as . The emergent emission, calculated for all viewing angles, is a function of , the average number of clouds along an equatorial radius, and , the optical depth per cloud in the band. In fitting the models to the data, we characterize the continuum spectra in terms of three quantities: , the dimensionless slope from 8.0-9.0 m, , the dimensionless slope from 11.0-12.5 m, and , the ratio of flux densities at 8 and 12 m. We considered a coarse grid of and . All the model slopes tend to be steeper for smaller values of . For a given value of , the slopes exhibit small (%) variations with viewing angle. The variation in slope is more strongly correlated with , changing by % when changes by 5. Scaling a model to the observed flux determines the intrinsic AGN luminosity, .
In fitting the nuclear spectrum, we require inclination angle or , as indicated by water masers (Greenhill & Gwinn, 1997). With this constraint, we find (Fig. 4). In nearly all of the preferred models, or 3, and . The best-fitting model parameters are , , and . For , a range of from 5 to 10 fits well, generally with . The best models have , with . The cloud distribution is compact in these larger models. Such a small region is consistent with high-resolution mid-IR images (Bock et al., 2000; Tomono et al., 2001; Galliano et al., 2005) and interferometry (Jaffe et al., 2004) that show almost no extended emission in the presumed torus mid-plane. For the intrinsic AGN luminosity we find .
We specifically avoided fitting the silicate feature itself, and the resulting models do not reproduce its shape well. The resulting discrepancy is likely due at least in part to limitations of the current models. Also, the theoretical spectra account only for the torus’s emission, but foreground absorption and contamination from extended sources within the aperture may alter the observed spectrum.
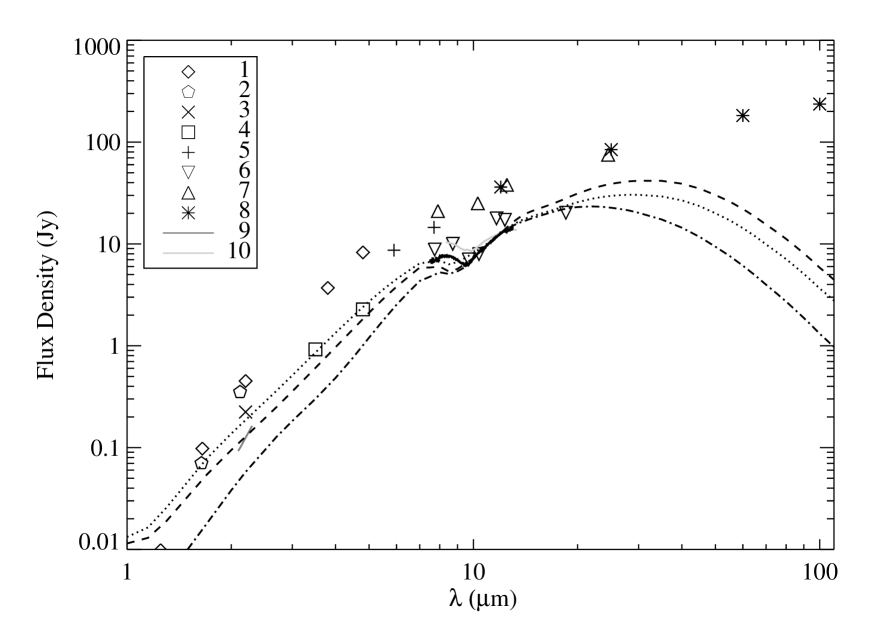
Fig. 5 shows the models from Fig. 4 along with the broader SED of NGC 1068 compiled from published results. The models are plotted with the same scaling as in Figure 4 . Most of the measurements do not isolate the AGN and instead include a significant contribution from the larger galaxy. Systematically lower fluxes, which are more similar to the models, are observed only at the highest spatial resolution. As already shown in Table 1, much of the observed mid-infrared flux of NGC 1068 is not due to the active nucleus alone, even on sub-arcsecond scales.
3.2.3 The silicate feature in the ionization cones
The complexity of the MIR emission from the ionization cones is immediately apparent from Figures 2 and 6, in which neighboring spectra often exhibit significant variations in spectral slope and silicate feature profile and depth, at positions both adjacent to and more distant from the center. Smaller differences between the spectra taken at the two epochs can also be seen. We attribute these to the slight differences in seeing and slit positioning between the two data sets, which therefore do not sample identical regions of the complex and structured extended MIR emission.
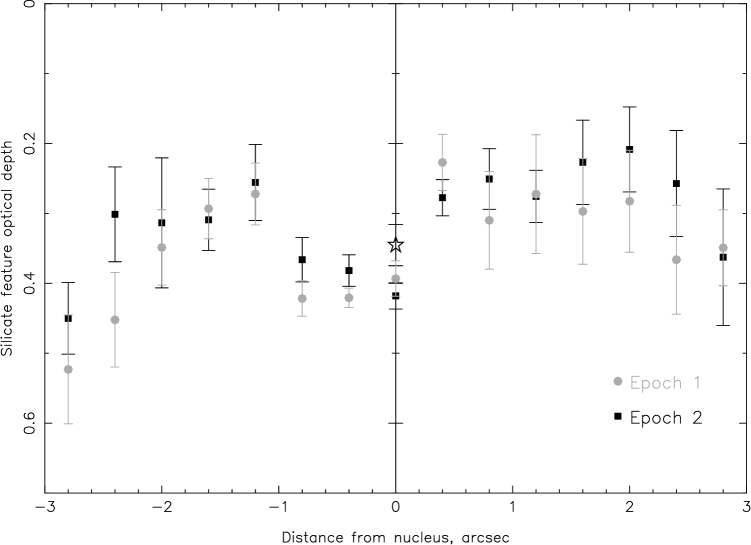
Probably the most striking finding is the strong asymmetry in the spatial distribution of the silicate ”optical depth” close to the nucleus (Fig. 6). The largest values of occur 0–1″ south-southwest (SSW) of the central compact source. This finding is consistent with observations of optical and near-IR line and continuum emission (e.g. Macchetto et al., 1994; Bruhweiler et al., 2001; Thompson et al., 2001), both of which are much fainter to the south of the nucleus, suggesting increased extinction to this region. Further support for this interpretation comes from the increase in near-IR polarized flux to the SSW, interpreted as additional scattering in that area (Young et al., 1996; Packham et al., 1997; Simpson et al., 2002). On the whole, this picture is consistent with the dusty disk of the host galaxy, which is inclined at 29°(García-Gómez et al., 2002), screening the southern but not the northern ionization cone, as suggested by a number of authors (e.g. Packham et al., 1997; Bock et al., 1998; Kraemer & Crenshaw, 2000; Young et al., 2001).
We emphasize, however, that this conclusion could not have been drawn from alone. The complexity revealed by the observations, and the likely clumpiness of the dust (§4.1), make it difficult to extract physical parameters in a meaningful way. The common interpretation in terms of an absorbing screen in front of a background source ignores the screen emission, becoming meaningless when optical depths are large. The temperature of an externally heated optically thick dust cloud varies considerably over its surface, and the depth of the absorption feature emerging from its dark side is not a reliable indicator of optical depth (Nenkova, Sirocky, Ivezić & Elitzur 2005, in preparation). The spectra shown in figures 4 and 5 were calculated with models in which the clouds’ overall optical depth varied from 160 to 300 at V, yet they produce a feature with of only . The patchy structure found in both the shape and depth of the silicate feature can be produced by many different combinations of clouds and background continuum. The current observations do not provide the means for a unique interpretation.
The profile of the silicate feature off the nucleus, especially to the north, deserves some comment. The spectra display clear signs of absorption but the shape of the feature is quite distinct from that of the typical diffuse ISM absorption band, which commences close to 8 m and extends to 12.5 m (e.g. Kemper et al., 2004; Chiar & Tielens, 2005). In Fig. 2, the feature has almost reached the continuum level by 11 m in many of the spectra. Spectral profiles similar to those observed from 1.2 - 2.0″ NNE have also been found in spectra of embedded YSOs, and interpreted as a combination of absorption and emission in the line of sight (Kessler-Silacci et al., 2005, see for instance IRAS 04295+2251 in their Fig. 1). This may suggest that the spectral shapes observed in the ionization cones of NGC 1068 indicate components of both absorption and emission from those regions.
In the Gemini data, the overall value of (i.e., obtained from the sum of all spectra within 3″) is 0.350.03. This is slightly lower than the values in the nuclear spectra. The overall value is also somewhat less than that in the spectrum of Siebenmorgen et al. (2004) using a 3″ slit of unspecified orientation; employing the same methodology as that used for our silicate absorption depth estimates, we measure from their Fig. 14. Aitken et al. (1984) and Roche et al. (1984) observed NGC 1068 with beam sizes of 4 - 6″ and estimated . Thus there may be a moderate difference in between these measurements and our summed spectrum. This could perhaps be accounted for if stronger silicate absorption is found in regions outside of the 0.4″ slit; if, for example, silicate emission from the ionization cones fills in the absorption feature in the narrow slit.
The spatially-resolved mid-IR SED within 1″ of the mid-IR flux peak was previously examined by Bock et al. (2000) and Galliano et al. (2003) using imaging in four and seven narrow-band filters respectively. While Bock et al. (2000) detected prominent silicate absorption in the core and at a position 0.4″ south, and little absorption to the north, Galliano et al. (2003) found silicate absorption increasing with distance from the nucleus to the northeast, with the feature in emission to the southwest. Thus, the behavior of the silicate feature has until now been unclear. The findings of Bock et al. (2000) are in fair agreement with Figures 2 and 6. Contrary to Galliano et al. (2003), neither we nor Bock et al. (2000) observe silicate emission at positions south of the nucleus, finding instead that the region within 1″ of the nucleus has stronger absorption at the flux peak and to the south than to the north. Similar results have recently been reported by Rhee & Larkin (2005). While the maximum in our epoch 2 data is reached on the nucleus itself, a feature of comparable depth is observed at 0.4 and 0.8″ SSW of the center in the epoch 1 spectra. The silicate feature strength is fairly uniform at in the northern ionization cone, and at 1.2-2.0″ SSW of the flux peak, in both sets of data falls to similar values to that observed to the NNE.
3.2.4 The emission lines.
The [Ar III]+[Mg VII], [S IV], and [Ne II] line fluxes measured along the slit are listed in Table 2 and plotted in Fig. 7. As can be seen in the figure, although there are some differences between them, all three are of fairly similar brightness at their peak (to within a factor of two) and fall off rapidly to either side. The figure also shows that the mid-infrared continuum is considerably more sharply concentrated toward the nucleus than is the line emission. None of the fine structure line fluxes peaks at the nucleus.

Relative to the continuum peak there is a clear offset of 0.2″ in the centroids of the fluxes of all of the fine structure lines relative to the centroid of the continuum. This offset is to the north-northeast, and is the direction expected based on the trends in extinction as a function of position (see §3.2.3). In addition, all three line fluxes peak 0.4″ NNE of the center. Correcting the measured line fluxes for extinction at each position along the slit based on would result in more symmetric distributions about the nucleus for all three lines. However, variations in extinction cannot entirely explain the spatial distributions of the relative fluxes of the three lines. For example, close to the center the large asymmetry in the [Ne II] line flux at 0.4″ NNE compared to 0.4″ SSW will be much less extinction-corrected than the asymmetries of the other lines, whose wavelengths are closer to the peak of the silicate absorption. Thus other effects such as variable excitation or an asymmetric distribution of material must also contribute to the offset between the continuum and emission line peaks. These may be related to narrow line clouds B and/or C (Evans et al., 1991), located about 0.1-0.4″ north of the nucleus and suggested to be responsible for the observed bend in the radio jet close to that position (Gallimore et al., 1996b; Galliano et al., 2003).
| NNE Offset | [Ar III + Mg VII] 9.0 m | [S IV] 10.5 m | [Ne II] 12.8 m | Continuum 11m |
|---|---|---|---|---|
| (arcsec) | () | () | () | () |
| Epoch 1: | ||||
| 2.8 | 0.09 | 0.17 | 0.14 | 1.59e-15 |
| 2.4 | 0.10 | 0.21 | 0.21 | 2.83e-15 |
| 2.0 | 0.21 | 0.45 | 0.29 | 6.47e-15 |
| 1.6 | 0.30 | 0.71 | 0.59 | 1.11e-14 |
| 1.2 | 0.53 | 1.15 | 1.31 | 2.73e-14 |
| 0.8 | 1.60 | 2.75 | 2.55 | 8.45e-14 |
| 0.4 | 2.35 | 3.50 | 3.10 | 1.85e-13 |
| 0.0 | 1.40 | 3.25 | 1.31 | 2.44e-13 |
| -0.4 | 0.63 | 2.15 | 0.54 | 8.24e-14 |
| -0.8 | 0.27 | 0.89 | 0.51 | 1.93e-14 |
| -1.2 | 0.22 | 0.85 | 0.39 | 8.6 e-15 |
| -1.6 | 0.22 | 0.96 | 0.27 | 5.5 e-15 |
| -2.0 | 0.08 | 0.36 | 0.26 | 2.5 e-15 |
| -2.4 | 0.06 | 0.15 | 0.25 | 1.80e-15 |
| -2.8 | 0.05 | 0.18 | 0.17 | 1.4 e-15 |
| Epoch 2: | ||||
| 2.8 | 0.05 | 0.15 | 0.15 | 1.39e-15 |
| 2.4 | 0.07 | 0.27 | 0.16 | 2.65e-15 |
| 2.0 | 0.22 | 0.55 | 0.40 | 6.93e-15 |
| 1.6 | 0.29 | 0.81 | 0.59 | 1.13e-14 |
| 1.2 | 0.42 | 1.18 | 1.15 | 2.23e-14 |
| 0.8 | 1.05 | 2.30 | 2.45 | 6.16e-14 |
| 0.4 | 1.25 | 2.60 | 3.40 | 1.45e-13 |
| 0.0 | 1.05 | 1.85 | 2.15 | 2.44e-13 |
| -0.4 | 0.56 | 1.45 | 0.80 | 7.43e-14 |
| -0.8 | 0.24 | 0.86 | 0.42 | 1.61e-14 |
| -1.2 | 0.28 | 0.89 | 0.39 | 7.25e-15 |
| -1.6 | 0.20 | 0.69 | 0.20 | 4.48e-15 |
| -2.0 | 0.08 | 0.23 | 0.17 | 2.00e-15 |
| -2.4 | 0.08 | 0.12 | 0.19 | 1.48e-15 |
| -2.8 | 0.05 | 0.12 | 0.15 | 1.20e-15 |
Evidence for variable excitation is also present further from the nucleus. The [Ne II] and [S IV] lines have roughly equal fluxes at their peak, but at distances of 0.4-2″ SSW of the nucleus the [S IV] line is typically 1.5-3 times the strength of each of the other two emission features, which have similar spatial distributions. These differences are too large to be attributed to the changes in extinction.
The extinction explanation is also untenable if the [Ar III] line dominates the flux of the 9.0 m blend because the silicate extinctions at 9.0 m and 10.5 m are similar. However, the [Mg VII] line is expected to contribute significantly to the strength of the 9.0 m feature near the nucleus, as lines of many highly excited species are seen toward the nucleus, including a strong 5.50 m line of [Mg VII] (Lutz et al., 2000). The change in the ratio of the 9.0 m and 10.5 m features can be understood as a consequence of the rapid fall-off of the coronal line flux with distance from the nuclear ionizing source and the increased importance of other ionizing sources such as hot stars. The wavelength of the [Ar III] line (8.991 m)is accurately known and the best estimate for the [Mg VII] line wavelength places it within 0.004 m of the [Ar III] line (Hayward et al., 1996). Thus it will be difficult for higher spectral resolution to separate the contributions of the two lines and indeed the R1500 spectrum of Lutz et al. (2000) does not.
The strength of the 9.0 m blend near the nucleus, roughly half that of the other two lines, also suggests that [Mg VII] (with an ionization potential of 186.5 eV) is a significant and probably dominant contributor to this feature. This inference is based on the observation that in starburst galaxies the [Ar III] line is always at least a factor of four weaker than at least one of the other two lines (Verma et al., 2003). That is understandable because (1) argon is 30 times less abundant than neon and almost an order of magnitude less abundant than sulfur, (2) the fine structure collision strengths for excitation of the [S IV] and [Ar III] transitions’ upper levels are comparable and only several times larger than that for the [Ne II] upper level, and (3) the ionization potential of [Ar III] (27.6 eV), is intermediate between those of [Ne II] (21.6 eV) and [S IV] (34.8 eV).
Comparison of the integrated fluxes of the [Ar III]+[Mg VII], [S IV], and [Ne II] lines along the central 6″ of the 0.4″ Michelle slit with the fluxes measured in the 14″ 20″ slit of the ISO SWS (Lutz et al., 2000) demonstrates that the bulk of the emission line flux detected by ISO SWS comes from the central 1-2 arcseconds. The fluxes detected by Michelle are approximately 28%, 27%, and 18%, respectively, of those detected by ISO SWS. In their 3″ slit, Siebenmorgen et al. (2004) observed 52% of the ISO SWS [S IV] flux. Compared with the 28% that we detect, this suggests that the [S IV] flux is quite diffuse within the ionization cones, as is indeed illustrated by Fig. 7. Both our narrow-slit data and the wider-slit measurements of Siebenmorgen et al. (2004) recover only 20% of the large-aperture [Ne II] flux, consistent with the more centrally-concentrated nature of the nuclear [Ne II] emission shown in Fig. 7 and suggesting that the bulk of the [Ne II] flux detected by ISO arises in more distant regions, such as the kpc-scale starburst ring, not covered by these slits.
3.3 The M-band spectrum
The UKIRT/CGS4 R=15000 M-band spectrum of NGC 1068 is shown in Fig. 8. The spectrum covers a narrow portion of the M window that contains the redshifted R(0) - R(4) lines of the fundamental vibration-rotation band of 12CO. In absorption the R(0) line arises from the lowest lying rotational level, the lower state energies of the other transitions correspond to temperatures of 6 K, 17 K, 33 K, and 55 K above the ground state. In LTE at least some of these lines would be among the strongest CO absorption lines for gas temperatures up to several hundred Kelvins. In dense (105 cm-3) clouds CO should be in near-LTE at these temperatures. In lower density clouds, because spontaneous emission is more rapid than collisional excitation, LTE will not be achieved and most of the CO will be in the lowest one or two rotational levels despite a high gas kinetic temperature (see e.g. Geballe et al., 1999; McCall et al., 2002).

No CO lines are apparent in Fig. 8. The limit per 20 km/s resolution element is typically 3% of the continuum. Lutz et al. (2004b) have published an upper limit of 7% of the continuum for individual lines, based on an R=2500 spectrum obtained using ISO-SWS. The much higher resolution spectrum presented here thus provides a considerably more stringent limit, unless the CO lines are several hundred km/s wide.
As discussed in §4.2, there are several ways of interpreting this upper limit. Here we analyze it in terms of constraining the properties of a foreground screen, although this is surely a naive interpretation. For such an absorber the limit on the CO column density would depend on the CO excitation temperature and the linewidth. For 50 K and 50 km/s, for example, the UKIRT spectrum implies that the total CO column density is less than . Higher temperatures and greater linewidths both increase that upper limit (but only by a factor of about two for 100 K and 100 km/s).
If the CO-containing gas (as well as the associated obscuring dust) is in dense clouds (i.e., clouds into which near-UV radiation cannot penetrate), then almost all of the interstellar carbon is in CO. Assuming that the carbon abundance is roughly solar, one concludes that N(H. For a standard gas-to dust ratio, the corresponding foreground extinction is 0.1 mag. If the obscuring material is entirely in diffuse clouds, then at most only a few percent of the carbon is neutral and the H2 column density and dust extinction can be roughly two orders of magnitude higher.
4 Discussion
4.1 Clumpiness and complex spectral structure in the ionization cones
Perhaps the most striking aspect of these data is the variation in the spectra over small distances (Fig. 2). There is significant structure in the dust and gas in the circumnuclear regions even on subarcsecond scales: the ionization cones of NGC 1068 are as complex in the mid-IR as at shorter wavelengths. This complexity was hinted at in the narrow-band imaging study of Bock et al. (2000) and is evident in the deconvolved 12.8 m image of Galliano et al. (2005), and is made clearer in the present data.
As noted in §3.2.3, the bulk of the mid-IR emission coincident with the ionization cones in NGC 1068 is likely to be thermal emission from warm dust. Any arrangement of the dust proposed to explain the mid-IR emission and silicate feature, however, must also be consistent with certain tight observational constraints. First, the reddening of the northern ionization cone is lower than suggested by the depth of the silicate feature in our spectra. If a foreground screen distribution and standard Galactic dust properties ( and ; Roche & Aitken, 1984, 1985; Whittet, 1992) were assumed, would imply , already somewhat higher than the mean reddening of the northern cone, (for the more obscured blueshifted line components; Kraemer & Crenshaw, 2000). Moreover, as the spectral profile of the silicate feature in the cones may reflect a combination of both emission and absorption, any determination of from in this simple screen model could easily be an underestimate. Second, the UV/optical polarisation mechanism in the central 1″ of NGC 1068 is thought to be electron scattering (Antonucci & Miller, 1985; Miller et al., 1991; Antonucci et al., 1994; Young et al., 1995), mainly on the basis of the wavelength-independent polarization spectrum, but the high efficiency for dust relative to electron scattering (e.g. Kishimoto et al., 2001) suggests that light scattered off electrons in the cones should undergo further, wavelength-dependent scattering off any dust grains in or around the cones.
Arranging the dust in optically thick clumps associated with the NLR clouds, in accordance with the good spatial coincidence of the structures emitting in [O III] and at 12.8 m (Galliano et al., 2005), may circumvent these problems. Gray scattering from such clumps may be able to mimic the wavelength-independent polarization caused by electron scattering (Code & Whitney, 1995; Kishimoto et al., 2001), and the dust would be likely to survive for much longer in this kind of configuration (Laor & Draine, 1993; Villar-Martín et al., 2001). Arranging the dust in clumps could also explain the low reddening of the ionization cones while permitting appreciable silicate absorption, as much of the ionized gas would be expected to lie outside the clumps, which would only have a small covering factor. In this scenario, any emission component in the silicate feature in the cones would result from a view of the hot sides and faces of clumps towards the far edge of the cone. The absorption would then arise in the cooler surfaces of clumps closer to the near edge of the cone, inclined away from the central engine, and in a small amount of foreground dust. The presence of dust clumps was suggested by Galliano et al. (2003) to explain SEDs showing silicate emission in the southern ionization cone (stated to be tilted away from the line of sight and therefore exposing hot clump surfaces to our view), at odds with the present data and Bock et al. (2000). However, the southern cone is also thought to be located behind the disk of the galaxy and subject to increased extinction that may well suppress a silicate emission feature from hot clump faces. Further from the nucleus, on the other hand — around and including the ”northeast knot” first identified by Miller et al. (1991) — both dust and electron scattering are thought to contribute to the polarization (Miller et al., 1991; Packham et al., 1997; Simpson et al., 2002), suggesting the presence of dust other than in clumps.
4.2 The nature and distribution of material close to the nucleus
In fitting both the nuclear 10 m spectrum and the broader IR SED, the clumpy torus models require most of the mid-IR-emitting dust in the torus to exist rather close to the nucleus. In the models with , for example, 90% of the clouds lie within 3 pc of the AGN. This is comparable to the dimensions of the warm dust structure detected by Jaffe et al. (2004) in NGC 1068, and also in agreement with recent imaging data constraining the central IR source to a diameter of a few parsecs or less in several other Seyfert galaxies (Swain et al., 2003; Prieto & Meisenheimer, 2004; Prieto et al., 2005; Packham et al., 2005).
On the other hand, both mid-IR imaging and the torus model predictions imply that substantial additional mid-IR emission arises outside the central source. This is also apparent in the comparison of observational data in different apertures shown in Fig. 5: there is a clear trend for subarcsecond-aperture measurements at wavelengths as short as 3 m to be appreciably lower than larger-aperture ones, even when stellar dilution is taken into account in the 3-5 m data, as in Alonso-Herrero et al. (2001). It is important to note the wavelength dependence of trends among different apertures. In the near-IR, the 1.5″ measurements of Alonso-Herrero et al. (2001) are in good agreement with the high-resolution results of Weigelt et al. (2004) at both H and K bands. The compact emission is known to dominate at these wavelengths, contributing about 80% of the flux in a aperture at K (Weigelt et al., 2004). In the L and M bands, however, the Alonso-Herrero et al. (2001) flux density measurements exceed the compact source by a large factor, and this difference persists in the Bock et al. (2000) 2″-aperture N band measurements. While estimates of the torus emission are known to be unreliable in the far-IR because of the large beams involved, even ground-based mid-IR observations do not usually isolate the AGN contribution.
This is also relevant to the interpretation of the non-detection of CO lines in the M band spectrum: the M-band imaging of Rouan et al. (2004), for example, implies that the aperture used for the CO observations contains emission from much material not directly associated with the torus. We therefore first examine the limiting case in which all of the gas exists in optically thick clouds much smaller than the beam size — such as the torus clouds modeled in §3.2.2 and the NLR clouds proposed in §4.1 — and then go on to consider the constraints the CO non-detection places on the nature and distribution of material both outside and inside those clumps.
If the only molecular material is in optically thick molecular clouds, the upper limit on the CO lines can be interpreted as constraining the filling factor, , of these clouds. The dark sides of individual clouds will be strong CO absorbers, so we assume that the absorption from such clouds removes all the light from the beam at that position. The limit on CO line absorption then implies that the beam filling factor of molecular clouds must be less than 0.03, comparable to the 0.1 quoted by Nenkova et al. (2002) as a reasonable realization of the clumpy torus model. On the other hand, if the entire 5 m continuum source including the torus clouds is obscured in part by cool foreground material, the implications of the non-detection of CO will depend on the nature of that material. As discussed earlier, in dense molecular clouds essentially all of the C is in CO, and the limit on the CO column density in implies much less than a magnitude of visual foreground extinction. In diffuse clouds typically only 1% of the C is in CO, so that the limit can tolerate as much as 5-10 mags of visual foreground extinction.
As noted in §3.2.3, in realistic clumpy dust configurations, however, the relation between and optical depth is not straightforward. Therefore Fig. 6 may not be appropriate for estimating the extinction to the 5 m continuum emitting regions. The of the region covered by the 0.9″ M band slit has been derived from He II line ratios by Kraemer & Crenshaw (2000), who find a mean value of 0.22 to the NNE and values typically 0.3 to the SSW. Using the standard value of , this translates to 0.7-0.9 or more. This is several times greater than the extinction implied by the CO non-detection assuming the foreground material to be molecular in nature, but consistent with the presence of diffuse clouds.
There is further evidence that supports diffuse clouds as the dominant location of the dust: the presence of the 3.4 m absorption feature in the spectrum of the nucleus of NGC 1068 (Wright et al., 1996; Imanishi et al., 1997; Marco & Brooks, 2003; Mason et al., 2004). The 3.4 m absorption feature is believed to be produced by hydrocarbons in refractory dust grains and has not been detected in dense clouds in the Galaxy, but has been seen in numerous diffuse Galactic clouds. The absence of the feature in dense clouds is thought to be at least partly due to the lack of atomic hydrogen available to re-form C–H bonds destroyed by UV photons and cosmic rays (Muñoz Caro et al., 2001; Mennella et al., 2003).
In the Galaxy the ratio of the total extinction to the optical depth of the 3.4 m feature has been measured in a large number of sources (Pendleton et al., 1994; Rawlings et al., 2003). The value of / is 250 in diffuse clouds outside of the Galactic center and 150 toward the Galactic center (where it is believed that roughly one-third of the extinction arises in dense cloud material, making the ratio 100 for diffuse clouds along that sightline). In NGC 1068, the optical depth of the 3.4 m feature is measured to be about 0.1-0.15 (Wright et al., 1996; Imanishi et al., 1997; Marco & Brooks, 2003; Mason et al., 2004). If the visual extinction derived from the He II lines is applicable to the regions producing the 5 m continuum the ratio is 10, and even if one derives an extinction from the ratio is 50. Thus, the 3.4 m feature is far stronger relative to the foreground visual extinction in NGC 1068 than in the Galaxy. These low values suggest that not only the foreground extinction but much of the cloud material, regardless of its location, giving rise to the silicate feature in the central 1″ is diffuse in terms of its chemistry and abundances.
5 Conclusions
N-band near-diffraction-limited observations of the nuclear region of NGC 1068 at the Gemini North telescope show that the complexity of the nuclear region, previously seen in mid-IR imaging and observations at shorter wavelengths, persists in mid-IR spectra. The spectra vary widely on spatial scales of less than 1″, in the slope of the continuum, the strength of the silicate absorption feature, and the fine structure line fluxes. The optical depth of the silicate feature is observed to vary between about 0.2 and 0.45, and the silicate absorption and all three of the [Ar III]+[Mg VII], [S IV] and [Ne II] fine structure features are asymmetrically distributed within 1″ of the center. The relative strengths of the above three emission features imply a strong contribution by the high excitation [Mg VII] line to the blend of that line and [Ar III].
A high spectral resolution UKIRT/CGS4 spectrum of the central 1″ of NGC 1068 shows no evidence for absorption by CO. This upper limit implies either a small filling factor for dense molecular clouds obscuring the nuclear continuum source(s), a predominance of obscuring diffuse cloud material lacking in CO (whose existence also is implied by the interstellar 3.4 m absorption feature seen towards the nucleus), or a combination of the two.
The mid-IR emission from NGC 1068 originates in two distinct components. Emission from the central region with diameter 0.4″ is dominated by the IR - bright obscuring torus. Our observations place an upper limit of 15 pc on the torus radius, in agreement with the compact (3 pc) size determined by mid-IR interferometry. We have been able to obtain good fits with the clumpy torus models of Nenkova et al. (2002) to this nuclear region. Mid-IR emission in apertures larger than 1″ is dominated by a second component, the lower brightness, diffuse emission from the AGN-heated dust in the ionization cones. If NGC 1068 is representative of other sources, the implication is that AGN SEDs are highly uncertain since the torus does not dominate large-aperture photometry at wavelengths longer than the near IR. While this has long been known to be the case for facilities such as ISO and IRAS, our results underline the need for future thermal-IR observations of AGN to be obtained at the highest possible spatial resolution even at mid-IR wavelengths.
References
- Aitken et al. (1984) Aitken, D. K., Briggs, G., Bailey, J. A., Roche, P. F., & Hough, J. H. 1984, Natur, 310, 660
- Alloin et al. (2000) Alloin, D., Pantin, E., Lagage, P. O., & Granato, G. L. 2000, A&AP, 363, 926
- Alonso-Herrero et al. (2001) Alonso-Herrero, A., Quillen, A. C., Simpson, C., Efstathiou, A., & Ward, M. J. 2001, AJ, 121, 1369
- Antonucci (1993) Antonucci, R. 1993, ARA&A, 31, 473
- Antonucci et al. (1994) Antonucci, R., Hurt, T., & Miller, J. 1994, ApJ, 430, 210
- Antonucci & Miller (1985) Antonucci, R. R. J., & Miller, J. S. 1985, ApJ, 297, 621
- Bock et al. (1998) Bock, J. J., Marsh, K. A., Ressler, M. E., & Werner, M. W. 1998, ApJL, 504, L5
- Bock et al. (2000) Bock, J. J., Neugebauer, G., Matthews, K., Soifer, B. T., Becklin, E. E., Ressler, M., Marsh, K., Werner, M. W., et al. 2000, AJ, 120, 2904
- Braatz et al. (1993) Braatz, J. A., Wilson, A. S., Gezari, D. Y., Varosi, F., & Beichman, C. A. 1993, ApJ, 409, L5
- Bruhweiler et al. (2001) Bruhweiler, F. C., Miskey, C. L., Smith, A. M., Landsman, W., & Malumuth, E. 2001, ApJ, 546, 866
- Cameron et al. (1993) Cameron, M., Storey, J. W. V., Rotaciuc, V., Genzel, R., Verstraete, L., Drapatz, S., Siebenmorgen, R., & Lee, T. J. 1993, ApJ, 419, 136
- Chiar & Tielens (2005) Chiar, J. E., & Tielens, A. G. G.. M. 2005, astro-ph/0510156
- Code & Whitney (1995) Code, A. D., & Whitney, B. A. 1995, ApJ, 441, 400
- Efstathiou et al. (1995) Efstathiou, A., Hough, J. H., & Young, S. 1995, MNRAS, 277, 1134
- Evans et al. (1991) Evans, I. N., Ford, H. C., Kinney, A. L., Antonucci, R. R. J., Armus, L., & Caganoff, S. 1991, ApJ, 369, L27
- Galliano et al. (2003) Galliano, E., Alloin, D., Granato, G. L., & Villar-Martín, M. 2003, A&A, 412, 615
- Galliano et al. (2005) Galliano, E., Pantin, E., Alloin, D., & Lagage, P. O. 2005, astro-ph/0506071
- Gallimore et al. (1996a) Gallimore, J. F., Baum, S. A., O’Dea, C. P. & Pedlar, A. 1996, ApJ, 458, 136
- Gallimore et al. (1996b) Gallimore, J. F., Baum, S. A., & O’Dea, C. P. 1996, ApJ, 464, 198
- García-Gómez et al. (2002) García-Gómez, C., Athanassoula, E., & Barberà, C. 2002, A&A, 389, 68
- Geballe et al. (1999) Geballe, T. R., McCall, B. J., Hinkle, K. H., & Oka, T. 1999, ApJ, 510, 251
- Glasse et al. (1997) Glasse, A. C., Atad-Ettedgui, E. I., & Harris, J. W. 1997, in Proc. SPIE Vol. 2871, p. 1197-1203, Optical Telescopes of Today and Tomorrow, Arne L. Ardeberg; Ed.
- Gorjian et al. (2004) Gorjian, V., Werner, M. W., Jarrett, T. H., Cole, D. M., & Ressler, M. E. 2004, ApJ, 605, 156
- Granato & Danese (1994) Granato, G. L., & Danese, L. 1994, MNRAS, 268, 235
- Gratadour et al. (2003) Gratadour, D., Clénet, Y., Rouan, D., Lai, O., & Forveille, T. 2003, A&A, 411, 335
- Greenhill & Gwinn (1997) Greenhill, L. J., & Gwinn, C. R. 1997, Ap&SS, 248, 261
- Hao et al. (2005) Hao, L., Spoon, H. W. W., Sloan, G. C., Marshall, J. A., Armus, L., Tielens, A. G. G. M., Sargent, B., van Bemmel, I. M., et al. 2005, ApJ, 625, L75
- Hayward et al. (1996) Hayward, T. L., Saizar, P., Gehrz, R. D., Benjamin, R. A., Mason, C. G., Houck, J. R., Miles, J. W., Gull, G. E., et al. 1996, ApJ, 469, 854
- Imanishi et al. (1997) Imanishi, M., Terada, H., Sugiyama, K., Motohara, K., Goto, M., & Maihara, T. 1997, PASJ, 49, 69
- Jaffe et al. (2004) Jaffe, W., Meisenheimer, K., Röttgering, H. J. A., Leinert, C., Richichi, A., Chesneau, O., Fraix-Burnet, D., Glazenborg-Kluttig, A., et al. 2004, Nature, 429, 47
- Kemper et al. (2004) Kemper, F., Vriend, W. J., & Tielens, A. G. G. M. 2004, ApJ, 609, 826
- Kessler-Silacci et al. (2005) Kessler-Silacci, J. E., Hillenbrand, L. A., Blake, G. A., & Meyer, M. R. 2005, ApJ, 622, 404
- Kishimoto et al. (2001) Kishimoto, M., Antonucci, R., Cimatti, A., Hurt, T., Dey, A., van Breugel, W., & Spinrad, H. 2001, ApJ, 547, 667
- Krabbe et al. (2001) Krabbe, A., Böker, T., & Maiolino, R. 2001, ApJ, 557, 626
- Kraemer & Crenshaw (2000) Kraemer, S. B., & Crenshaw, D. M. 2000, ApJ, 544, 763
- Laor & Draine (1993) Laor, A., & Draine, B. T. 1993, ApJ, 402, 441
- Le Floc’h et al. (2001) Le Floc’h, E., Mirabel, I. F., Laurent, O., Charmandaris, V., Gallais, P., Sauvage, M., Vigroux, L., & Cesarsky, C. 2001, A&A, 367, 487
- Lutz et al. (2004a) Lutz, D., Maiolino, R., Spoon, H. W. W., & Moorwood, A. F. M. 2004a, A&A, 418, 465
- Lutz et al. (2000) Lutz, D., Sturm, E., Genzel, R., Moorwood, A. F. M., Alexander, T., Netzer, H., & Sternberg, A. 2000, ApJ, 536, 697
- Lutz et al. (2004b) Lutz, D., Sturm, E., Genzel, R., Spoon, H. W. W., & Stacey, G. J. 2004b, A&A, 426, L5
- Macchetto et al. (1994) Macchetto, F., Capetti, A., Sparks, W. B., Axon, D. J., & Boksenberg, A. 1994, ApJL, 435, L15
- Maiolino et al. (1995) Maiolino, R., Ruiz, M., Rieke, G. H., & Keller, L. D. 1995, ApJ, 446, 561
- Manske et al. (1998) Manske, V., Henning, T., & Men’shchikov, A. B. 1998, A&A, 331, 52
- Marco & Alloin (2000) Marco, O., & Alloin, D. 2000, A&A, 353, 465
- Marco & Brooks (2003) Marco, O., & Brooks, K. J. 2003, A&A, 398, 101
- Mason et al. (2004) Mason, R. E., Wright, G., Pendleton, Y., & Adamson, A. 2004, ApJ, 613
- McCall et al. (2002) McCall, B. J., Hinkle, K. H., Geballe, T. R., Moriarty-Schieven, G. H., Evans, N. J., Kawaguchi, K., Takano, S., Smith, V. V., & Oka, T. 2002, ApJ, 567, 391
- Mennella et al. (2003) Mennella, V., Baratta, G. A., Esposito, A., Ferini, G., & Pendleton, Y. J. 2003, ApJ, 587, 727
- Miller et al. (1991) Miller, J. S., Goodrich, R. W., & Mathews, W. G. 1991, ApJ, 378, 47
- Mountain et al. (1990) Mountain, C. M., Robertson, D. J., Lee, T. J., & Wade, R. 1990, in Instrumentation in astronomy VII; Proceedings of the Meeting, Tucson, AZ, Feb. 13-17, 1990 (A91-29601 11-35). Bellingham, WA, Society of Photo-Optical Instrumentation Engineers, 1990, p. 25-33
- Muñoz Caro et al. (2001) Muñoz Caro, G. M., Ruiterkamp, R., Schutte, W. A., Greenberg, J. M., & Mennella, V. 2001, A&A, 367, 347
- Nenkova et al. (2002) Nenkova, M., Ivezić, Ž., & Elitzur, M. 2002, ApJL, 570, L9
- Packham et al. (2005) Packham, C., Radomski, J. T., Roche, P. F., Aitken, D. K., Perlman, E., Alonso-Herrero, A., Colina, L., & Telesco, C. M. 2005, ApJL, 618, L17
- Packham et al. (1997) Packham, C., Young, S., Hough, J. H., Axon, D. J., & Bailey, J. A. 1997, MNRAS, 288, 375
- Pendleton et al. (1994) Pendleton, Y. J., Sandford, S. A., Allamandola, L. J., Tielens, A. G. G. M., & Sellgren, K. 1994, ApJ, 437, 683
- Pier & Krolik (1992) Pier, E. A., & Krolik, J. H. 1992, ApJ, 401, 99
- Pier & Krolik (1993) —. 1993, ApJ, 418, 673
- Prieto et al. (2005) Prieto, M. A., Maciejewski, W., & Reunanen, J. 2005, AJ, 130, 1472
- Prieto & Meisenheimer (2004) Prieto, M. A., & Meisenheimer, K. 2004, in IAU Symposium, 57–60
- Radomski et al. (2003) Radomski, J. T., Piña, R. K., Packham, C., Telesco, C. M., De Buizer, J. M., Fisher, R. S., & Robinson, A. 2003, ApJ, 587, 117
- Radomski et al. (2002) Radomski, J. T., Piña, R. K., Packham, C., Telesco, C. M., & Tadhunter, C. N. 2002, ApJ, 566, 675
- Rawlings et al. (2003) Rawlings, M. G., Adamson, A. J., & Whittet, D. C. B. 2003, MNRAS, 341, 1121
- Rhee & Larkin (2005) Rhee, J. H., & Larkin, J. E. 2005, astro-ph/0512051
- Rigopoulou et al. (1999) Rigopoulou, D., Spoon, H. W. W., Genzel, R., Lutz, D., Moorwood, A. F. M., & Tran, Q. D. 1999, AJ, 118, 2625
- Roche & Aitken (1984) Roche, P. F., & Aitken, D. K. 1984, MNRAS, 208, 481
- Roche & Aitken (1985) —. 1985, MNRAS, 215, 425
- Roche et al. (1991) Roche, P. F., Aitken, D. K., Smith, C. H., & Ward, M. J. 1991, MNRAS, 248, 606
- Roche et al. (1984) Roche, P. F., Whitmore, B., Aitken, D. K., & Phillips, M. M. 1984, MNRAS, 207, 35
- Rouan et al. (2004) Rouan, D., Lacombe, F., Gendron, E., Gratadour, D., Clénet, Y., Lagrange, A.-M., Mouillet, D., Boisson, C., et al. 2004, A&A, 417, L1
- Schartmann et al. (2005) Schartmann, M., Meisenheimer, K., Camenzind, M., Wolf, S., & Henning, T. 2005, A&A, 437, 861
- Siebenmorgen et al. (2005) Siebenmorgen, R., Haas, M., Krügel, E., & Schulz, B. 2005, A&A, 436, L5
- Siebenmorgen et al. (2004) Siebenmorgen, R., Krügel, E., & Spoon, H. W. W. 2004, A&A, 414, 123
- Simpson et al. (2002) Simpson, J. P., Colgan, S. W. J., Erickson, E. F., Hines, D. C., Schultz, A. S. B., & Trammell, S. R. 2002, ApJ, 574, 95
- Soifer et al. (1989) Soifer, B. T., Boehmer, L., Neugebauer, G., & Sanders, D. B. 1989, AJ, 98, 766
- Soifer et al. (2002) Soifer, B. T., Neugebauer, G., Matthews, K., Egami, E., & Weinberger, A. J. 2002, AJ, 124, 2980
- Sturm et al. (2005) Sturm, E., Schweitzer, M., Lutz, D., Contursi, A., Genzel, R., Lehnert, M. D., Tacconi, L. J., Veilleux, S., et al. 2005, ApJ, 629, L21
- Swain et al. (2003) Swain, M., Vasisht, G., Akeson, R., Monnier, J., Millan-Gabet, R., Serabyn, E., Creech-Eakman, M., et al. 2003, ApJ, 596, L163
- Telesco & Decher (1988) Telesco, C. M., & Decher, R. 1988, ApJ, 334, 573
- Thatte et al. (1997) Thatte, N., Quirrenbach, A., Genzel, R., Maiolino, R., & Tecza, M. 1997, ApJ, 490, 238
- Thompson et al. (2001) Thompson, R. I., Chary, R.-R., Corbin, M. R., & Epps, H. 2001, ApJ, 558, L97
- Tomono et al. (2001) Tomono, D., Doi, Y., Usuda, T., & Nishimura, T. 2001, ApJ, 557, 637
- van Bemmel & Dullemond (2003) van Bemmel, I. M., & Dullemond, C. P. 2003, A&A, 404, 1
- Verma et al. (2003) Verma, A., Lutz, D., Sturm, E., Sternberg, A., Genzel, R., & Vacca, W. 2003, A&A, 403, 829
- Villar-Martín et al. (2001) Villar-Martín, M., De Young, D., Alonso-Herrero, A., Allen, M., & Binette, L. 2001, MNRAS, 328, 848
- Weigelt et al. (2004) Weigelt, G., Wittkowski, M., Balega, Y. Y., Beckert, T., Duschl, W. J., Hofmann, K.-H., Men’shchikov, A. B., & Schertl, D. 2004, A&A, 425, 77
- Whittet (1992) Whittet, D. C. B. 1992, Dust in the galactic environment (The Graduate Series in Astronomy, Bristol: Institute of Physics (IOP) Publishing, 1992)
- Wright et al. (1996) Wright, G. S., Bridger, A., Geballe, T. R., & Pendleton, Y. 1996, in ASSL Vol. 209: New Extragalactic Perspectives in the New South Africa
- Young et al. (2001) Young, A. J., Wilson, A. S., & Shopbell, P. L. 2001, ApJ, 556, 6
- Young et al. (1995) Young, S., Hough, J. H., Axon, D. J., Bailey, J. A., & Ward, M. J. 1995, MNRAS, 272, 513
- Young et al. (1996) Young, S., Packham, C., Hough, J. H., & Efstathiou, A. 1996, MNRAS, 283, L1