SS 433 : a phenomenon imitating a Wolf-Rayet star††thanks: Based on observations with ISO, an ESA project with instruments funded by ESA Member States (especially the PI countries: France, Germany, the Netherlands, and the United Kingdom) and with the participation of ISAS and NASA.
We present mid-infrared (2–12 m) spectra of the microquasar SS 433 obtained with the Infrared Space Observatory (spectroscopic mode of ISOPHOT and ISOCAM). We compare them to the spectra of four Wolf-Rayet stars: WR 78, WR 134, WR 136, and WR 147 in the same wavelength range. The mid-infrared spectrum of SS 433 mainly shows H i and He i emission lines and is very similar to the spectrum of WR 147, a WN8(h)+B0.5V binary. The 2–12 m continuum emission of SS 433 corresponds to optically thin and partially optically thick free-free emission, from which we calculate a mass loss rate of if the wind is homogeneous and a third of these values if it is clumped. This is consistent with a strong stellar wind from a WN star. However, following recent studies concluding that the mass donor star of SS 433 is not a Wolf-Rayet star, we propose that this strong wind out flows from a geometrically thick envelope of material that surrounds the compact object like a stellar atmosphere, imitating the Wolf-Rayet phenomenon. This wind could also wrap the mass donor star, and at larger distances ( AU), it might form a dust envelope from which the thermal emission, detected with ISOPHOT at 25 m and 60 m, would originate. This wind also probably feeds the material that is ejected in the orbital plane of the binary system and that forms the equatorial outflow detected in radio at distances AU.
Key Words.:
(Stars:) circumstellar matter – Stars: individual: SS 433 – Stars: Wolf-Rayet – Stars: winds, outflows – Infrared: stars – X-rays: binaries1 Introduction
SS 433 was the first microquasar (an X-ray binary with relativistic jets) discovered in the 1970’s, when that designation had not even been invented yet. It was first discovered as a star with strong H emission lines and so was included in the Stephenson and Sanduleak catalog (Stephenson & Sanduleak 1977) as object number 433. It was later associated to a variable X-ray and radio source (Zwitter et al. 1989). Detailed study of its visible spectrum revealed that this source is unique. For a complete review of SS 433, we refer the reader to Margon (1984), Zwitter et al. (1989), Vermeulen (1996), and to the introduction of Gies et al. (2002b).
There are two sets of optical emission lines in the spectrum of SS 433: the first set corresponds to the so-called “stationary” lines (Margon et al. 1979) showing normal Doppler shift movements, including the strong H lines, with a period of 13 days. The second set regroups the “moving” lines, those that are less intense (by about 1/3) but that show huge Doppler shifts (Km.s-1 and Km.s-1 at the maximum elongation) corresponding to relativistic velocities with a period of about 162 days (Margon et al. 1979). The “kinematic model” is generally the one chosen to explain these unusual observations: SS 433 is an X-ray binary system orbiting in 13 days and emitting relativistic jets where the moving lines are formed. These jets undergo a precession movement in 162 days. The parameters of this system were recently re-calculated by Eikenberry et al. (2001), who found: d, d, velocity of the ejections c, inclination of the jet axis to the line of sight , and opening angle of the precession cone . The ejections and their precession movement are indeed observed in the radio images; see e.g. Hjellming & Johnston (1981) and Vermeulen et al. (1993). The source has always been observed ejecting material, meaning that this is not only the first microquasar discovered but also the only one with continuous ejections, and the only object known to show evidence of ions accelerated to relativistic velocities (0.26 c).
Despite intensive studies, the nature of the two stars in this binary system remains uncertain. No emission line has been identified as clearly belonging to the donor star of this X-ray binary, some of them being suspected to be formed close to the compact object. Numerous mass ratios were estimated leading to a low-mass or high-mass X-ray binary with either a neutron star or a black hole candidate. The presence of Wolf-Rayet-like lines added to the very luminous continuum in the visible and near-IR ranges led several people to associate the donor star to a Wolf-Rayet or Of star (Murdin et al. 1980; van den Heuvel et al. 1980; Hut & van den Heuvel 1981). However, the coordinated optical and X-ray light curves of SS 433 show that the X-ray eclipse corresponds to the minimum visual magnitude (Stewart et al. 1987); thus a thick accretion disc is inferred, which is more luminous in the visible range than the donor star. Only recently, Gies et al. (2002a) detected absorption features in the blue spectrum suggesting that the donor star is an A-type evolved star. In the more detailed spectroscopic study of Hillwig et al. (2004), the donor star is consistent with an A3-7 I type with , and the compact object is a low-mass black hole candidate with .
The distance of SS 433 has also remained uncertain for a long time. From complete observations of the radio emitting materials ejected in the relativistic jets and after taking the kinematic model into account, Blundell & Bowler (2004) eventually determined this distance as kpc.
As the origin of the spectrum (lines and continuum) of SS 433 in the visible and near-infrared ranges appears quite complicated for understanding clearly, the idea was to look for characteristic lines in the mid-IR range which could help to understand the nature and the origin of the emissions better and possibly to constrain the nature of the donor star further. In this article we present observations of SS 433 with the Infrared Space Observatory (ISO) in both spectroscopic and photometric modes in the 2–12 m range at different epochs and at 25 m & 60 m. We compare the emission line spectra to the spectra of four Wolf-Rayet star of WN type (Sect. 3). We also study the continuum emission of SS 433 in Sect. 4 and calculate the mass loss and radius of the corresponding free-free emission. In Sect. 5 we discuss the constraints on the nature of the mass donor star provided by our mid-IR observations, we describe the phenomenon imitating a Wolf-Rayet star, and we consider the possible large scales behaviour of the strong mass outflow.
2 Observations and data reduction
| TDT | civil date and in Julian Day | mode | range (FWHM) | aperture | flux density | |||
|---|---|---|---|---|---|---|---|---|
| and filters | or PFOV | range (mJy) | ||||||
| 35300404 | 3 Nov. 1996 2 450 391.195 | 0.41 | 0.84 | 0.11 | PHT40111spectrophotometry with ISOPHOT | 2.47–4.87 m () | 380–350 | |
| ” | ” ” ” ” | ” | ” | ” | PHT40 | 5.84–11.62 m () | 330–180 | |
| 51200601 | 11 Apr. 1997 2 450 550.272 | 0.39 | 0.81 | 0.27 | PHT40 | 2.47–4.87 m () | 710–590 | |
| ” | ” ” ” ” | ” | ” | ” | PHT40 | 5.84–11.62 m () | 530–280 | |
| 51200602 | ” ” 2 450 550.298 | ” | ” | ” | PHT03222multi-filter photometry with ISOPHOT | P1 12: m | 354 | |
| ” | ” ” ” ” | ” | ” | ” | PHT03 | P2 25: m | 432 | |
| 51200603 | ” ” 2 450 550.303 | ” | ” | ” | PHT22333multi-filter photometry with the far-IR camera of ISOPHOT | C100 60: m | 444per pixel, giving a total field of view of | 390 |
| 51801005 | 17 Apr. 1997 2 450 556.016 | 0.43 | 0.85 | 0.71 | PHT40 | 2.47–4.87 m () | 350–450 | |
| ” | ” ” ” ” | ” | ” | ” | PHT40 | 5.84–11.62 m () | 320–200 | |
| 52402506 | 23 Apr. 1997 2 450 561.939 | 0.47 | 0.89 | 0.16 | PHT40 | 2.47–4.87 m () | 230–330 | |
| ” | ” ” ” ” | ” | ” | ” | PHT40 | 5.84–11.62 m () | 260–180 | |
| 70900204 | 24 Oct. 1997 2 450 746.268 | 0.60 | 0.02 | 0.25 | CAM01555raster imaging with ISOCAM | LW3: 12–18 m | 666per pixel | 124 |
| ” | ” ” ” ” | ” | ” | ” | ” | LW7: 8.5–10.7 m | ” ” | 148 |
| ” | ” ” ” ” | ” | ” | ” | ” | LW9: 14–16 m | ” ” | 123 |
| ” | ” ” ” ” | ” | ” | ” | ” | LW6: 7–8.5 m | ” ” | 207 |
| ” | ” ” ” ” | ” | ” | ” | ” | LW8: 10.7–12 m | ” ” | 139 |
| ” | ” ” ” ” | ” | ” | ” | ” | LW4: 5.5–6.5 m | ” ” | 226 |
| 71100514 | 26 Oct. 1997 2 450 748.294 | 0.61 | 0.03 | 0.41 | CAM01 | LW2: 5–8.5 m | f | 423 |
We searched for observations of SS 433, (J2000), in the archives of the Infrared Space Observatory777http://www.iso.vilspa.esa.es/ida/ (ISO, Kessler et al. 1996) and found several of them in 1996 and 1997 as shown in Table 1. The main observations were achieved with the spectroscopic mode of the photometer on board ISO, ISOPHOT (Lemke et al. 1996) at four different epochs. The other observations were carried out with photometric modes of ISOPHOT and with another instrument of ISO: the infrared camera ISOCAM (Cesarsky et al. 1996).
We looked in the archives of the Green Bank Interferometer (GBI) and at the quick-look results provided by the All-Sky Monitor / Rossi X-ray Timing Explorer (ASM/RXTE) team, in order to know the state of SS 433 in radio and X-rays, respectively, at the time of the observations with ISO. The GBI 2.25 GHz and 8.3 GHz lightcurves show a normal activity in the radio, i.e. only small oscillations with no flare during the ISO observations. The X-ray level detected by ASM is low (a few counts/s), as usual, and has no flaring event.
In the visible range the spectrum of SS 433 shows strong H emission lines and looks like the spectrum of a Wolf-Rayet star, so we searched in the ISO archives for observations of WR-type stars, particularly those of late WN-type which are less evolved and so still emit hydrogen lines. We found four observations of well-defined WN stars (see table 2) with ISOSWS (de Graauw et al. 1996) the short wavelength spectrometer of ISO, which has a far better spectral resolution than ISOPHOT.
2.1 ISOPHOT wide-band filters
SS 433 was observed at 12, 25, and 60 m with ISOPHOT on 11 April 1997 (see Table 1). The measurements at 12 and 25 m were performed in triangular chopped mode; i.e. the line-of-sight was switched periodically between SS433 and two background positions placed symmetrically at from the source. At 60 m, also measured in chopped mode, only one background position was selected at 180′′ from SS433.
The data reduction was performed using the ISOPHOT Interactive Analysis Software Package V9.1 (PIA, Gabriel et al. 1997). After corrections for non-linearities of the integration ramps, an 8-point signal pattern was created from each observation by overplotting and averaging the basic blocks of the observation (the repeated background+source cycles); for details see Ábrahám et al. (2003). The signals of the patterns were transformed to a standard reset interval of 1/4 s, and an orbital dependent dark current was subtracted. The signals were corrected for non-linearities of the detectors by applying the signal linearization corrections, as available in March 2001. From the patterns a [source–background] difference signal was then extracted. In most cases the measured difference signal underestimates the real signal due to short term detector transients: therefore, a correction was applied for signal loss. This correction is a function of the chopping frequency and the measured difference signal. The flux calibration of the 12 and 60 m measurements was performed by comparison with the on-board fine calibration source (FCS), which was also measured in chopped mode. At 25 m the detector’s actual sensitivity could be reliably predicted from the orbital position of the observation, and an orbital dependent default responsivity was applied. Finally the derived flux densities were corrected for the finite size of the aperture by using the standard correction values. Colour corrections were applied for each measurement.
The flux uncertainty at 25 m was estimated to be better than 30%. At 12 m the selected aperture of was smaller than the standard one in which the ISOPHOT calibration programme was executed. At 60 m the actual responsivity of the detector can deviate significantly from an average default figure, and its value had to be derived from the accompanying FCS measurement, thereby introducing an additional uncertainty factor. Due to these issues, the accuracies of the 12 and 60 m measurements are expected to be more in the 30-50% range.
2.2 ISOPHOT spectral mode
Low resolution mid-infrared spectra of SS433 were obtained on 3 November 1996, 11, 17, and 23 April 1997, (see Table 1) with the ISOPHOT-S sub-instrument. The spectra covered the 2.5–4.9 m and 5.9–11.7 m wavelength ranges with spectral resolutions of about 0.04 m and 0.1 m and sensitivities of 26 mJy and 10 mJy, respectively. The observations were performed in triangular chopped mode with two background positions located at 90′′. The orientation of the chopping direction on the sky depends on the date of observation and is different for each spectrum. The dwelling time per chopper position was 128 s, and each measurement consisted of 4 OFF1–ON–OFF2–ON cycles and lasted 2048 s.
The ISOPHOT-S data were reduced in three steps:
(1) We used the Phot Interactive Analysis (PIA, Gabriel et al. 1997)
software V9.1 to filter out cosmic glitches in the raw data and to
determine signals (in V/s) by performing linear fits to the
integration ramps. After a second de-glitching step, performed on the
signals, a dark current value appropriate to the orbital position of
the individual signal was subtracted. Then we averaged all
non-discarded signals to derive a signal per chopper step.
(2) An [ON–OFF] signal averaged for the whole measurement was
determined by applying a 1-dimensional Fast Fourier Transformation
algorithm; for the application of FFT methods for ISOPHOT data
reduction see Haas et al. (2000)).
(3) The [ON–OFF] difference signals were calibrated by applying a
signal dependent spectral response function dedicated to chopped PHT-S
observations (Laureijs et al. 2001).
In order to verify our data reduction scheme (which is not completely standard due to the application of the FFT algorithm) and to estimate the level of the calibration uncertainties, we reduced HD 184400, an ISOPHOT standard star observed in a similar way as SS433. The results are very consistent with the model prediction for the star, and we estimate that the systematic uncertainty of our calibration is not greater than 10. However, as PHOT-S was designed for broader spectral features than the lines observed in this study, the measured line flux might be underestimated because the ISOPHOT-S pixels are separated by small gaps; according to Table 4.5 of the ISOPHOT Handbook 888http://www.iso.vilspa.esa.es/manuals/HANDBOOK/pht_hb/node3.html about 75% of the line flux is measured if the line is centred on a pixel’s wavelength; and about 43% if the line is centred between two pixels’ wavelengths.
| Name | WR type999from Smith et al. (1996) | binary | distance | 101010from van der Hucht (2001) except for WR 147 | references111111vdH01 = van der Hucht (2001) ; C95a = Crowther et al. (1995a) ; M99 = Morel et al. (1999) ; CS96 = Crowther & Smith (1996) ; C95b = Crowther et al. (1995b) ; SH99 = Stevens & Howarth (1999) ; Mor00 = Morris et al. (2000) |
|---|---|---|---|---|---|
| WR 78 = HD 151932 | WN7h WNL | no | 2.0 kpc | 1.48–1.87 | vdH01 ; C95a |
| WR 134 = HD 191765 | WN6b WNE-s | possible | 1.74 / 2.1 kpc | 1.22–1.99 | vdH01 / M99 ; CS96 |
| WR 136 = HD 192163 | WN6b(h) WNE-s | possible | 1.26 / 1.8 kpc | 1.35–2.25 | vdH01 / SH99 ; C95b |
| WR 147 | WN8(h) WNL | B0.5 V at 0.55′′ | pc | 11.6 / 11.2 | vdH01 / Mor00 |
2.3 ISOCAM wide-band filters
SS 433 was observed with the camera of ISO, with several large band filters on 24 and 26 October 1997 (see Table 1). The ISOCAM data were reduced with the Cam Interactive Analysis software (CIA, Delanay & ISOCAM Interactive Analysis Team 2000) version 4.0, following the standard processing outlined in Starck et al. (1999). First a dark correction was applied, then a de-glitching to remove cosmic ray hits, followed by a transient correction to take memory effects into account. Pixels showing remnants of these effects were masked, as well as insufficiently lit side pixels. The jitter correction was applied for the resolution image. The flat-field correction used the automatic evaluation. Then individual images were combined into the final raster map, and finally the pixel values were converted into milli-Jansky flux densities. No colour correction was applied. We estimated to % the total uncertainty of the ISOCAM observed flux densities.
2.4 ISOSWS data on WR stars
We took the SWS spectra of the four WR stars from the archive; i.e. they were processed by the SWS pipeline (officially Off-Line Processing = OLP) version 9. In order to compare them to the PHOT-S spectra of SS 433, we had to degrade their resolution and keep only the wavelength range of the PHOT-S modes. The convolution to the PHOT-S spectral resolution was performed with IDL routines available on the VILSPA home page121212http://www.iso.vilspa.esa.es/instr/SWS/ “SWS vs PHT-S Convolution Tool” written by B. Schulz.
3 The emission lines: comparison with Wolf-Rayet stars
As we summarized in the introduction, the nature of the visible and near-IR spectrum of SS 433 is difficult to interpret, and till recently no line could be used to determine the nature of the donor star in this X-ray binary. ISO provided unique spectra of this object in the mid-IR range. Since SS 433 has for a long time been strongly suspected to be a Wolf-Rayet star of WN type and its optical spectrum indeed resembles those of WN stars, we decided to compare its emission line spectra to that of several WN stars found in the ISO archives and rebinned to the same spectral resolution. The main properties of these four WR are shown in Table 2, and their observed spectra are displayed in Fig. 1, along with the spectrum of SS 433 as observed on 11 April 1997, since it has the strongest emission among the available spectra of this source.

Figure 1 shows the observed spectra i.e. with no correction for absorption by the interstellar medium. All the emission lines were identified using Morris et al. (2000) and only the lines present in at least three spectra of SS 433 and at 2.5 above the continuum were taken into account. No absorption line was found. The emission lines are mainly H i lines blended with He i or He ii lines. There is also a weak He i line at 4.30 m and two weak He ii lines at 3.09 m and 4.765 m, but no metallic line is detected. It is clear in Fig. 1 that the spectrum of SS 433 is closest to the one of WR 147, a WN8(h) star, although the isolated He i (4.30 m) and He ii (3.09 m) lines are more marked in this star than in SS 433; conversely, the other WR stars differ by a strong He ii 3.09 m line.

The similarities between the spectrum of WR 147 and the four spectra of SS 433 also appear clearly once the spectra are dereddened, as in Fig. 2 where we corrected the interstellar extinction using the law from Lutz et al. (1996) (see the next section concerning the choice of this law) and a visual absorption of for SS 433 (Margon 1984) and of for WR 147 (Morris et al. 2000). The spectra of SS 433 show the same general shape as the one of WR 147 with the same lines and comparable relative intensities between the latters, except for the 10.5 m line, which is absent in SS 433. Smith & Houck (2001) studied 8–13 m spectra of several WN8 and WN9 stars, where this [S iv] 10.5 m line can be either very weak or not detectable and may be drowned in the noise of the spectrum. However, the spectra of SS 433 are not very noisy around 10.5 m, and the sensitivity of the detector ( 10 mJy) should enable us to detect this line if present. The absence of this line is surprising, if we are dealing with a strongly ionized, dense outflow in SS433, which has a common physical mechanism to WN stars. Indeed, one would expect the presence of mid-IR fine structure lines, such as [S iv], unless the ionization in the relevant region (around a density of to cm-3) differs from that of WR stars. Given the similar ionization in the He line spectrum, one might suspect that the ionization of the plasma is comparable. Thus in the mid-IR, SS 433 (only) looks like a late WN star (WNL) of WN8 type, which is relatively H-rich (H/He , Crowther 2003b). Note that WN8 stars are known to be the most active subclass of Wolf-Rayet stars because of their high levels of spectroscopic and photometric variability (see Morris et al. 2000 and references therein). Note also that WR 147 is a Wolf-Rayet binary (WN8+B0.5V) system with strong colliding wind that has been observed in radio (Williams et al. 1997).
The measurement of line widths and position are limited by the spectral resolution of the spectrocopic mode of ISOPHOT i.e. FWHM m for the 2–5 m and 6–12 m ranges, respectively. Thus it is not possible to detect any Doppler shift due to the orbital movement. Concerning the 0.26 c relativistic motion in the jets, there is no evidence of such a Doppler shift in our spectra when comparing the different precesional phases observed, so there is no indication of infrared emission from the jets. Because of the limited spectral resolution and the blended lines, we could neither study the properties of the lines (equivalent width, shape, etc…) nor measure the elemental abundances.
4 The continuum
4.1 Dereddening
In order to study the continuum emission of SS 433, we have to deredden the observed values, i.e. to correct them from the absorption along the line of sight toward the source. What we call dereddened flux is linked to the observed flux by the formula: , where is the extinction at wavelength , calculated as times the extinction coefficient at given by an extinction law (see Fig. 3). As SS 433, with and , is located in the galactic plane at a distance of 5.5 kpc, this absorption is not negligible. The problem is that the visible absorption is not constrained very well for SS 433.

By fitting the optical continuum slope from UV to near-IR with the assumption of various thermal models (blackbody underlying spectral types or/and free-free emission) or using infrared spectrophotometry, many authors found (see references in Murdin et al. 1980 and Margon 1984). Evaluations using recent X-ray data are not restricting enough, as demonstrated in Marshall et al. (2002) on their model fitting of the Chandra grating X-ray spectra of SS 433. If they use a simple power-law model (a poor fit to the data), then they get cm-2, which implies using the Predehl & Schmitt (1995) formula: . When they use the X-ray line ratios and simultaneously fit , they get cm-2, which implies ; hence, the range of values one will find in the literature. Also from Chandra observations, Namiki et al. (2003) just fitted a power-law + gaussian lines and found cm-2, which gives mag. In the following we will only show spectra dereddened with . Note that using lower values such as doesn’t change our results significantly (see Sect. 4.4).
The extinction of the interstellar medium is highly wavelength dependent, even in the mid-IR range, but there are different absorption laws available depending on the galactic line of sight. The law described by Draine (1989) is commonly used, except for regions toward the Galactic Centre for which Lutz et al. (1996) showed that a flatter law (between 2.5 and 8.5 m) has to be used. Figure 3 shows the difference between these two laws and the wavelength range of our ISO observations. The Lutz law is also used in some particular cases like some dense H ii regions or some objects with a carbon-rich environment. As an example, Moneti et al. (2001) used the Lutz law to deredden their 2.5–8 m ISO data on the Quintuplet Cluster, although this young cluster is in the vicinity of the Galactic Centre. Indebetouw et al. (2005) presented very recent extinction measurements in the 1.25–8.0 m range along the and line of sight in the galactic plane, which are similar and consistent with measurements of Lutz et al. (1996) toward the Galactic Centre. This shows that the Lutz law could almost be universal or, at least, more common than previously thought. Dwek (2004) attributes this law to the presence of relatively short metallic needles in the interstellar medium that could form in the supernova ejecta and in quiescent O-rich stellar outflow. SS 433 may have undergone a supernova explosion to form its compact object, as it is surrounded by the W50 radio nebula (Dubner et al. 1998), which is possibly a supernova remnant. Thus the Lutz law is likely to be valid in the case of SS 433, so we used it in this study. Moreover when we dereddened the spectra with the Draine law, the continuum showed a complicated shape with a narrow “bump” in the 7–10 m range, which we were unable to fit correctly, even when using a lower value.
4.2 Variability
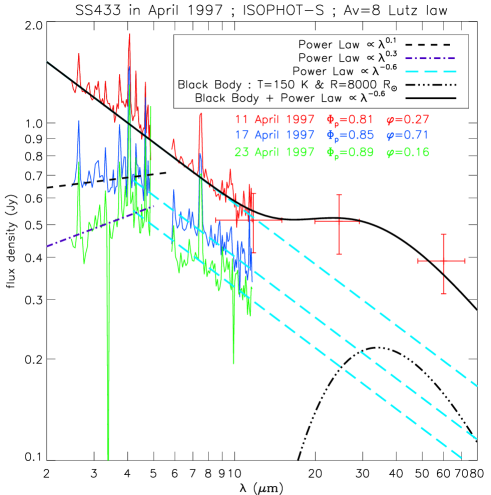
Figure 4 shows all the ISO observations of SS 433 once dereddened with and using the law of Lutz et al. (1996). The continuum level varies from one observation to another, and we can try to explain these variations using the orbital and precessional phases.
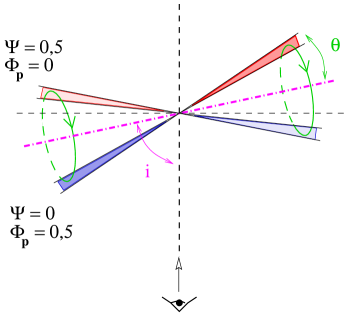
In Table 1, and are, respectively, the precessional and orbital phases according to Kemp et al. (1986). As usually corresponds to the primary minimum in the visible light curve, but here the mid-eclipse is the donor inferior conjunction, as the region of the compact object is more luminous than the donor star. Kemp et al. (1986) chose the precession phase at the time of light minimum in terms of the 162 d Fourier component, corresponding to the time when we tend to look “under” the disc, but many authors, such as Goranskii et al. (1998) and Gies et al. (2002b) defined the precessional phase with (corresponding to ) when the emission lines attain their extremum radial velocities, thus the time when the jets are closest to our line of sight and the disc presents a maximum cross section to us (see Fig. 5). The values obtained when calculating the orbital phase using the ephemeris from Kemp et al. (1986) are quite similar () to the ones obtained following the ephemeris of Goranskii et al. (1998). There is a difference of in the results obtained for the precessional phases using both ephemeris, probably due to the different precession periods used by the authors: 162.5 d for Kemp et al. (1986), instead of 162.15 d for Goranskii et al. (1998) and Gies et al. (2002b).
We reported the values of the orbital and precessional phases of SS 433 with Figs. 3 and 4 of Kemp et al. (1986), respectively showing the mean V-band light curve on the orbital period and 162.5 d light curves centred on four orbital phases (). The decreasing level with time of the continuum in April 1997 (see Fig. 4) is easily explained by the decrease of the corresponding levels in the mean orbital light curve and in the precessional light curve. The continuum level of the spectrum on 3 November 1996 is remarkably similar to the one on 17 April 1997 while the mean orbital light curve predicts a slightly lower level. But this could be equilibrated by its precessional phase which is a bit farther to the minimum flux than in April 17.
However, we cannot clearly explain why the 24 October 1997 level is so low while its orbital phase should correspond to the maximum orbital flux, unless considering that the effect of the precession phase is dominant, since with this date is very close to the minimum flux when the disc is edge on. Then the much higher flux two days later, on 26 October 1997 should also be attributed to the slight higher precession phase (), which could lead to a significantly higher flux because of geometrical effects. Note also that these observations in October 1997 were performed with a different instrument, ISOCAM instead of ISOPHOT, so with different sensitivity and spatial resolution.
4.3 Data fitting
The continuum of SS 433 in April 1997 can be fitted very well by one or two power laws and a blackbody emission as shown in Fig. 4 (left). For 11 April 1997 the continuum corresponds to a power law from 2.5 to 12 m: Jy, where and . Then a blackbody model with K and is added to this power law emission to fit the far-IR emission, but with only three points at 12, 25, and 60 m, the constraints are not strong. The blackbody model was the simplest model to correspond to a possible thermal emission in this wavelength range. The two other April 1997 spectra are fitted by two power laws with , on April 17 and , on April 23 for the 2–4.5 m range, and , and , , respectively, for the 4.5–12 m part.
These power laws can be interpreted as free-free emission: optically thin for the positive slopes between 2 and 4.5 m in April 17 and 23, and the negative slope () corresponding to the intermediate regime between optically thin and optically thick free-free emission. This slope is the exact theoretical spectral index for the free-free emission from an ionized homogeneous wind flowing out from a star with a spherical expansion and at a constant velocity (Panagia & Felli 1975; Wright & Barlow 1975). This is characteristic of hot stars with strong winds, such as O and WR stars (Cohen et al. 1975). Note that Schmid-Burgk (1982) demonstrated that the overall spectral emitting behaviour is the same for non-spherical outflows with more complex geometries, as long as they stay thick, i.e. when no ratio of structural length scales in the source exceeds about 10, which is very likely the case in SS 433.
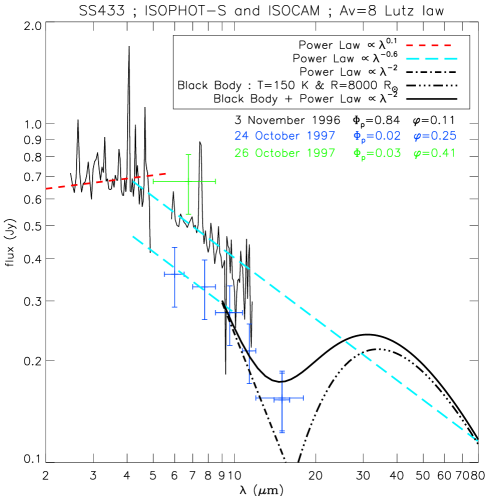
Figure 4 (right) shows our fit of the continuum of the 3 November 1996 spectrum with the same functions as on 17 April 1997, as they have the same flux level: Jy with , and , . These functions fit the continuum well except for m, where the continuum decreases more rapidly as if it turns to an optically thicker emission. The same behaviour is observed with ISOCAM on 24 October 1997, although the wide band filters have large error bars. This spectral energy distribution follows the Jy law between 5 and 10 m, then the flux decreases indicating a clear cut off toward a larger slope. The continuum can then be fitted by an optically thick free-free emission ( Jy) plus the same black body emission ( K and ) as in the April 1997 fitting.
Thus over five epochs of observations, the 2–12 m spectrum of SS 433 corresponds to optically thin and thick free-free emission, so it is consistent with a standard O or WR wind. The far-IR emission is probably thermal emission from dust at K surrounding the system at a large distance ().
4.4 Mass loss evaluation
From our fit of the free-free emission of SS 433 and assuming a thick geometry for the wind, we can calculate the corresponding mass loss (in ) using the Wright & Barlow (1975) equation (8), which gives the flux density of the free-free emission of a radiatively driven wind:
where is the distance in kpc, mean atomic weight per nucleon, the terminal velocity of the wind measured in km s-1, the frequency of observation in GHz, the number of free electrons per nucleon, the Gaunt factor and the mean ionic charge. Then the mass loss is
We took kpc and we measured the flux densities at a wavelength of 5 m ( GHz) in the maximum and minimum levels of April 1997: mJy & 495 mJy. The other parameters of this equation are not very well known, but we can take either the usual or average values of the WN winds, assuming that the Gaunt factor is and that the terminal velocity is km s-1 (Crowther 2003a), and using a wind composition typical of late WN stars , , and (Leitherer et al. 1997). Note that the adopted velocity is also compatible with the observations of the Hα stationary lines in the optical spectrum; van den Heuvel (1981) reported Doppler widths of km s-1, and recently Gies et al. (2002b) measured FWHM of 15 Å ( 680 km s-1). We find a maximum mass loss rate of and a minimum of .
We explored the possible range of the parameters to see how they influence the resulting mass loss. The velocity of the wind flowing out from a WR star generally lies between 500 km s-1 and 1500 km s-1, which either reduces the result by a factor of 2 or multiplies it by 1.5. In the mid-IR, the Gaunt factor is not easy to calculate, as the parameters of the plasma are unknown. According to Rybicki & Lightman (1979), ranges from 1 to 5, which would result in a mass loss multiplied by 0.45. Another unknown is the chemical composition of the wind, but the typical WN composition seems reasonable since the study of Leitherer et al. (1995) shows values of between 1.5 and 2.7 for WN7/WN8 stars (which implies to 1.35); and from the mid-IR spectra, the wind is dominated by H+ and He+ ions so . We checked the results obtained by dereddening the spectra with a lower visible absorption and found that this does not change the mass loss a lot, and it is then multiplied by a factor of 0.85. We also calculated the mass loss using the lowest value of distance kpc, inferred from H i observations of the W50 nebula around SS 433 (Dubner et al. 1998), which divides the resulting mass loss values by a factor of 2.2. Thus the greatest uncertainties concerning the mass loss come from the wind velocity and the Gaunt factor, so that the range is valid within a factor of 3.
This result agrees well with the past estimates. van den Heuvel (1981) found a wind mass loss rate of outflowing from an O or WR type star with a velocity of km s-1. Shklovskii (1981) calculated a mass loss rate of from a 10 m flux density and by assuming an optically thick plasma with a dispersion velocity of km s-1. More recently, King et al. (2000) considered possible evolutionary models for SS 433 and predicted mass loss rates between and .
We can also compare this result with our previous study of Cygnus X-3 (Koch-Miramond et al. 2002), which is generally accepted as an X-ray binary containing a Wolf-Rayet star. The only other such case is IC 10 X-1 (Clark & Crowther 2004). In this similar study, the continuum of the mid-IR spectrum of Cygnus X-3 is also due to free-free emission and corresponds to a mass loss rate of when using the same typical WN composition and Gaunt factor and with a velocity of km s-1. The similarity of both results is striking, whereas the observed flux is fairly different, since Cygnus X-3 is at a distance of 10 kpc with a highly absorbed emission (). This shows that the spectrum of SS 433 resembles the one of a Wolf-Rayet X-ray binary very well and suggests a common physical mechanism at work in both systems. Indeed a disc-like wind, though significantly flattened in the plane of the binary orbit, has been invoked by Fender et al. (1999) to explain both the variability of the He i emission lines in this object and an asymmetric emitting region. This binary system has a much smaller size ( separation, 4.8 h period) than SS 433 (13 d period), thus the IR emitting region is significantly larger than the binary separation, consequently the outflowing wind is external to the binary orbit.
Finally, the mass loss rate of SS 433 has to be corrected from the effect due to the very probable inhomogeneity of the wind. The clump mass loss rates of WN stars are a factor of 3 times lower than previous homogeneous rates (Crowther 2003a), so the mass loss rate of SS 433 is within the range . This result can be compared to the mass loss rate of WR 147 measured by Morris et al. (2000) and to the typical range of WN clumped mass-loss rates: (Crowther 2003b). Thus the mass loss rate found for SS 433 is the same order of magnitude as a strong WN wind.
4.5 Size of the emitting region
Although we don’t know the geometry of this wind, we can calculate the radius of the equivalent spherical free-free emitting region thanks to Eq. (11) of Wright & Barlow (1975):
where is the electron temperature of the gas (in Kelvin), which is assumed to be constant. Combining this equation with Eq. (8) of Wright & Barlow (1975) (see Sect. 4.4) gives the characteristic radius of the emitting region at a frequency :
The temperature of the plasma responsible for the observed free-free emission is unknown, so we take the typical value of K for WR stars according to Leitherer et al. (1995). At 5 m GHz with the minimum (495 mJy) and maximum (876 mJy) flux densities of April 1997, we find cm .
The value of this characteristic radius is very dependent on the frequency of observation, but also on the plasma temperature and on the distance. If the plasma temperature varies by a factor of 2 or 3, this radius will be multiplied by a factor of 0.7 or 0.6, respectively. The lower distance 3.2 kpc will multiply this result by a factor of 0.6, and the lower visible extinction will only multiply it by a factor of 0.9. Moreover, this is the equivalent radius referring to a spherical case, so these values can only be taken into account as orders of magnitude for the typical size of the free-free emitting region in SS 433.
This result can be compared to the previous study of Shklovskii (1981), who used a measurement at 10 m to find that the linear radius of the emitting region (considered as optically thick) is cm (72 ), which is compatible with our result. He corrected this with the effects of inclination of the system to the line of sight, considering the emitting region as an oblate spheroid whose principal radius is thus cm , thus greater than the binary system and forming a common envelope around it. These kinds of models will be discussed later.
5 Discussion
5.1 Nature of the donor star and mid-IR constraints
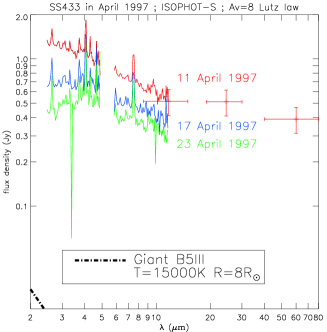
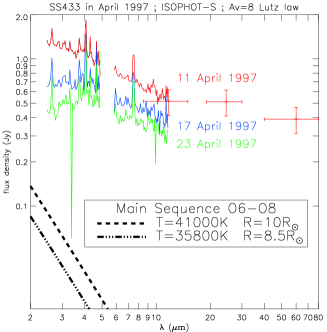
In the previous section we showed that both the emission lines and the continuum of the mid-IR spectrum of SS 433 are compatible with a Wolf-Rayet type for the donor star and preferably with a late WN star (WN8). However, the recent works of Gies et al. (2002a) and Hillwig et al. (2004) suggest that the donor star is an A3-7 I supergiant star with . This result seems to be confirmed by the preliminary study of blue spectra of SS 433 by Charles et al. (2004), who find absorption features typically seen in late B-A spectra. On the other hand, Lopez et al. (2004) use a different method, modeling the Chandra X-ray spectrum during eclipse to constrain the radius of the mass donor star to be . They note that for a main sequence star, this corresponds to a companion mass of , so an O6-O8 V type star with K, according to Lang (1992). But such a radius could also correspond to a B4-5 giant star. For a B5 III (), we find and K (Lang 1992). To sum up, following all these results the donor star is not a Wolf-Rayet star, so there must be a phenomenon imitating such a star in SS 433.
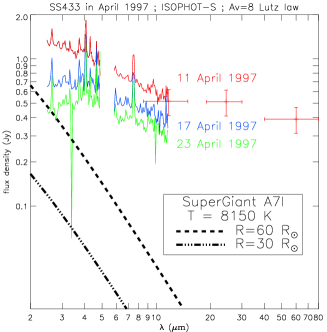
Before we discuss this point, let us see which constraints on the nature of the donor star we can provide from the mid-IR spectra of SS 433. In Fig. 6 we overplotted the emissions of the possible donor stars above cited to the dereddened ISO spectra. We modeled these stars with black body emissions at a distance of 5.5 kpc.
Concerning the A I hypothesis, we chose to fit an A7 supergiant which is less luminous ( K from Lang 1992) than an A3 I ( K), and we took a stellar radius of (Lang 1992). This emission is not compatible with the mid-IR emission of SS 433, since in the m range the A7 I flux density is of the order of the continuum of SS 433 on 23 April 1997 (Fig. 6 left). But this continuum corresponds to an optically thin free-free emission, which should then not be detected because of the dominant black body emission at this orbital phase () where the donor star is in the front part of the orbit. In order to get a black body emission negligible compared to this optically thin emission, we had to set the radius of the A7 I star to or less. Then this constraint is compatible with the result of Hillwig et al. (2004), who find the radius of the Roche lobe volume for the mass donor star to be . Note that this corresponds to a star with an intermediate size between type I (supergiant) and type II (bright giant) stars (Venn 1995).
Concerning a possible donor star with , we used the standard values for the radius and temperature of a B5 III and O6-O8 V stars, and Fig. 6 (centre and right) shows that the corresponding black body emissions are negligible compared to the flux density of the continuum obtained with ISOPHOT. Thus both a giant B5 star and a main sequence O6-O8 star are compatible with the spectrum of SS 433.
5.2 A phenomenon imitating a Wolf-Rayet star
Now, as the mass donor star of SS 433 is not a Wolf-Rayet star, then there must be a phenomenon imitating the emission of such a star in this binary system. A long time ago, van den Heuvel (1981) suggested that SS 433 was a system containing an early-type star overflowing its Roche-Lobe and a large luminous accretion disc, both embedded in a dense, spherically symmetric, outflowing atmosphere resembling that of a Wolf-Rayet star. We propose a very similar model where this Wolf-Rayet phenomenon comes from the material surrounding the compact object and where the donor star is only constrained to be smaller than a supergiant. This material does not form a classical thin accretion disc but instead a thick torus or a thick envelope like a stellar atmosphere, but not spherical, which is ionized by the UV/X-rays emitted in the close vicinity of the compact object and expelled by radiation pressure, thus imitating the wind of a Wolf-Rayet star.
There may be a “classical” thin accretion disc, but only very close to the compact object and not detectable because of the surrounding material. This would explain that there is no evidence for an accretion disc in the Chandra X-ray spectrum of SS 433 according to Marshall et al. (2002) and that SS 433 is not as strong an X-ray source as the other microquasars or X-ray transients.
Note that Hillwig et al. (2004) find a binary separation of AU , which is of the order of the typical radius of the free-free emitting region at 5 m , which we calculated in Sect. 4.5. So the wind may envelop a part of the donor star or the whole binary system, possibly forming a very hot “common envelope”, as already suggested by Shklovskii (1981).
Several authors have reported the possibility of a peculiar envelope surrounding SS 433 with a disc-like shape. Zwitter et al. (1991) proposed that the asymmetric shape of the visible light curves is due to a disc-like outflow of matter from the accretion disc. This optically thick “excretion flow” is not confined to the plane of the accretion disc but has an opening angle of centred close to the orbital plane and extends up to the orbit of the companion. This analysis is compatible with the observations of Kotani et al. (1996), who explained that some X-ray lines are heavily absorbed only in the receding jet because of the existence of absorbing gas in a precessing plane perpendicular to the jets. However, they do not constrain the size of this extended rim of the accretion disc, and their evaluation of the mass escape rate (a few ) is far too low compared to our result based on a spherical model (Wright & Barlow 1975), which is also valid for a thick disc-like outflow according to Schmid-Burgk (1982). Moreover, our observations suggest a thicker envelope with roughly the size of the SS 433 binary system, more torus-like than disc-like.
5.3 Ejected material at larger scale
With such a huge mass loss for SS 433 (), one could ask what happens to all this ejected material. The relativistic jets of SS 433 are well known, and the source is continuously ejecting material in this way, but Marshall et al. (2002) and previous studies estimated the mass loss of these jets to yr-1. Thus the material ejected in the jets is negligible compared to the wind that we observe in the infrared.
A part of this wind material might form dust, which emission in the far infrared would explain the excess emission that we observe for m in the 11 April 1997 spectrum of SS 433 (Fig. 4). We modeled this emission with a black body of temperature K and radius cm AU, which gives a rough estimate of the temperature and distance of the dust region. No WN star is known to form dust, so this would be another surprising difference between SS 433 and WN stars. This dust could form when the ejected material cools down, far enough from the binary system so that it is not destroyed by the hot radiation of the WR-like object. SS 433 would then resemble some planetary nebulae where the central star can be very hot ( K), particularly the newly discovered [WN7] star associated with the ring nebula PCG11 (Cohen et al. 2005). The visible spectrum of SS 433 clearly shows C lines: C iii/N iii 4644 Å (Margon 1984; Gies et al. 2002a) and C ii 7231,7236 Å (Gies et al. 2002b). The abundance of C may not be high in the wind of SS 433, but the mass loss is so huge that it brings a lot of material to the surrounding medium, so the conditions for dust formation might be gathered in the outskirts of SS 433.
Fabrika (1993) argues that the gas flows out through the outer Lagrangian point L2 behind the compact star and sprinkles a spiral of matter forming a disc-like envelope with an opening angle of about . In the course of precession, an extended disc is formed with a double-cone shape with an opening angle of. Its inner radius is cm, and it is not fully filled by the gas up to a distance of cm. According to this model, in years the external radius of this envelope is 1.5 pc. Depending on the distance of the L2 point to the compact object (so depending on its mass) this analysis is compatible (or not), with our thick wind envelope.
This scenario is also – in general – compatible with the radio observations of equatorial outflows in SS 433. In the 1.6 GHz image of Paragi et al. (1999), there are two faint extended emission regions at a distance of 30 mas (138 AU) to 70 mas (322 AU) to the NE and SW from the position of SS 433. This detection is confirmed by Blundell et al. (2001) who show smooth low-surface brightness emissions extending to mas perpendicularly to the jet at 1.5 GHz and 5 GHz. More observations analyzed by Paragi et al. (2002) show that these radio features extending along the equatorial plane of the binary system move away from the central engine on timescales of weeks to months. It seems that the appearance of these radio emitting regions is changing with time, blob-like or smoother, and is related to the precessional cycle. The nature of the emission is unknown, very likely non-thermal and maybe optically thin synchrotron from a mixed population of relativistic and thermal electrons.
This equatorial outflow of SS 433 has also recently been observed with the VLBA by Mioduszewski et al. (2004). The diffuse emission of the outflow seems to brighten as it moves away from SS 433 at a velocity of km s-1. This is much higher than the wind velocity that we adopted in our study and even much higher than the upper limit for the velocity of a WR wind. Thus, either the wind outflowing from SS 433 has a very unusual high velocity – which we cannot explain and which would increase the mass loss rate by nearly an order of magnitude – or the wind material (mainly electrons) is accelerated with an unknown (magneto-hydrodynamic?) mechanism somewhere between the binary system and the large distance ( AU) of the radio emitting regions.
6 Conclusions
The mid-IR spectra of SS 433 obtained with ISO in 1996 and 1997 show H and He emission lines similar to the ones observed in the spectrum of the Wolf-Rayet star WR 147, a WN8(h)+B0.5V binary system with colliding wind. The spectrum of SS 433 is thus compatible with the presence of a WN8 star.
The 2–12 m continuum emission of SS 433 corresponds to free-free emission, optically thin or intermediate between optically thin and thick, depending on both the wavelength and time of observation. At 25 m and 60 m, the emission may be due to dust at surrounding the binary system at a large distance (). Assuming that the free-free emission is emitted by a geometrically thick homogeneous wind, we calculated the corresponding mass loss of . If the wind is clumped, this result is a factor of 3 times lower: , thus compatible with a strong wind from a WN star.
However, considering recent results discarding a WR star for
the nature of the mass donor star in SS 433, we propose that
the WR-like wind observed in the IR is outflowing from an
envelope of material enshrouding the region of the compact
object and maybe also the donor star. This envelope, heated,
ionized, and expelled by the X-ray emission of the compact
object, is thus imitating a Wolf-Rayet star.
This wind is probably the source that provides material which
forms the possible dust emitting in the far-IR and, at larger
distance ( AU), the equatorial outflow observed in radio.
Acknowledgements.
The ISOPHOT spectra presented in this paper belonged to the observing programme of Alberto Salama, and the authors thank him for investing quite a lot of efforts in preparing the observations. The authors thank Phil Charles, Simon Clark, and Martin Haas for interesting discussions and suggestions. Y.F. was partly supported by a CNES external post-doctoral fellowship. The work was partly supported by the grant OTKA T 037508 of the Hungarian Scientific Research Fund. P.Á. acknowledges the support of the Bolyai Fellowship. The observations were reduced using the ISOPHOT Interactive Analysis package PIA, which is a joint development by the ESA Astrophysics Division and the ISOPHOT Consortium, lead by the Max-Planck-Institut für Astronomie (MPIA). The ISOCAM data presented in this paper were analysed using “CIA”, a joint development by the ESA Astrophysics Division and the ISOCAM Consortium. The ISOCAM Consortium is led by the ISOCAM PI, C. Cesarsky. The Green Bank Interferometer is a facility of the National Science Foundation operated by the National Radio Astronomy Observatory, in support of USNO and NRL geodetic and astronomy programs, and of NASA High Energy Astrophysics programs.References
- Ábrahám et al. (2003) Ábrahám, P., Acosta-Pulido, J. A., Klaas, U., et al. 2003, in ESA SP-481: The Calibration Legacy of the ISO Mission, ed. L. Metcalfe, A. Salama, S.B. Peschke and M.F. Kessler, 89
- Blundell & Bowler (2004) Blundell, K. M. & Bowler, M. G. 2004, ApJ, 616, L159
- Blundell et al. (2001) Blundell, K. M., Mioduszewski, A. J., Muxlow, T. W. B., Podsiadlowski, P., & Rupen, M. P. 2001, ApJ, 562, L79
- Cesarsky et al. (1996) Cesarsky, C. J., Abergel, A., Agnese, P., et al. 1996, A&A, 315, L32
- Charles et al. (2004) Charles, P. A., Barnes, A. D., Casares, J., et al. 2004, Rev. Mex. Astron. Astrofis. Conf. Series, 20, 50
- Clark & Crowther (2004) Clark, J. S. & Crowther, P. A. 2004, A&A, 414, L45
- Cohen et al. (1975) Cohen, M., Kuhi, L. V., & Barlow, M. J. 1975, A&A, 40, 291
- Cohen et al. (2005) Cohen, M., Parker, Q. A., & Green, A. J. 2005, MNRAS, 360, 1439
- Crowther (2003a) Crowther, P. A. 2003a, in Massive Stars: Formation, Evolution and Environment, ed. Heydari-Malayeri & Zahn (proceedings of 2002 Aussois summer school), astro-ph/0305141
- Crowther (2003b) Crowther, P. A. 2003b, in A Massive Star Odyssey: From Main Sequence to Supernova, ed. K. van der Hucht, A. Herrero, & E. César, IAU Symposium, Vol. 212 (San Francisco: Astronomical Society of the Pacific), 47
- Crowther et al. (1995a) Crowther, P. A., Hillier, D. J., & Smith, L. J. 1995a, A&A, 293, 403
- Crowther & Smith (1996) Crowther, P. A. & Smith, L. J. 1996, A&A, 305, 541
- Crowther et al. (1995b) Crowther, P. A., Smith, L. J., & Hillier, D. J. 1995b, A&A, 302, 457
- de Graauw et al. (1996) de Graauw, T., Haser, L. N., Beintema, D. A., et al. 1996, A&A, 315, L49
- Delanay & ISOCAM Interactive Analysis Team (2000) Delanay, M. & ISOCAM Interactive Analysis Team. 2000, ESA Document SAI/96–5226/Dc, available at http://www.iso.vilspa.esa.es/archive/software/
- Draine (1989) Draine, B. T. 1989, in ESA SP-290, Infrared Spectroscopy in Astronomy, 93–98
- Dubner et al. (1998) Dubner, G. M., Holdaway, M., Goss, W. M., & Mirabel, I. F. 1998, AJ, 116, 1842
- Dwek (2004) Dwek, E. 2004, ApJ, 611, L109
- Eikenberry et al. (2001) Eikenberry, S. S., Cameron, P. B., Fierce, B. W., et al. 2001, ApJ, 561, 1027
- Fabrika (1993) Fabrika, S. N. 1993, MNRAS, 261, 241
- Fender et al. (1999) Fender, R. P., Hanson, M. M., & Pooley, G. G. 1999, MNRAS, 308, 473
- Gabriel et al. (1997) Gabriel, C., Acosta-Pulido, J., Heinrichsen, I., Morris, H., & Tai, W.-M. 1997, in ASP Conf. Ser. 125: Astronomical Data Analysis Software and Systems VI, 108
- Gies et al. (2002a) Gies, D. R., Huang, W., & McSwain, M. V. 2002a, ApJ, 578, L67
- Gies et al. (2002b) Gies, D. R., McSwain, M. V., Riddle, R. L., et al. 2002b, ApJ, 566, 1069
- Goranskii et al. (1998) Goranskii, V. P., Esipov, V. F., & Cherepashchuk, A. M. 1998, Astronomy Reports, 42, 209
- Haas et al. (2000) Haas, M., Müller, S. A. H., Chini, R., et al. 2000, A&A, 354, 453
- Hillwig et al. (2004) Hillwig, T. C., Gies, D. R., Huang, W., et al. 2004, ApJ, 615, 422
- Hjellming & Johnston (1981) Hjellming, R. M. & Johnston, K. J. 1981, ApJ, 246, L141
- Hut & van den Heuvel (1981) Hut, P. & van den Heuvel, E. P. J. 1981, A&A, 94, 327
- Indebetouw et al. (2005) Indebetouw, R., Mathis, J. S., Babler, B. L., et al. 2005, ApJ, 619, 931
- Kemp et al. (1986) Kemp, J. C., Henson, G. D., Kraus, D. J., et al. 1986, ApJ, 305, 805
- Kessler et al. (1996) Kessler, M. F., Steinz, J. A., Anderegg, M. E., et al. 1996, A&A, 315, L27
- King et al. (2000) King, A. R., Taam, R. E., & Begelman, M. C. 2000, ApJ, 530, L25
- Koch-Miramond et al. (2002) Koch-Miramond, L., Ábrahám, P., Fuchs, Y., Bonnet-Bidaud, J.-M., & Claret, A. 2002, A&A, 396, 877
- Kotani et al. (1996) Kotani, T., Kawai, N., Matsuoka, M., & Brinkmann, W. 1996, PASJ, 48, 619
- Lang (1992) Lang, K. R. 1992, Astrophysical Data I. Planets and Stars. (Springer-Verlag Berlin Heidelberg New York)
- Laureijs et al. (2001) Laureijs, R. J., Klaas, U., Richards, P. J., Schulz, B., & Ábrahám, P. 2001, ISO Handbook, Vol. V, Sect. 5.2.6, http://www.iso.vilspa.esa.es/manuals/HANDBOOK/V /pht_hb/pht_hb.html
- Leitherer et al. (1995) Leitherer, C., Chapman, J. M., & Koribalski, B. 1995, ApJ, 450, 289
- Leitherer et al. (1997) —. 1997, ApJ, 481, 898
- Lemke et al. (1996) Lemke, D., Klaas, U., Abolins, J., et al. 1996, A&A, 315, L64
- Lopez et al. (2004) Lopez, L. A., Marshall, H. L., Canizares, C. R., Kane, J. F., & Schulz, N. S. 2004, in 35th COSPAR Scientific Assembly held in Paris, France, 18 - 25 July 2004, Advances in Space Research (Elsevier Science Ltd)
- Lutz et al. (1996) Lutz, D., Feuchtgruber, H., Genzel, R., et al. 1996, A&A, 315, L269
- Margon (1984) Margon, B. 1984, ARA&A, 22, 507
- Margon et al. (1979) Margon, B., Grandi, S. A., Stone, R. P. S., & Ford, H. C. 1979, ApJ, 233, L63
- Marshall et al. (2002) Marshall, H. L., Canizares, C. R., & Schulz, N. S. 2002, ApJ, 564, 941
- Mioduszewski et al. (2004) Mioduszewski, A. J., Rupen, M. P., Walker, R. C., Schillemat, K. M., & Taylor, G. B. 2004, in 8th HEAD Meeting and private communication
- Moneti et al. (2001) Moneti, A., Stolovy, S., Blommaert, J. A. D. L., Figer, D. F., & Najarro, F. 2001, A&A, 366, 106
- Morel et al. (1999) Morel, T., Marchenko, S. V., Eenens, P. R. J., et al. 1999, ApJ, 518, 428
- Morris et al. (2000) Morris, P. W., van der Hucht, K. A., Crowther, P. A., et al. 2000, A&A, 353, 624
- Murdin et al. (1980) Murdin, P., Clark, D. H., & Martin, P. G. 1980, MNRAS, 193, 135
- Namiki et al. (2003) Namiki, M., Kawai, N., Kotani, T., & Makishima, K. 2003, PASJ, 55, 281
- Panagia & Felli (1975) Panagia, N. & Felli, M. 1975, A&A, 39, 1
- Paragi et al. (2002) Paragi, Z., Fejes, I., Vermeulen, R. C., et al. 2002, in Proceedings of the 6th European VLBI Network Symposium on New Developments in VLBI Science and Technology, ed. E. Ros, R. W. Porcas, A. P. Lobanov, & J. A. Zensus (Max-Planck-Institut fuer Radioastronomie, Bonn), 263
- Paragi et al. (1999) Paragi, Z., Vermeulen, R. C., Fejes, I., et al. 1999, A&A, 348, 910
- Predehl & Schmitt (1995) Predehl, P. & Schmitt, J. H. M. M. 1995, A&A, 293, 889
- Rybicki & Lightman (1979) Rybicki, G. B. & Lightman, A. P. 1979, Radiative processes in astrophysics (New York, Wiley-Interscience)
- Schmid-Burgk (1982) Schmid-Burgk, J. 1982, A&A, 108, 169
- Shklovskii (1981) Shklovskii, I. S. 1981, Soviet Astronomy, 25, 315
- Smith & Houck (2001) Smith, J. D. T. & Houck, J. R. 2001, AJ, 121, 2115
- Smith et al. (1996) Smith, L. F., Shara, M. M., & Moffat, A. F. J. 1996, MNRAS, 281, 163
- Starck et al. (1999) Starck, J. L., Abergel, A., Aussel, H., et al. 1999, A&AS, 134, 135
- Stephenson & Sanduleak (1977) Stephenson, C. B. & Sanduleak, N. 1977, ApJS, 33, 459
- Stevens & Howarth (1999) Stevens, I. R. & Howarth, I. D. 1999, MNRAS, 302, 549
- Stewart et al. (1987) Stewart, G. C., Watson, M. G., Matsuoka, M., et al. 1987, MNRAS, 228, 293
- van den Heuvel (1981) van den Heuvel, E. P. J. 1981, Vistas in Astronomy, 25, 95
- van den Heuvel et al. (1980) van den Heuvel, E. P. J., Ostriker, J. P., & Petterson, J. A. 1980, A&A, 81, L7
- van der Hucht (2001) van der Hucht, K. A. 2001, New Astronomy Review, 45, 135
- Venn (1995) Venn, K. A. 1995, ApJS, 99, 659
- Vermeulen (1996) Vermeulen, R. C. 1996, Lecture Notes in Physics, Berlin Springer Verlag, 471, 122
- Vermeulen et al. (1993) Vermeulen, R. C., Schilizzi, R. T., Spencer, R. E., Romney, J. D., & Fejes, I. 1993, A&A, 270, 177
- Williams et al. (1997) Williams, P. M., Dougherty, S. M., Davis, R. J., et al. 1997, MNRAS, 289, 10
- Wright & Barlow (1975) Wright, A. E. & Barlow, M. J. 1975, MNRAS, 170, 41
- Zwitter et al. (1989) Zwitter, T., Calvani, M., Bodo, G., & Massaglia, S. 1989, Fundamentals of Cosmic Physics, 13, 309
- Zwitter et al. (1991) Zwitter, T., Calvani, M., & D’Odorico, S. 1991, A&A, 251, 92