22institutetext: Max-Planck-Institut für Astronomie, Königstuhl 17, D-69117, Germany
Properties of dust in the high-latitude translucent cloud L1780
We have analyzed the properties of dust in the high galactic latitude translucent cloud Lynds 1780 using ISOPHOT maps at 100m and 200m and raster scans at 60m, 80m, 100m, 120m, 150m and 200m. In far-infrared (FIR) emission, the cloud has a single core that coincides with the maxima of visual extinction and 200m optical depth. At the resolution of 3.0, the maximum visual extinction is 4.0 mag. At the cloud core, the minimum temperature and the maximum 200m optical depth are 14.9 K and , respectively, at the resolution of 1.5. The cloud mass is estimated to be 18. The FIR observations, combined with IRAS observations, suggest the presence of different, spatially distinct dust grain populations in the cloud: the FIR core region is the realm of the ”classical” large grains, whereas the very small grains and the PAHs have separate maxima on the Eastern side of the cold core, towards the ”tail” of this cometary-shaped cloud. The color ratios indicate an overabundance of PAHs and VSGs in L1780. Our FIR observations combined with the optical extinction data indicate an increase of the emissivity of the big grain dust component in the cold core, suggesting grain coagulation or some other change in the properties of the large grains. Based on our observations, we also address the question, to what extent the 80m emission and even the 100m and the 120m emission contain a contribution from the small-grain component.
Key Words.:
ISM: clouds – infrared: ISM – ISM: individual objects: L17801 Introduction
Recent ISM dust models (e.g. Désert, Boulanger & Puget 1990) typically have three dust components for which a power law size distribution is assumed: the big ”classical” silicate or carbonaceous dust grains with maximum emission at about 100-200m; very small grains (VSGs), which mainly emit at m; and polycyclic aromatic hydrocarbons (PAHs) which have emission features in the wavelength range 3-20m and a possible continuum contribution. It has been known since the IRAS observations that both the small and the big interstellar grains contribute to the heating and cooling of the interstellar medium (ISM), and it is believed that also PAHs contribute significantly to the heating process (Bakes & Tielens 1994). In a typical translucent cloud, such as L1780, heating takes place mainly through photoelectrons that are created when energetic photons from the interstellar radiation field (ISRF) hit dust grains. When heated by the solar neighborhood ISRF, large grains are able to remain at an equilibrium temperature, emitting mostly at far-infrared (FIR) wavelengths. On the other hand, when small grains or PAHs absorb an energetic UV photon they are temporarily heated to higher temperatures, which causes their temperature to fluctuate. While small grains, which radiate mostly at shorter wavelengths (below 100m), play a significant part in both the heating and cooling of clouds, their relationship to the large grains, their relative abundance, as well as their internal properties, are still incompletely understood.
COBE and ISO satellites extended the infrared observational range to longer wavelengths, enabling the measurement of the large-grain temperatures and emissivities. Observations show that the spectral energy distribution of the interstellar dust varies from the diffuse medium to molecular clouds and also from cloud to cloud. This probably implies changes in the dust composition, and especially variations in the abundance of VSGs and PAHs (Boulanger et al. 1990, Lagache et al. 1998, Verter et al. 2000). Variations in the abundances of grain populations within a single cloud have also been suggested (Bernard et al. 1992, 1993; Rawlings et al. 2005). Moreover, the observed very cold temperatures and changes in the emissivity of the large grains also suggest that the properties of the large grains change in regions of high dust column density in the interiors of molecular clouds (Bernard et al. 1999, Stepnik et al. 2003). In this paper, and in a subsequent paper, where a radiative transfer model of L1780 will be presented (Ridderstad et al., in preparation), we address some of the above questions through observations obtained towards the translucent cloud Lynds 1780.
Lynds 1780 (hereafter L1780; also listed as MBM 33 in Magnani, Blitz & Mundy (1985) is a high galactic latitude (, ) cloud with the size of . The brighter central part of the cloud was listed as a separate source, L1778, in Lynds’ (1962) catalogue. L1780 was classified as a cometary globule associated with Loop I by Tóth et al. (1995). It is located in the dark cloud complex that includes the clouds L134, L169, and L183 (L134N), and is likely to be physically associated with it (Clark & Johnson 1981). We refer to these clouds, including L1780, as the L134 complex. The distance to the L134 complex was determined to be 110 pc by Strömgren photometry (Franco 1989) and 140 pc by Vilnius photometry (Cernis & Straizys 1992). The NaI measurements by Lallement et al. (2003) indicate a distance of pc. In this paper, we adopt the distance of 110 pc.
The L134 complex is the northernmost extension of the Scorpius-Ophiuchus star-forming region and is located at the border of the Local Bubble (Kuntz, Snowden & Verter 1997, Lallement et al. 2003). In addition to L1780, also other clouds in this complex have displaced, cometary-like cores. In L183, very early phases of star formation are indicated (Ward-Thompson et al. 1994, 2000; Lehtinen et al. 2003). No star formation has been observed in L1780, although young H emission line stars with ages a few times years have been observed around L1780 (Martin & Kun 1996). One of these H stars has the same radial velocity as L1780 (Martin & Kun 1996), and they may be related to an old SNR expansion shell (Tóth et al. 1995, Martin & Kun 1996).
Observations of HI in L1780 have shown that, on its Southern half, the cloud has excess emission, which is probably caused by the UV-radiation of the bright OB stars in the direction of the galactic plane (Mattila & Sandell 1979). Tóth et al. (1995) discussed in detail the virial equilibrium conditions and the evolutionary history of L1780, and suggested that the cometary structure of the cloud is produced by the shock fronts of supernovae and stellar winds from the Sco-Cen association of OB stars. They also found that the 13CO core, which coincides with the IRAS 100m emission core, is in virial equilibrium.
The maximum optical extinction in the cloud has been estimated to be 4 mag by Mattila (1986). He also found a good correlation between CH column density and optical extinction in L1780. The HI and CO distributions in L1780 (Mattila & Sandell 1979, Tóth et al. 1995) were correlated with different IRAS band distributions, which suggested that there are different grain populations present in L1780, and their distributions are distinct from each other and related to the local physical conditions. Laureijs (1989) studied L1780 in the optical and infrared, and suggested that the optical excess red emission observed in the cloud by Mattila (1979) is analogous to that observed in the Red Rectangle (Schmidt, Cohen & Margon al. 1980). If this interpretation is correct, L1780 is so far the only translucent cloud in which this Extended Red Emission (ERE) has been observed.
In this paper, we study the 60m-200m emission of L1780 using ISO observations. We also compare these data with the IRAS observations at 12m and 25m to investigate the PAH abundance within L1780, as the radiation at 12m is generally believed to be due to PAHs, and the 25m emission is mainly from VSGs (Désert, Boulanger & Puget 1990). While the radiation at 60m is due to VSGs, the radiation at 100m-200m can be described as a modified blackbody emission from the ’classical big’ dust grains, which are in equilibrium with the surrounding radiation field. It is not entirely clear, to what extent the 100m emission contains a small-grain contribution; we compare our ISO raster scan observations to the current ISM dust model to address this question. However, since the small-grain contribution at 100m is small, the 100m-200m maps and raster scans can be used to effectively trace the domain of the large grains, which are responsible for most of the interstellar extinction at optical wavelengths and make up most of the dust mass. We use the 100m and 200m ISO observations to derive estimates on the dust temperature, column density and mass. From the 60m, 80m, 100m, 120m, 150m and 200m ISO raster scans, the spectral energy distributions (SEDs) and temperatures at selected positions of the cloud are obtained. 2MASS data are used to derive an optical extinction map. The locations of the maxima and the spatial distributions of the emission at different wavelengths are compared, and the distributions of the three dust components (PAHs, VSGs and the large grains) are estimated. We also compare our results on L1780 with the recent observations suggesting that the FIR emissivity of dust increases where low dust temperatures are observed (Cambrésy et al. 2001, del Burgo et al. 2003, Stepnik et al. 2003, Kramer et al. 2003).

2 Observations and data reduction
2.1 FIR observations
The observations were made with the ISOPHOT instrument aboard the Infrared Space Observatory (ISO) (Kessler, Steinz & Anderegg 1996) satellite, using the C100 and C200 detectors (Lemke et al. 1996) with the observing template PHT22 in raster mode. The data analysis was done with PIA (ISOPHOT Interactive Analysis) V10.0 (Gabriel et al. 1997). At the first processing level, the detector ramps were corrected for non-linearity in the detector response, glitches in ramps were removed using the two-threshold glitch recognition method, and the ramps were fitted with 1st order polynomials. At subsequent levels the signals were deglitched, reset interval correction was applied, signals were linearized for the dependence of the detector response on illumination, and orbital position-dependent dark currents were subtracted.
| Filter | TDT | Raster steps | Map size | Camera | |||
|---|---|---|---|---|---|---|---|
| m | m | m | |||||
| C100 | 100 | 102.6 | 47.1 | 43100630 | 1824 | C100 | |
| C200 | 200 | 202.1 | 56.9 | 43199629 | 1313 | C200 | |
| C60 | 60 | 61.8 | 24.6 | 43100206 | 216 | C100 | |
| C70 | 80 | 80.7 | 48.4 | 43100207 | 216 | C100 | |
| C100 | 100 | 102.6 | 47.1 | 43100208 | 216 | C100 | |
| C120 | 120 | 118.7 | 49.5 | 43100209 | 213 | C200 | |
| C135 | 150 | 155.1 | 81.2 | 43100212 | 213 | C200 | |
| C200 | 200 | 202.1 | 56.9 | 43100210 | 213 | C200 |
Table 1 shows the parameters of the individual observations. All the maps were calibrated using the FCS (Fine Calibration Source) measurements bracketing the actual measurements. The sizes of the map pixels of the C100 maps and the C200 maps are 43.5 and 89, respectively. A typical statistical uncertainty is 0.2 MJy sr-1 for a map pixel of the large 100m map and 1.2 MJy sr-1 for a 200m map pixel. For the raster scans, the average uncertainties are 0.4, 0.4, 0.3, 1.5, 0.1 and 0.2 MJy sr-1 for a 60m, 80m, 100m, 120m, 150m and 200m map pixel, respectively. The uncertainty in the absolute calibration is 25% for the C100 and 20% for the C200 data (Klaas et al. 2000).
For the flat-field correction of the large C100 and C200 maps a statistical method was applied: the pixel values were correlated against the reference pixel at each raster position. Rather than comparing the reference pixel only with pixels belonging to the same raster position, a mean of two pixels located symmetrically around the reference pixel was taken. This reduces the scatter in the pixel-to-pixel relation caused by surface brightness gradients. For the flat-fielding of the ISO raster scans, a similar procedure was used. The value of the reference pixel was calculated as a weighted average using a Gaussian that was placed at the position of the studied pixel and had a FWHM of 2.0. For both the large ISO maps and the raster scans the reference pixels were chosen to be the pixels number 8 and 3 in the C100 and C200 rasters, respectively. The data from pixel no 3 of the ISO 60m raster scan was of such bad quality that it was replaced by the average of the values of the surrounding raster pixels.
It is known that the primary intensity calibrators, the fine calibration source (FCS) measurements used to derive the responsivities of the detectors, suffer from signal transients in the case of the C100 camera. Lehtinen et al. (2001) showed that even after these transients were corrected using the PIA signal drift interface, there remained a difference of 20% between the 100m ISO and DIRBE surface brigtnesses. Therefore, the C100 measurements on L1780 were compared with DIRBE.
IRAS data was first scaled to DIRBE scale using the relation that was derived for a diameter circular region around L1780. A linear fit ISO vs. scaled IRAS values gave . In the comparison both DIRBE and ISO observations were color corrected assuming a spectrum . The larger 100m map was scaled to the DIRBE surface brightness scale using this relation, and the 100m raster scan was adjusted to the same level with the scaled raster map.
The 60m raster scan values were similarly scaled to DIRBE via IRAS, using the relations and . No color correction was applied since at 60m the dust spectrum is rather close to a flat spectrum, constant. We also compared the values calculated from the zodiacal light model of Good (1994), to the corresponding empty-sky values of the 60m raster map (raster position within the circle marked in Fig. 1f) that were color corrected for a 270 K black body spectrum. This gave the relation . We took the average of the two scaling factors, obtaining as the final scaling relation.
The 80m data was scaled by linearly interpolating the scaling coefficients for the 60m and 100m ISO data, which gave 0.71 as the scaling coefficient for 80m.
The IRAS 12m and 25m Infrared Sky Survey Atlas (ISSA) map data were re-scaled to DIRBE scale using the relations and , as given in the ISSA Explanatory Supplement (Wheelock et al. 1994).
The ISO 200m map surface brightness values were also compared with DIRBE data. There are only 4 DIRBE pixels within the 200m map area. The DIRBE surface brightness values at 100m, 140m and 240m were fitted with a modified blackbody function with emissivity law in order to get interpolated values at 200m. The ISO 200m map was convolved with a scan-averaged DIRBE beam and the ISO surface brightness values were color corrected using the temperatures derived from fitting the DIRBE values. A linear fit forced to go through the origin gives , which is well within the estimated uncertainties of the ISO data. Since this fit is made based on four points only, which results in considerable uncertainty, and the C200 detector does not suffer from such problems as described above for the C100 detector, we retain the FCS based calibration for the 200m and other C200 ISO data (the 120m and 150m data).
The sky area used for subtracting the background values in the 100m and 200m maps is shown in Fig. 1a. The background sky values for background subtraction for all the six raster scans and the IRAS data used were determined at the same position outside the cloud (Fig. 1f); this way we obtained a common zero level for comparison with the raster scans. To compare the six raster scans with each other, we calculated average values at 16 evenly-spaced positions along the C100 scans, and at 13 positions along the (shorter) C200 scans (see Fig. 1f for these positions; three C100 positions in the west fall outside the figure). The averaging was done using a Gaussian weight function with FWHM=4.5. This resolution also corresponds to the resolution of the ISSA maps.

2.2 Extinction data
An extinction map of L1780 was derived using the , and band magnitudes obtained from the 2MASS archive. The extinction measurements are based on the near-infrared (NIR) color excesses of stars visible through the cloud. We applied the optimized multi-band NICER technique of Lombardi & Alves (2001), which is a generalization of the traditional color excess method (using data on two bands only), to derive the NIR color excesses.
Stellar density of the detected stars at all three bands is fairly constant over the map, with an average of about one star per square arcminute. As the reference field, representing an area without significant extinction, we selected a 1 diameter circular area located close to L1780 and at the same galactic latitude. The coordinates of the centre of this area are R.A.(J2000), Dec.(J2000). The colors of the stars in the reference field have the mean values and standard deviations of and . As the effective wavelengths of the 2MASS , and bands we use 1.25m, 1.65m and 2.17m, respectively (Kleinmann et al. 1994). For the ratios of visual extiction to color excess we used the values and , which correspond to an extinction curve with (Mathis 1990).
The extinction value in each map pixel was derived from the individual extinction values of the stars by applying the sigma-clipping technique of Lombardi & Alves (2001). In order to obtain a sufficient signal-to-noise ratio in the map, the individual extinction values were averaged using a Gaussian with FWHM=3.0.
The extinction map has two error sources, the variance of the intrinsic colors and , and the variance of the observed magnitudes of the field stars. The former dominates with a 1 error of per pixel, while the latter gives a 1 error of per pixel, resulting in a typical total error of 0.47 mag in .
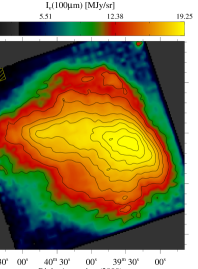
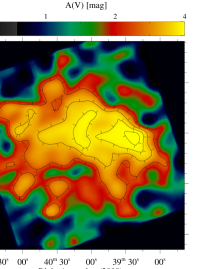
The map of visual extinction is shown in Fig. 1c. At the resolution of 3.0 the value of maximum extinction is 4.0 mag.
When the extinction data is compared with the 100m and 200m surface brightness, temperature and optical depth maps, the latter are convolved to this resolution.


3 Results
3.1 General structure of the FIR emission from L1780
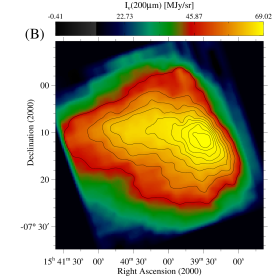
The 100m and 200m surface brightness maps are shown in Fig. 1a and Fig. 1b. In the far-infrared, L1780 has a clearly visible brighter central core in the West, which coincides with the region of maximum optical extinction. On the opposite side, the cloud has an extended, tail-like structure, and an overall cometary shape.
The relation between the 100m and the 200m emission is shown in Fig. 2. The 100m emission is well correlated with the 200m emission, and the relation is linear up to the highest surface brightness values, where there is a slight flattening trend. The solid lines in the figure show the surface brightness ratios at the indicated temperatures, assuming a modified blackbody function with dust emissivity power law index .
As can be seen in Fig. 1f, the IRAS 60m maximum is distinct from the 100m/200m maximum, and is situated East of it. The 25m, the 12m and the 6.7m maxima are located still further to the East, reaching towards the SE edge of the cloud. The 100m and 200m maps do not show any structure at the locations of these maxima.
The 13CO core of L1780 is in virial equilibrium (Tóth et al. 1995). However, no point sources, neither those from the IRAS Point Source Catalog nor any new ones, are detectable in the ISO maps. Also, a J-H vs. H-K color excess plot made using 2MASS data reveals no stars with color excess 1.0 mag in L1780. This leads to the conclusion that there is no (detectable) star formation activity in L1780.
3.2 Surface brightness ratios from ISO raster scans and IRAS observations
In Fig. 1f, the positions of the ISO raster scans, which go through the cloud from West to East and back, are shown. Fig. 3a shows the intensities of the raster scans averaged (using Gaussian beams with FWHM=4.5) at the positions marked with circles in Fig. 1f.
All the raster scans go through the high density core of L1780 and the regions of the maximum 12m, 25m and 60m emission. The maxima of the 120m-150m emission coincide with the maximum of the 200m emission, whereas the positions of the 60m and the 80m maxima are shifted towards East. The shape of the 100m brightness profile is between the shapes of the 80m and the 120m, especially in the region of maximum emission.
Fig. 3a also shows the values of the IRAS 12m and 25m observations calculated at the same positions as the raster scans. The maximum of the IRAS 25m emission is located between the 60m maximum and the 12m maximum on the Eastern side of L1780.
Fig. 3b shows the intensity ratios 12m/60m; /100m, where is 12m, 25m or 60m; and /200m, where is 60, 80m, 100m, 120m or 150m, plotted through the cloud from East to West (the intensities have been calculated as in Fig. 3a). The cold core of L1780 shows up as a minimum in all the curves. The ratios /100m and 60m/200m rise steeply towards the Eastern side of the cloud, indicating an increased presence of the small-grain dust component. The ratio 12m/60m peaks at the maximum position of the 12m emission in L1780, indicating the presence of PAHs in this location. The ratios 80m/200m and 100m/200m show a deep minimum at the core of 1780, while the ratios 120m/200m and 150m/200m show only a slight drop at this location, the 150m/200m ratio being almost constant.
In Fig. 4, the 60-150m surface brightness values of the raster scans are plotted against the 200m scan values. All the wavelengths correlate well with the 200m intensity. However, with the exception of the 150m vs. 200m relation, all curves clearly show signs of flattening close to the 200m maximum.
| Raster position 4 | Raster position 6 | Raster position 9 | ||||
|---|---|---|---|---|---|---|
| [MJy/sr] | [MJy/sr] | |||||
| 12m | 1.06 | 0.21 | 0.85 | 0.17 | 0.52 | 0.10 |
| 25m | 1.55 | 0.31 | 1.36 | 0.27 | 0.95 | 0.19 |
| 60m | 2.56 | 0.65 | 2.92 | 0.69 | 2.24 | 0.62 |
| 80m | 4.48 | 0.87 | 6.09 | 1.06 | 5.94 | 1.05 |
| 100m | 7.27 | 1.04 | 9.78 | 1.34 | 10.69 | 1.44 |
| 120m | 17.76 | 1.93 | 23.39 | 2.51 | 28.86 | 3.09 |
| 150m | 26.90 | 2.84 | 35.19 | 3.69 | 46.84 | 4.90 |
| 200m | 24.88 | 2.73 | 32.98 | 3.60 | 46.59 | 5.02 |
3.3 Dust temperature and the spectral energy distribution
The temperature of dust has been derived, pixel by pixel, from the 100m and 200m ISO surface brightness maps by using a modified blackbody function
| (1) |
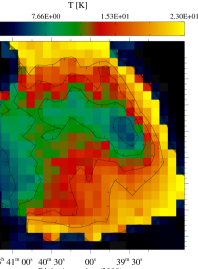
where is the dust emissivity power law index, and is the Planck function. We assume . For the temperature calculation, the 100m map was convolved to the resolution of the 200m map. The surface brightness values were iteratively color corrected, using the color correction coefficients based on previous temperature determination, until the differences between two consecutive iterations were below 0.1 K. The temperature map is shown in Fig. 1e. At the resolution of 1.5, the minimum temperature is 14.9 K.
The temperature of L1780 has also been determined using the ISO raster scans. Fig. 5 shows the SEDs at three positions along the scan: Figs. 5a, 5b and 5c correspond to the locations of the IRAS 12m, the IRAS 60m and the ISO 100m emission maxima, respectively (see Fig. 1f for the locations of these maxima in L1780). In addition to the ISO raster scan values at 60-200m, the IRAS 12m and 25m values are plotted in the figure. Modified blackbody curves with dust emissivity index have been fitted to the four longest wavelengths, resulting in temperatures 15.0 K, 15.0 K and 14.1 K, for Figs. 5a, 5b and 5c, respectively. These temperatures are in agreement with the values obtained using the large 100m and 200m ISO maps. In the fitting, the statistical errors (from PIA) plus filter-to-filter errors of 10% have been used for the ISO C200 values (120m, 150m and 200m). The error used for the 100m values is the statistical error plus a 10% error resulting from the uncertainty of the scaling of the 100m to DIRBE. The average value of all the fits was slightly below 2. In Fig. 5 the 80m are 2 above the fitted curves. The ratio of the mid-infrared intensity (average of the 12m and 25m intensities) to the FIR intensity (maximum of the blackbody fit at the three longest wavelengths) is 0.045 for the IRAS 12m maximum region (Fig. 5a), 0.029 for the IRAS 60m maximum (Fig. 5b) and 0.013 for the ISO 100m maximum (Fig. 5c). All the surface brightnesses and errors used in Fig. 5 are given in Table 2.


3.4 FIR-optical depth and cloud mass
The optical depth at 200m has been calculated from the equation
| (2) |
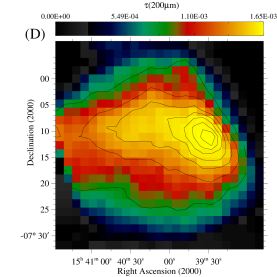
which is valid for optically thin emission and where is the observed intensity and the intensity of a blackbody at the temperature . The optical depth map is shown in Fig. 1d. The maximum value of the 200m optical depth is 2.0 at the resolution of 1.5.
To calculate the mass of the cloud we first derived the ratio between the FIR optical depth and the hydrogen column density, i.e. the average absorption cross section per H-nucleus
| (3) |
The NIR extinction can be used to estimate the total hydrogen column density, in L1780. We adopt the value , valid for diffuse clouds (Bohlin, Savage & Drake 1978), together with to obtain . The relation between and is shown in Fig. 6a. A linear fit, , also shown in the figure, gives per H-atom for the absorption cross section, which is in agreement with values for diffuse ISM by Dwek et al. (1997) ( per H-atom). The relation in Fig. 6a deviates from linearity in the region of highest density in L1780; see Section 4.3 for discussion.
The total mass (gas plus dust) of L1780 has been calculated using the equation
| (4) |
where is the 200m optical depth, is the absorption cross section per H-nucleus for which we have used the value derived above, is the distance, is the hydrogen mass, and is the mean molecular weight. The mass has been derived by summing up the pixels of the map. The mass thus obtained for L1780 is .

3.5 Comparison of FIR and extinction data
At large scale, the far-infrared emission in L1780 correlates well with the optical extinction. The 100m, 200m and maps in Figs. 1a, 1b and 1C show that the 100m and the 200m emission maxima coincide with the location of the highest visual extinction. The relations between the 100m and the 200m emission and the visual extinction are linear (Fig. 7).
In the map, there seems to be another region of higher visual extinction, an arc-like structure, on the Eastern side of the 100m core. If real, this feature, together with the cometary shape of L1780, could result from the propagation of a shockwave from the SW direction through the cloud as has been suggested by Tóth et al. (1995). In fact, the arc-like feature could also be a part of a ring-shaped structure, in which case an interesting analog of a possible dense-core formation would be found in the Globule 2 of the Coalsack cloud (Lada et al. 2004). However, the extinction values may be biased because of variations in the stellar density. This hampers the detection of morphological features in the map at this resolution, which is close to the detection limit ( in the contours in Fig. 1c).
Figs. 6 and 8 show the relations between , m) and . The values from the locations of the IRAS 12m, IRAS 60m and ISO 100m maxima are marked with triangles, diamonds and squares, respectively. The sizes of sky areas of the maxima have been chosen according to the highest-level contours visible in Fig. 1f, and are , , and for the 12m, 60m and 100m maximum, respectively. The error bars in the figures show typical errors. The errors of the temperature and the 200m optical depth get larger for the points near to the borders of the maps, since near the borders of the ISO FIR maps the background-subtracted surface brigthness values, used for calculating and m), are more uncertain. For the plots in Figs. 6 and 8, most of the near-border points have been removed.
Fig. 6d shows the temperature decrease in the densest part of the cloud: as the optical depth increases, the temperature decreases from 15.8 K in the regions of the 12m emission maximum (PAHs) and the 60m maximum (VSGs) to 14.9 K in the 100m maximum region (big grains). In Fig. 6b, similar dependence is shown for the temperature as the function of the visual extinction. Fig. 6a shows increased emissivity in the regions of high in L1780 (see Section 4.3 for discussion).


| Color | SN | |||
|---|---|---|---|---|
| 12/100 | 0.10 | 0.20 | 0.05 | 0.042 |
| 25/100 | 0.16 | 0.26 | 0.07 | 0.054 |
| 60/100 | 0.31 | 0.42 | 0.21 | 0.21 |
| 12/25 | 0.59 | 0.85 | 0.29 |
4 Discussion
4.1 Different dust populations from FIR observations
The Southern side of L1780 is facing both the Galactic plane in the South and the Upper Scorpius (USco) association of OB stars in the SW direction, and is, therefore, subject to more intense ISRF. However, the variations in the emission of L1780 at different wavelengths are more prominent in the E-W direction than on the S-N axis. Fig. 1f shows that the 12m emission maximum (indicating the presence of PAHs) is located on the SE side, in the “tail” of L1780. The 60m (VSGs) emission maximum is located to the West from the 12m maximum, and finally, the 100m maximum (big grain emission) is on the Western side of the cloud.
In Fig. 3a, the 60m emission curve clearly rises towards East and has its maximum on the Eastern side of the 200m maximum. Fig. 3b shows that the 60m/100m ratio rises rather steeply from its minimum towards the East side of L1780. In Table 3, it can be seen that the minimum value of this color ratio (reached in the cold core of L1780) is the same as the solar neighborhood (SN) value by Boulanger et al. (1990). Laureijs, Clark & Prusti (1991), who made IRAS observations on the L134 complex, indicate in their study of L1780 that the 60m emission diminishes in a narrow transition layer around the 100m maximum. Our data do not show any abrupt change, but the decrease in the 60m/100m ratio is clear: the ratio is halved in the cold core region relative to the Eastern edge of the cloud. It is not likely that this reduction would be due to attenuation effects alone: in the model by Bernard et al. (1992) the effect of radiation attenuation on the ratio 60um/100m as Av increases from 1 to 4 mag (between different 1D models) is only half of the decrease of the ratio observed in L1780.
Laureijs, Clark & Prusti (1991) attribute the change in 60um/100m to the formation of icy mantles on grains. Stepnik et al. (2003) shows that the depletion of VSGs through grain-grain coagulation can reduce the 60um/100m ratio, and, in addition, cause an increased FIR emissivity of grains, which is also observed in L1780. Fig. 6c shows the increased values of in the region of the 100m emission maximum (marked with squares in Figs. 6b and 6c). On the other hand, if taken to be traced by the ratio, no difference in the overall size distribution of the large grains between the 60m and 12m maxima is visible in Fig. 6c, although the 60m maximum is located deeper in the cloud.
Figs. 3a and 3b show that the emission from VSGs and PAHs is concentrated on the Eastern side of L1780, and that the PAH emission clearly is distinct from the VSG emission. Also the MIR/FIR ratios from Fig. 5 indicate increase of the 12m-60m emission toward the East. For the 12m/100m ratio, comparison with the results of the model of Bernard et al. (1992) suggests that radiative transfer effects account for less than one third of the decrease of the ratio in the L1780 core. Table 3 shows that the average colors 12m/100m and 25m/100m are more than twice the SN values. At the scan positions of the 12m and 25m maximum emission, the values of 12m/100m and 25m/100m are 0.15 and 0.18, corresponding to 3.6 and 3.3 times the SN value. The maximum 12m/100m and 25m/100m ratios observed in L1780 are both 4.8 times the SN value. These values can be compared with those of two clouds from Chameleon and -Ophiuchi, which are 5.5 and 3.3 times the SN value for PAHs (using the 12m/100m ratio), respectively, and 2.3 and 2.3 times the SN value for VSGs (using the 25m/100m ratio), respectively, (Bernard, Boulanger & Puget 1993). The color ratios observed in L1780 indicate that there is an overabundance of PAHs and VSGs on the Eastern side of the cloud. Further support to our observations on PAH abundance is provided by the strong decrease of the 6.5/100m ratio in the FIR core of L1780 observed by Miville-Deschênes (2002) using ISOCAM and IRAS observations.
We conclude that, although attenuation effects may be involved, they are not sufficient to explain the observed color ratios, which indicate true variations in the abundances of dust grains from different populations. To estimate the effect of radiation attenuation on the observed color variations in L1780, model calculations are needed (Ridderstad et al., in preparation).
4.2 VSG contribution at the wavelengths above 80m
Radiative transfer modelling performed using the current ISM models (including PAHs, VSGs and big grains) indicates that the emission from VSGs is still significant above 60m, and contributes from 15% to 23% of the total emission at 100 m when ranges from 1 to 4 mag (Désert, Boulanger & Puget 1990). Laureijs et al. (1996) made ISOPHOT observations at 60m, 90m, 135m and 200m on a small cloud in Chameleon, which, like L1780, has a reduced 60m/100m ratio in the centre, and indicated that the 90m emission has an excess contribution from dust grains emitting at 60m.
In Fig. 9, the 200m raster scan has been assumed to contain emission solely from the big-grain dust component, which then has been subtracted from the 80m, 100m and 120m raster scans after scaling the latter using a ratio / determined at the cloud center, i.e. at the 200m maximum position (position 9 in Figs. 3a):
| (5) |
The remaining part, , represents excess that can be attributed to small grain emission, assuming that no temperature change of big grains resulting from the increase of is taken into account. In reality, the always contain also the effect from radiation attenuation; thus, Fig. 9 gives an upper limit to the VSG contribution. Fig. 9 shows that the 200m-subtracted intensities peak at the maximum position of the 60m emission. Our results indicate that, at the maximum position of the 60m emission, at most 12% of the 120m emission, 22% of the 100m emission and 28% of the 80m emission is from VSGs. When it is taken into account that the ISO filter bandpasses overlap, this is consistent with the current ISM dust model (see Désert, Boulanger & Puget 1990).
4.3 Increased FIR emissivity in the dense core of L1780
Many recent studies indicate a change in the emissivity of interstellar grains in dense molecular regions (Cambrésy et al. 2001; del Burgo et al. 2003; Dupac et al. 2003; Kramer et al. 2003; Stepnik et al. 2003; Cambrésy, Jarrett & Beichman 2005). Also in our study, Fig. 6a shows that in the cold core of L1780 (the region of the FIR emission maximum and minimum temperature ) above , the relation between m) and deviates from linearity, indicating an increased emissivity of the big grains. This increase in the ratio m)/ in the 100m emission maximum area is also visible in Fig. 6c. The emissivity observed in the cold core of L1780 in Fig. 6a is 1.5 times the values observed elsewhere in the cloud. This value is in agreement with the results of Cambrésy, Jarrett & Beichman (2005), who considered the whole galactic anticenter hemisphere and found that, for regions with mag, the ratio of FIR optical depth to NIR extinction is (FIR)/(gal)=1.31.
Del Burgo et al. (2003) found FIR emissivity changes in their 60-200m observations of eight regions mostly belonging to quiescent high latitude clouds with mag. Since L1780 is also a translucent cloud, their results are of particular interest here. Del Burgo et al. (2003) presented a model with two big-grain dust components: a warm component at T=17.5 K and a cold component at T=13.5 K. A coefficient gives the factor by which the emissivity of the cold component is increased. In Fig. 8, the curves showing the emissivity change according to the model by del Burgo et al. (2003) are shown for comparison with our data. Comparison with the results of del Burgo et al. (2003) indicates that the emissivity in the core of L1780 is about twice of that for the diffuse ISM, which is in agreement with the value derived from the relation in Fig. 6a. Although the uncertainty in Fig. 8 increases with increasing temperature, it is clear from the average errors (shown by error bars in the figure) that there is an increasing trend towards high values. It must be noted that in this kind of plot, the dependance of the optical depth on the dust temperature (since the former is calculated using the latter) can cause false correlation similar to the supposed emissivity increase. However, the errors in the plot in Fig. 8 diminish towards high optical depth and low temperature. We also have the advantage that the measurements are from a single cloud, which eliminates the effects resulting from calibration errors between separately calibrated maps.
The ratio increases with grain size and porosity (Cambrésy et al. 2001), and the change in FIR/submm emissivity has been attributed to the coagulation of grains into larger, fluffy particles in dense, cold molecular regions (Cambrésy et al. 2001, Stepnik et al. 2003). It is interesting that an independent indicator, the decrease of the 60m/100m ratio towards the dense core of many clouds, including L1780, has also been attributed to grain coagulation (Bernard et al. 1999, Stepnik et al. 2003). While the emissivity change in L1780 is seen above 3.5 mag, Stepnik et al. (2003) derived the threshold value for the possibly coagulation-induced changes (reduced 60m/100m ratio and increased emissivity) in the properties of the grains to occur. They noted that these changes in the properties of dust grains may be part of a general transformation process that dust undergoes in the dense ISM. Moreover, Cambrésy, Jarrett & Beichman (2005) indicate that large, fluffy grains may be common all over the galaxy wherever .
5 Conclusions
The analysis of the ISO 100m and 200m maps and 60m, 80m, 100m, 120m, 150m and 200m raster scans of L1780, combined with the IRAS 12m and 25m data and the visual extinction map (based on NIR , and band color excess data), leads to the following conclusions:
-
-
The 100m emission is well correlated with the 200m emission throughout the cloud. The cloud has a single core, revealed by the 100m and 200m emission, the FIR optical depth, and the visual extinction.
-
-
The spatial distributions of the 12m, 25m and 60m emission differ significantly from the emission at longer wavelengths. This indicates the presence of separate dust components with different physical properties and spatial distributions.
-
-
The maximum values of the color ratios 12m/100m, 25m/100m and 60m/100m, which are 4.8, 4.8 and 2.0 times the solar neighborhood values, indicate an overabundance of PAHs and VSGs in L1780.
-
-
The map gives a maximum visual extinction of 4 mag at 3.0 resolution. The visual extinction is well correlated with the FIR emission at large scale.
-
-
The cold core of L1780 has the minimum temperature of 14.9 K and the maximum 200m optical depth of 2.0 at 1.5 resolution.
-
-
The value of the absorption cross section per H-atom at 200m has been estimated to be per hydrogen atom, which is in good agreement with values obtained for diffuse ISM in other studies. The mass obtained for L1780 is 18.
-
-
The relation between and shows nonlinearity at high values, indicating that in the cloud core the far-infrared dust emissivity has increased by a factor of 1.5.
-
-
The comparison of the 80m and the 100m emission with the emission at longer wavelengths indicate that not only the 80m, but also the 100m and even the 120m emission may contain some small-grain contribution.
Acknowledgements.
The work of M.R. has been supported by the Magnus Ehrnrooth Foundation and the Finnish Graduate School in Astronomy and Space Physics, which is gratefully acknowledged. The work of M.J. and K.L. has been supported by the Finnish Academy through grants Nos. 17854 and 176071. We thank the referee, Jean-Philippe Bernard, for very helpful comments.This publication makes use of data products from the Two Micron All Sky Survey, which is a joint project of the University of Massachusetts and the Infrared Processing and Analysis Center/California Institute of Technology, funded by the National Aeronautics and Space Administration and the National Science Foundation. Also, this research has made use of NASA/IPAC Infrared Science Archive.
References
- (1) Bakes E.L.O. & Tielens A.G.G.M., 1994, ApJ 499, 258
- (2) Bernard J.P., Boulanger F., Désert F.X. & Puget J.L., 1992, A&A 263, 258
- (3) Bernard J.P., Boulanger F., & Puget J.L, 1993, A&A 277, 609
- (4) Bernard J.P., Abergel A., Ristorcelli I. et al., 199, A&A 347, 640
- (5) Bohlin R.C., Savage B.D. & Drake J.F., 1978, ApJ 224, 132
- (6) Boulanger F., Falgarone E., Puget J.L. & Helou G., 1990, ApJ 364, 136
- (7) del Burgo C., Laureijs R.J., Ábrahám P & Kiss, Cs., 2003, MNRAS 346, 403
- (8) Cambrésy L., Boulanger F., Lagache G. & Stepnik B., 2001, A&A 375, 999
- (9) Cambrésy L., Jarrett T.H. & Beichman C.A., 2005, A&A 435, 131
- (10) Cernis K. & Straizys V., 1992, Baltic Astronomy 1, 163
- (11) Clark F.O., & Johnson D.R., 1981, ApJ 247, 104
- (12) Désert F.-X., Boulanger F. & Puget J.L., 1990, A&A 237, 215
- (13) Dupac X., Bernard J.-P., Boudet N. et al., 2003, A&A 404, L11
- (14) Dwek E., Arendt R.G., Fixsen D.J. et al., 1997, ApJ 475, 565
- (15) Franco G.A.P., 1989, A&A 223, 313
- (16) Gabriel C., Acosta-Pulido J., Heinrichsen I. et al., 1997, in Proc. of the ADASS VI conference, ASP Conf. Ser. 125, Eds. G. Hunt and H.E. Payne, 108
- (17) Good J.C., 1994, in IRAS Sky Survey Atlas: Explanatory Supplement, Eds. S.L. Wheelock et al., JPL Publication 94-11, G1-G14
- (18) Kessler M.F., Steinz J.A. & Anderegg M.E., 1996, A&A 315, L27
- (19) Klaas U., Laureijs R.J., Radovich M., Schultz B & Wilke K., 2000, “ISOPHOT Calibration Accuracies”, Ver 3.0, January 2000
- (20) Kleinmann S.G., Lysaght M.G., Pughe W.L. et al., 1994, Experimental Astronomy 3, 65
- (21) Kramer C., Richer J., Mookerjea B., Alves J., Lada C. et al., 2003, A&A 399, 1073
- (22) Kuntz K.D., Snowden S.L. & Verter F., 1997, ApJ 484, 245
- (23) Lada C.J., Huard T.L., Crews L.J. & Alves J.F., 2004, ApJ 610, 303
- (24) Lagache G., Abergel A., Boulanger F. & Puget J.-L., 1998, A&A 333, 709
- (25) Lallement R., Welsh B.Y., Vergely J.L., Crifo F. & Sfeir D., 2003, A&A 411, 447
- (26) Laureijs R., 1989, PhD Thesis, Rijksuniversiteit te Groningen, the Netherlands
- (27) Laureijs R.J., Clark F.O. & Prusti T., 1991, ApJ 372, 185
- (28) Laureijs R.J., Haikala L., Burgdorf M. et al., 1996, A&A 315, L317
- (29) Lehtinen K., Mattila K., Russeil D., Lemke D. & Haikala L.K., 2001, in Proc. of the conference “The Calibration Legacy of the ISO Mission”, VilSpa, Spain, 5-9 February 2001, ESA SP-481, 2003, Eds. Metcalfe L., Salama A., Peschke S.B. & Kessler M.F.
- (30) Lehtinen K., Mattila K., Lemke D. et al., 2003, A&A 398, L571
- (31) Lemke D., Klaas U., Abolins J. et al., 1996, A&A 315, L64
- (32) Lombardi M. & Alves J., 2001, A&A 377, 1023
- (33) Lynds B.T., 1962, ApJS 7, 1
- (34) Magnani L., Blitz L. & Mundy L., 1985, ApJ 295, 402
- (35) Martin E.L. & Kun M., 1996, A&A Suppl. Ser. 116, 467
- (36) Mathis J.S., 1990, ARA&A 28, 37
- (37) Mattila K., 1979, A&A 78, 253
- (38) Mattila K., 1986, A&A 160, 157
- (39) Mattila K. & Sandell G., 1979, A&A 78, 264
- (40) Miville-Dechênes, M.-A., 2002, in Proc. of the conference “Chemistry as a Diagnostic of Star Formation”, Univ. of Waterloo, Canada, 21-23 August 2002, Eds. Curry C.L. and Fich M.
- (41) Rawlings M.G., Juvela M., Mattila K., Lehtinen K. & Lenke D., 2005, MNRAS 356, 810
- (42) Schmidt G.D., Cohen M. & Margon B., 1980, ApJ 239, L133
- (43) Stepnik B., Abergel A., Bernard J.-P. et al., 2003, A&A 398, 551
- (44) Tóth L.V., Haikala L.K., Liljeström T. & Mattila K., 1995, A&A 295, 755
- (45) Verter F., Magnani L., Dwek E. & Rickard L.J., 2000, ApJ 536, 831
- (46) Ward-Thompson D., Scott P.F., Hills R.E. & Andre P., 1994, MNRAS 268, 276
- (47) Ward-Thompson D. & Andre B., 2000, in “ISO Survey of a Dusty Universe”, Proc. of a Ringberg Workshop, Tegernsee, Germany, 8-12 November 1999, Eds. Lemke D., Stickel M. and Wilke K., Lecture Notes in Physics 548, 309
- (48) Wheelock S.L., Gautier T.N. III, Chillemi J. et al., ISSA Explanatory Supplement at http://lambda.gsfc.nasa.gov/product/iras/docs/issa.exp.sup/