Swift observations of the prompt X-ray emission and afterglow from GRB050126 & GRB050219A.
We report on the temporal and spectral characteristics of the early X-ray emission from the Gamma Ray Bursts GRB050126 and GRB050219A as observed by Swift. The X-ray light-curves of these 2 bursts both show remarkably steep early decays (), breaking to flatter slopes on timescales of a few hundred seconds. For GRB050126 the burst shows no evidence of spectral evolution in the 20-150 keV band, and the spectral index of the -ray and X-ray afterglows are significantly different suggesting a separate origin. By contrast the BAT spectrum of GRB050219A displays significant spectral evolution, becoming softer at later times, with evolving toward the XRT photon index seen in the early X-ray afterglow phase. For both bursts, the 0.2-10 keV spectral index pre- and post-break in the X-ray decay light-curve are consistent with no spectral evolution. We suggest that the steep early decline in the X-ray decay light-curve is either the curvature tail of the prompt emission; X-ray flaring activity; or external forward shock emission from a jet with high density regions of small angular size (). The late slope we associate with the forward external shock.
Key Words.:
gamma-ray: bursts – Gamma-rays, X-rays: individual(GRB050126, GRB050219A)1 Introduction
The Swift Gamma-Ray Burst Explorer (Gehrels et al. 2004), launched 2004 November 20 is now routinely observing the prompt gamma-ray and afterglow emission of Gamma-Ray Bursts (GRBs) in the astrophysically important minutes to hours timescale after the burst trigger. With its unique autonomous pointing capability, Swift is able to slew its narrow-field instruments, the X-Ray Telescope (XRT, Burrows 2005) and UltraViolet-Optical Telescope (UVOT, Roming et al. 2005) to the burst position on timescales of less than 100 s, opening up to scrutiny a largely unexplored region of parameter space.
The greater sensitivity over previous gamma-ray missions of the Burst Alert Telescope (hereafter BAT, Barthelmy 2004) together with Swift’s rapid pointing capability, allows prompt localisations ( a few arcseconds) of relatively faint GRB afterglows, essential for ground-based follow-up. Swift can therefore not only study fainter bursts, but also the early afterglows during a phase in which they are many orders of magnitude brighter. During the course of its 3-year mission Swift will deliver unique insights as to the nature of the prompt and early afterglow emission as well as probing the faint end of the GRB luminosity function.
Here we report on Swift observations of GRB050126 and GRB050219A (see also Tagliaferri et al. 2005; Nousek et al 2005; and Chincarini et al. 2005, for a discussion of the average early X-ray light-curve behaviour of a sample of Swift detected GRBs), two bursts for which we have early observations (within 100 s) in the XRT and which show similar behaviour in their prompt X-ray light-curves. In §2 we describe the data taken for each burst in succession and present in detail a temporal and spectral analysis of the BAT and XRT data. In §3 we place the observations in the context of theoretical models of the GRB and afterglow emission. Our conclusions are presented in §4.
2 Observations
2.1 GRB050126
The BAT triggered on GRB050126 at 12:00:54 UT Jan 26th 2005 (Sato et al. 2005). The spacecraft autonomously slewed to the burst location and was settled on target at 12:03:04 UT. Before the slew, the XRT was in manual state taking calibration observations of Mkn 876 in Photon Counting (PC) mode. Thus the first 278 s of observations were taken in PC mode only. Ground analysis of the early PC mode data identified a new bright source at position RA(J2000) 18:32:27.0, Dec(J2000) +42:22:13.5 with an estimated uncertainty of 8 arc-seconds (Kennea et al. 2005; Campana et al. 2005a,b).
2.1.1 BAT spectrum and light-curve of GRB050126
Analysis of BAT calibration targets during the mission verification phase shows that the early BAT response matrix (build 11) under-predicts the flux by 20-30% at energies below 20 keV and predicts an excess of emission at energies above 100 keV. The BAT event data described here were re-analysed using the standard BAT analysis software (build 14) as described in the Swift BAT Ground Analysis Software Manual (Krimm, Parsons, & Markwardt 2004), which incorporates post-launch updates to the BAT spectral response and effective area and includes the systematic error vector which must be applied to all BAT spectra111see http://swift.gsfc.nasa.gov/docs/swift/analysis/bat_digest.html.
GRB050126 is characterised by a single broad peak with fast rise ( s), and exponential decay (FRED) and total duration s ( s; Fig 1). The total fluence is ( erg cm-2 (15–350 keV) and the peak five second flux is 0.4 ph cm-2 s-1. The spectrum is consistent with an unabsorbed power-law with photon index (where ) in the 20–150 keV band, for 53 dof (Sato et al. 2005). A cut-off powerlaw does not significantly improve the fit ( for 52 dof), and the high-energy cut-off is unconstrained by the data (Table 1). We find no evidence for spectral evolution in the BAT data for this source. From 12:02:32 UT onward (ie. 98 s after the BAT trigger), there is no detectable gamma-ray emission with an approximate upper limit of erg cm-2 s-1 (15–350 keV).
2.1.2 XRT observations of GRB050126
Because the XRT was in Manual State before the slew, the standard set of XRT observations was not implemented and thus the image mode (IM) observations normally taken once the spacecraft has settled were not taken in this instance. Furthermore, in Manual State automatic mode-switching is disabled hence only photon counting (PC) mode observations were taken for this source.
The PC mode event lists were processed using the standard xrtpipeline data reduction software, version 12, within FTOOLS v5.3.1, screening for hot-pixels, bad columns and selecting event grades 0-12 for light-curves and grade 0 for spectra. Early calibration observations show that XRT can suffer from a high optical background light that dominates the spectrum at low energies ( keV), and which is particularly strong near the bright Earth limb. In the analysis presented here, the low energy photons have been removed by filtering out PHA values below 0.2 keV. Bad columns, and channels above 10 keV have also been excluded. Finally, frames with spacecraft pointing directions greater than 4.8 arcminutes from the nominal GRB position, and with CCD temperatures 50 degrees Celsius have also been excluded.222Failure of the Thermo Electric Cooler (TEC) during the verification phase of the mission has resulted in operational temperatures for the XRT CCD in the range to degrees Celsius. While above the nominal operational temperature of degrees Celsius, the XRT operates well within pre-flight specifications for temperatures below degrees Celsius. For light-curve and spectral extraction we define both an annular source region of inner radius 3 pixels and outer radius 30 pixels to account for the moderate pile-up at early times, and a circular source region of radius 30 pixels (”) at later times, both centred on the XRT position as determined from the XRT analysis task xrtcentroid. For the background we define an annular region of inner radius 80 pixels and outer radius 120 pixels centred on the same position. Our selection criteria yielded a total on-source time of 8076 s from 9 orbits of PC mode data, with a mean background count-rate of 0.0019 ct s-1.

2.1.3 XRT light-curve and spectra of GRB050126
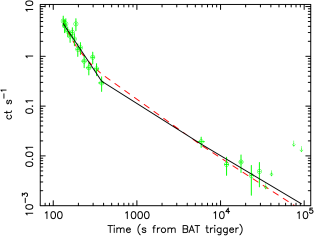
Fig 2 shows the XRT light-curve for GRB050126. For the first 2 orbits of data, the light-curve points were grouped to a minimum of 20 counts/bin, while, at later times, we bin data into a single bin for each orbit. The source and background lightcurves were then simultaneously fitted within XSPEC, using Cash Statistics since many of the latter data points do not contain the minimum number of counts required for Gaussian statistics.
Here we chose to use XSPEC for light-curve fitting as it provides a ready-made suite of models with which to fit the data.333XSPEC does not bin data. It groups data together between start and stop times such that a specified number of counts are contained within that bin. XSPEC then integrates a model fit to the data. The difference between an XSPEC fit and a fit to binned data is rather subtle, the main difference being that the XSPEC fit to the data is not constrained to pass through the centre of the time bin. This difference is extremely important when fitting GRB light-curves, as they decay rather rapidly, typically or faster. The use of overly large bins at early times can drastically alter the derived slope of the light-curve if model integration is not performed..
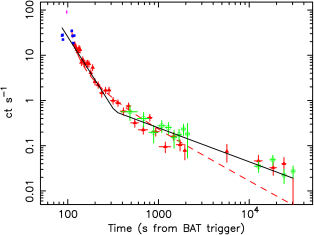
The 0.2–10.0 keV XRT light-curve of GRB050126 shows a steep early decline breaking to a flatter decay slope on relatively short timescales (a few hundred seconds). A single power-law fit to the XRT light-curve (), with , Cash statistic = 62.0 for 20 data points, provides a poor fit to the data. A broken power-law provides an improved fit to the data (Cash statistic = 26.1 for 20 data points) yielding an initial slope , flattening to after a time s (Table 2, column 1), where is the rate trigger time and all errors are 90% confidence for 1 interesting parameter. We note that because of a gap in the data coverage due to an early SAA passage, only the lower limit to the break timescale is well-constrained. A single powerlaw fit to the data which allows for differences between the burst rate trigger and the onset of afterglow , (ie. ), provides an acceptable fit to the data with , , Cash statistic = 31.7 for 20 data points.
Ancillary response files were created using the XRT analysis task xrtmkarf (version 12). The XRT spectrum is well fit by an absorbed444Here we use the XSPEC wabs Wisconsin absorber model power-law, photon index , with the column fixed at the Galactic value of cm-2, yielding for 8 degrees of freedom. An excess column above the Galactic value is not required by the data. We have also formed time-averaged spectra before and after the measured break in the XRT decay light-curve (Table 3). With the column fixed at the Galactic value, and photon index pre- and post-break tied together we find a marginally steeper (though consistent within the errors) mean photon index of , for 6 degrees of freedom. Untying pre- and post-break, we find marginal evidence (90% confidence) for spectral hardening in the 0.2–10.0 keV band following the break in the decay light-curve, with decreasing from pre-break to post-break. Furthermore, by fixing to the post-break value of , a fit to the pre-break data reveals an additional soft excess, which may be modelled as a blackbody with temperature keV, for 3 dof, or a powerlaw with photon index , for 3 dof. We emphasise that while indicative of a possible excess in emission at low energies, the quality of the statistics is poor (only 3 degrees of freedom), therefore we prefer not to draw any firm conclusions based on this finding.
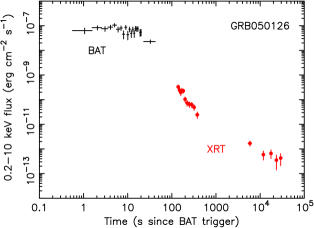
In Fig 3 we show the combined BAT and XRT flux light-curves corrected for absorption. The BAT photon index is insensitive to the Galactic column for energies above 20 keV. Therefore to derive the BAT flux light-curve we have simply extrapolated the BAT spectrum into the XRT band (0.2–10 keV) adopting the average photon index of the pre-slew BAT and pre-break XRT spectra ().
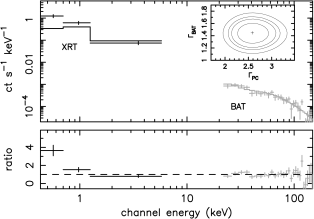
Taken at face value, the pre-break XRT light-curve appears to point toward the late-time BAT data indicating that the early X-ray emission may be associated with the end of the initial explosion. A combined powerlaw fit to the BAT (20-150 keV) and pre-break XRT (0.2-10 keV) spectra (Fig 4), covering the time interval s to s for the BAT spectrum and s to s for the XRT spectrum, however, is inconsistent with a single powerlaw slope at 99% confidence, with the XRT spectrum being significantly softer. This does not preclude an association between the prompt and early X-ray emission since these observations are non-simultaneous, and the prompt emission may evolve at later times, though we note that there is no evidence for spectral evolution in the BAT data.
2.1.4 Observations of GRB050126 in other bands
Due to the close proximity of GRB050126 to the bright star Vega, UVOT was unable to observe this field. Ground based observations with Keck/NIRC obtained on Jan 26th, 4.5 hrs after the burst (Berger & Gonzalez 2005) revealed a new infra-red (Ks band) source 1.9 arcseconds from the XRT position with a subsequent redshift determination for the host galaxy of .
2.2 GRB050219A
The Swift BAT triggered on GRB050219A at 12:40:01 UT Feb 19th 2005 (Hullinger et al. 2005). The spacecraft autonomously slewed to the burst location starting at s and was on target at s. Following the slew Swift began an automated sequence of observations with XRT and UVOT.

2.2.1 BAT spectrum and light-curve of GRB050219A
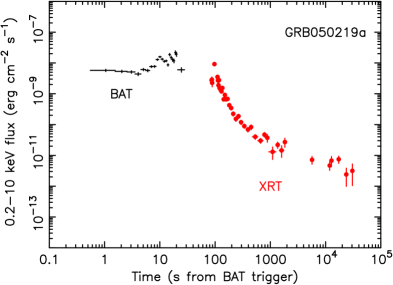
The BAT light-curve for GRB050219A is characterised by two overlapping peaks, with a duration s (Fig 5). The peak flux is ph cm-2 s-1 for a 1-s interval ( keV), 15 seconds after the onset of the burst. The burst fluence is erg cm-2 in the keV band. In the 20–150 keV energy range, the BAT spectrum is well-fit by a cut-off power-law with photon index , high energy cut-off keV, for 52 dof. A single power-law fit to the 20–150 keV spectrum is significantly worse ( for 53 dof, Table 1). A Band model (Band et al. 1993) fit to the data is poorly constrained due to the limited range and low BAT effective area at high energies.
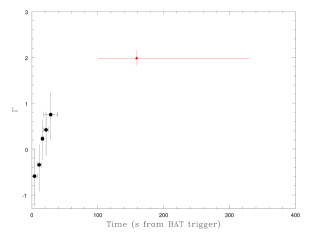
A cross-correlation analysis of the 4 channel, 1 s, BAT light-curves (15-25 keV, 25-50 keV, 50-100 keV, 100-350 keV) shows that the 4-channel light-curves are highly correlated, and display evidence for inter-band delays, with the lowest energy bands delayed with respect to the higher energy bands (Fig 6). This is confirmed by a simple hardness ratio plot, which shows the BAT spectrum is indeed significantly softer at later times. The highest energy band 100-350 keV precedes the 50-100 keV band by s, the 50-100 keV precedes the 25-50 keV band by s and the 25-50 keV band precedes the 15-25 keV band by s, all measurements determined from a Gaussian fit to the peak (correlation coefficient ) of the cross-correlation function.

To determine the rate at which the photon index evolves, we have divided the 15-350 keV light-curve into 5 segments, fitting the spectrum in each segment with a cut-off powerlaw (Table 4). A single cut-off powerlaw fit to all 5 segments is not a good fit to the data, with , keV, for 272 dof. Keeping the photon index tied between each segment and allowing the cutoff energy to freely vary, provides a significant improvement, with , and increasing from 77.5 keV to 139.2 keV through segments 1-3 before decreasing in the final 2 segments to 59.6 keV, for 268 dof. Finally, allowing the photon index to freely vary provides further improvement, . In Table 4 we show cut-off powerlaw fits to individual segments only. Table 4 confirms our earlier finding that the BAT photon index steepens at later times. As with the combined fit we find that the peak energy in the cut-off powerlaw appears to increase through segments 1-3, peaking in segment 3, when the burst was brightest, before shifting back to lower energies in the final segment. The observed decrease in peak energy at later times is a feature common to many burst afterglows (Ford et al. 1995, Norris et al. 1986). Fig 7 shows the evolution of the BAT photon index (15-350 keV) with time together with the measured photon index in the XRT 0.2-10 keV during the early steep decline phase of the burst (see §2.2.2 and §2.2.3).
2.2.2 XRT observations of GRB050219A
The XRT was in Auto-State when Swift slewed to the burst. During the slew XRT was in Low rate PhotoDiode (LrPD) mode and the early frames are vignetted (Fig 8). After settling, a single exposure (2.5 s duration) Image Mode frame was taken, truncating the final LrPD mode frame. XRT then cycled through Windowed Timing (WT) mode and PC mode observations, with the mode determined by the count-rate and the on-board switch thresholds (Hill et al. 2005). The first usable data, an un-vignetted LrPD frame, was taken 86.5 s after the burst trigger. The LrPD data indicate an initial increase in the observed count rate over and above that of the background count rate, which we assume to be due to the source moving into the field of view of the XRT (see Figure 8). GRB050219A was observed for a total of seconds. XRT returned to the target in the following orbit for a second pointed observation in PC mode (total duration 2170 s). No further observations of GRB050219A were taken during the next few weeks as GRB050219b (Cummings et al. 2005) became the new priority target. Observations taken in March did not detect the source.
The event lists for the various XRT observing modes were processed using the standard xrtpipeline calibration software, version 12, screening for hot-pixels, bad columns and using grade selection: PC mode 0-12, WT mode 0-2, LrPD mode 0-5. We note that for the first s the CCD temperature was marginally above Celsius. However, as far as we can tell, there do not appear to be any temperature-dependent artefacts in the data.


LrPD mode data
In Low rate PhotoDiode mode the charge from a full CCD frame is accumulated into a single pixel and thus all spatial information is lost. The timing resolution is however excellent ( ms). A total of four 8.3 s LrPD mode frames were taken during the slew with approximately 3 seconds of usable data (ie. data for which the angular distance arcminutes, see Fig 8). LrPD light-curves have been extracted using the standard grades (0-5) and selecting energies between 0.2–10.0 keV. After binning to 1 s bins, we determine a mean background count-rate in LrPD mode using the first 25 seconds of data. The mean background rate is then subtracted from all LrPD mode data. The final LrPD frame is truncated due to the switch to Image Mode and consequently the final 1 s bin has a low fractional exposure. However, the large measured count rate and associated error ( ct s-1) are consistent with the count rates determined from the following IM and WT mode observations extrapolated back to the time of the LrPD frames. After settling, one additional 8.3 s LrPD frame was taken before switching to WT mode.
Image Mode data
Using simple aperture photometry on the Image Mode frame we determined the integrated DN above the background in a 30-pixel wide circular aperture centred on the source. For GRB050219A there were 7795 DN above the background rate (136 DN) in the 2.5 s exposure. DN are converted to count rates using the spectral fit to the WT mode data to estimate the average energy of a count in the spectrum in the 0.2–10 keV band ( eV). For low gain image mode data, the mean energy per DN is eV, thus giving 34 DN/ct. The total number of counts per second above the background is therefore ct s-1. Scaling the counts to the mean flux in the 0.2-10 keV band gives a total observed flux in the Image Mode frame of erg cm-2 s-1.
PC and WT mode data
For source extraction we define two extraction windows, one for the source and one for the background. For source extraction in PC mode we define a 30 pixel radius (”) circular region centred on the source position as measured using the task xrtcentroid, and an annular region, inner radius 30 pixels, outer radius 50 pixels, centred on the same position for the background. For WT mode we use two rectangular regions each 40 pixels long, the first centred on the source position, the other located in a separate background region. Ancillary response files were created using the Swift software data analysis task xrtmkarf.
2.2.3 XRT light-curve and spectra of GRB050219A
Figure 9 shows the XRT light-curve constructed from the standard grade selections for all modes, and grouped for a minimum of 40 counts/bin. Note we do not bin across gaps in the light-curves caused by orbital viewing constraints, nor do we include data taken within different modes within the same bin.
The prompt X-ray emission, detected within 86 s of the BAT rate trigger, is one of the earliest X-ray detections of a GRB made by Swift. If we include the LrPD data taken during the slew, the XRT lightcurve indicates an initial rise, possibly due to an X-ray flare, followed by a steep decline from a peak near the time of the Image Mode exposure. Flaring behaviour has been detected in approximately half of the Swift GRB population (see e.g. Burrows et al. 2005; Barthelmy et al. 2005). For the decline phase, we measure an initial decay slope for the XRT light-curve (excluding the PC mode data) relative to the BAT rate trigger of at early times, breaking to a slope of , s later, with for 36 dof (Fig 9). A single powerlaw fit to the data with the afterglow coincident with the onset of the burst provides a poor fit to the data with a best-fit slope of , for 38 dof. Fitting for the onset of the afterglow, we obtain a decay slope , s (90% confidence) after the BAT rate trigger with . We note that this fit is a poor approximation to the late-time data.
Fitting the time-averaged spectra for the LrPD, WT and PC mode data together yields a best-fit powerlaw model with photon index with an excess absorption above the Galactic value ( cm-2) of cm-2, for 52 dof. We find no evidence for spectral hardening following the break in the decay light-curve (Table 3) and applying the post-break spectral fit to the pre-break data does not in this case reveal any excess emission at soft energies. Fig 10 shows the BAT and XRT decay light-curves. Count rates have been converted to fluxes using the spectral fits to the BAT and XRT data and assuming no spectral evolution pre- and post-break in the XRT light-curve. The BAT data have been extrapolated into the XRT 0.2-10.0 keV band using an average of the photon index of the BAT and XRT data for each of the 4 segments of the BAT light-curve. For GRB050219A the XRT light-curve does not appear to join smoothly with the late-time BAT data. This apparent mismatch in the BAT/XRT light-curves is most likely due to flaring behaviour in the early XRT data, although the strong spectral evolution in the BAT data could also have some influence.
Fig 11 shows a combined fit to the BAT and pre-break XRT spectra. A single powerlaw fit to the combined BAT-XRT spectrum is a poor () description of the data, again indicative of strong spectral evolution in the GRB spectrum. We note that GRB flares observed by Swift have generally harder canonical photon indices than spectra derived from the underlying powerlaw decay curve and soften with time, reminiscent of the behaviour of the prompt emission (see e.g. Burrows et al. 2005b).

2.2.4 Observations of GRB050219A in other bands
UVOT observations of GRB050219A found no new source within the XRT error circle down to a limiting magnitude of 20.7 in V in a combined 374 s exposure starting 96 seconds after the BAT trigger (Schady et al. 2005). Ground-based observations of the XRT position for this source taken hours after the burst failed to find a counterpart down to a limiting magnitude of in R (de Ugarte Postigo et al. 2005). A 20-min observation in the I-band taken 17 hours after the burst with the 40 inch Las Campanas Swope telescope did not detect any new source down to a limiting magnitude of 21.5. To date, no optical/IR or radio counterpart to this source has been reported.
3 Discussion
3.1 XRT light-curves
The XRT decay light-curves of GRB050126 and GRB050219A are both characterised by an initial steep decline breaking to a flatter slope on timescales of a few hundred seconds (Table 3). A similar break, though less well-defined has also been seen in GRB050117 (Hill et al. 2005) and GRB050319 (Cusumano et al. 2005), while possibly the most convincing early break is seen in the prompt X-ray light-curve of GRB050315 (Vaughan et al. 2005). If these temporal variations do indeed represent breaks in the afterglow light-curves, then they are amongst the earliest breaks yet seen. A single powerlaw fit to the data with the onset of the afterglow, , set to the BAT trigger time, is in both cases a poor fit to the data (Table 2). A broken powerlaw fit is a significant improvement in both cases, with derived break timescales of s (all errors 90% confidence on 1 interesting parameter), and s for GRB050126 and GRB050219A respectively (Table 3). For GRB050126 we can also find an acceptable fit to the data by fitting a single powerlaw together with an offset () for the onset of the afterglow relative to the BAT trigger. We find a best-fit model of , , Cash statistic = 31.7 for 20 data points. For GRB050219A, a single powerlaw fit with offset significantly under-predicts the late-time (post-break) data, though the derived for GRB050219A is consistent within the errors with the observed rise in the light curve seen in the LrPD frames (Fig 8) taken during the final stages of settling in the first orbit. Taking the observed rise in count rates in the pre-slew LrPD mode frames at face value, we may well have observed the onset of the afterglow in this burst. Since the peak count-rate in the Image Mode frame is consistent with the sharp decline at early times, the peak afterglow emission may have occurred prior to the Image Mode observation.
In the previous discussion we have assumed that the early X-ray data are entirely due to the onset of the afterglow. In order to quantify the relationship, if any, between the -ray emission and the early X-ray light-curve, we show in Table 2 the results of fitting a Gaussianpowerlaw model to the XRT decay light-curve. For both, we initially fix the late-time powerlaw decay slope to the best-fit model for the late-time data and then fit a Gaussian assuming that the location of the peak of the Gaussian is coincident with the burst trigger time. For both GRB050126 and GRB050219A, freeing produces no improvement in the fit to the data, suggesting is indeed coincident with the BAT trigger.
3.2 BAT/XRT spectral fits
The spectral indices measured for the -ray emission and prompt X-ray emission immediately following the burst (i.e. during the steep decline phase) are significantly different in both sources (99% confidence), suggesting a separate origin. However, we note that the BAT spectral index for GRB050219A evolves during the course of the burst toward the measured XRT photon index (see e.g. Fig 7, and Table 2).
Fitting the XRT 0.2–10 keV band either side of the break in the light-curve is only marginally suggestive of spectral hardening at later times, and for GRB050126 and GRB050219A respectively. While we stress that in both cases the slopes pre- and post-break are entirely consistent within the errors with no temporal spectral evolution, we remark in passing that unlike GRB050219A, GRB050126 shows evidence of a soft excess consistent with either a thermal blackbody with temperature keV, for 3 dof, or a powerlaw with , for 3 dof; when applying the spectral fit for the post-break XRT data to the pre-break XRT data.
3.3 Origin of the X-ray light-curve
The X-ray afterglow emission from these two bursts consists of an early steeply declining phase, , lasting approximately five minutes, followed by the more typically observed less steeply declining phase with (see Table 2 for their observational properties). The broken powerlaw light-curve is likely produced by two distinct X-ray components.
The interpretation for the less steeply falling X-ray light-curve is straightforward – it is synchrotron radiation in the external forward shock. The spectral index (where ) and the temporal index () are both related to the electron powerlaw index . When the observed energy band (0.2–10 keV) is above the synchrotron cooling frequency, the most likely possibility for these bursts at early times, then and . The values of and for these two bursts (see Table 5) are consistent within the errors with this expectation; for GRB050126 and 1.96 for GRB050219A.
If the onset of the afterglow phase () is unrelated to the burst trigger time, then the entire X-ray afterglow light-curve for GRB050126 can be fitted with a single power law of index (Table 2) i.e., with s (see Kobayashi et al. 2005 for a detailed discussion of the choice of the onset of ).555This is not true for GRB050219A, for which such a model significantly underpredicts the flux in the late-time data. The X-ray light-curves and the spectra in this case are entirely consistent with synchrotron radiation in the external forward shock. However, in the internal-external shock model cannot simply be chosen arbitrarily. According to this model the outer-most shell, that is farthest from the central explosion, is the first to interact with the circumstellar medium and produces the forward shock emission we see whereas the burst itself is produced in internal shocks at smaller radii. Therefore, we expect to lie between the gamma-ray burst trigger time and the reverse shock crossing time (afterglow peak time). This suggests that the break in the X-ray light-curve for GRB050219A is real and we consider various models that can give rise to this break.
A rapidly falling X-ray light-curve at early times could be due to emisson from a hot cocoon accompanying a relativistic jet (Mészáros & Rees 2001; Ramirez-Ruiz et al. 2002), and from the photosphere associated with the outflow from the explosion (e.g. Mészáros & Rees 2000, Mészáros et al. 2002, Rees & Mészáros 2004). However, in the simplest versions of these models the spectrum of the emergent radiation is thermal which is inconsistent with the non-thermal powerlaw spectrum for the two bursts (again we emphasise that the evidence for a soft excess with a thermal spectrum in GRB050126 is marginal at best). Some modifications to these models, for example, Comptonisation of the powerlaw tail of the thermal radiation, might produce the observed behaviour.
Our preferred production mechanism for the rapidly decaying X-ray light-curves is through internal or external shocks (see eg. Zhang et al. 2005 for a thorough review of the theoretical implications of X-ray afterglow light-curves). We discuss each of these possibilities in detail below.
3.3.1 External Shock model
One possible explanation for the steeply falling X-ray light-curve at early times is a high degree of angular fluctuation in the relativistic outflow (Kumar & Piran, 2000) or a mini-jet (Yamazaki et al. 2004). If the angular size of the high energy density regions, or “bright spots”, in the blast wave is less than , the early X-ray light-curve will decline as , as in a spreading jet case, and the spectrum is given by when the X-ray band is above the cooling frequency; is the Lorentz factor of the jet. For GRB050126 this provides a reasonable fit to the early X-ray light-curve: , and . However, for the steeply falling part of the X-ray light-curve of GRB050219A and , are inconsistent with this picture (Table 5). When the bright region along our line of sight spreads and merges with other bright regions the subsequent light-curve decline is the same as in the standard external forward shock model, i.e., . A possible weakness of this model is that the probability of a random observer line of sight passing through a bright region is smaller than the probability of that passing through the darker, inter-bright, regions. We should therefore see many more X-ray light-curves with at early times, or even , a conclusion which is not supported by the data. However, it is possible that the dark regions are very faint in -rays and therefore do not trigger the BAT.
3.3.2 Internal or Reverse shocks
A rapidly falling X-ray light-curve could also arise if the source activity ends abruptly, as might be expected in the internal shock or in the reverse shock heated GRB ejecta. In this situation the observed flux will not drop suddenly but will have a non-zero value for some period of time as the observer will continue to receive radiation from those parts of the relativistic source that lie at angles () greater than with respect to the observers line-of-sight, the so-called “curvature effect” (see e.g. Kumar and Panaitescu 2000; Dermer 2004; Fan and Wei 2005). For the simplest case of a uniform source the observed radiation in a fixed observer energy band will decline with time as ; the observed spectrum is (Kumar & Panaitescu 2000). The values of and for the steeply falling part of the X-ray light-curve for GRB 050219A are compatible with this expectation. However, if the source for X-rays is same as the -ray burst photons, which is the most natural explanation in this model, then we expect the spectrum during the X-ray afterglow to be the same as during the -ray burst. This requirement is violated for both of the bursts. The emission from from the -ray source provides a lower limit to the flux we must detect at minutes in the X-ray band. This limit is also violated for GRB050219A, suggesting that the comoving energy flux for the -ray source is decreasing with increasing . In this case the spectrum at is likely to be softer than we see during the burst, and the inconsistency between spectra during the -ray burst and the X-ray afterglow could be resolved. In this scenario the rapidly falling X-ray light-curve is from the same source as the -ray burst, with the forward shock emission dominating after a few hundred seconds.
A rapidly falling X-ray light-curve is also expected from the reverse shock heated ejecta. The synchrotron emission from the reverse shock is thought usually to peak in the infrared or optical band (Mészáros & Rees 1993, Panaitescu et al. 1998, Sari & Piran 1999), and the optical light-curve after the deceleration time decays as . However, the optical synchrotron photons when inverse Compton scattered in the ejecta, may emerge in the X-ray band. The inverse Compton light-curve declines faster than the synchrotron light-curve by a factor of ; where is the optical depth of the ejecta to Thomson scattering, and for . Thus, the inverse Compton X-ray light-curve decline is expected to be which is consistent with the steeply declining early X-ray observations for these two bursts. The optical depth of the ejecta at deceleration is , where is the number of pairs per proton, is the deceleration radius, and a numerical subscript means the variable divided by 10x. The optical flux at deceleration is larger than the X-ray flux by a factor and violates the upper limit on the optical flux from these bursts unless .
If the -rays are generated through internal shocks, we expect the ejecta to undergo adiabatic expansion and cool down with time once shell collisions have ended. As time goes by, the adiabatically expanding shells will produce radiation that is shifted to lower and lower energies, and could ultimately be responsible for the early rapidly declining X-ray light-curve we observe for these two bursts. The influence of a magnetic field could enhance this possibility. A tangled magnetic field in the ejecta decreases with radius as , and the electron thermal energy decreases as . Since the Lorentz factor of the shell is not changing with time, , and the flux in a fixed observer band above the peak of the spectrum, decays as where , and is the spectral index. For a transverse magnetic field in the ejecta, , and the light-curve in a fixed observer band decays as when the burst energy is carried by matter, or when the magnetic field dominates the energy in the outflow (Mészáros & Rees, 1999). We note that can be no larger than , if the shells are homogeneous in the angular direction, because radiation from will always contribute to the observed flux.
For , as is the case for both GRB050126 and GRB050219A, the high emission dominates when the magnetic field in the shock heated ejecta is randomly oriented. In the other two cases considered above, high emission dominates when and respectively. The early X-ray spectral indices for GRB050126 and GRB050219A, during the afterglow phase, were and respectively. These values are significantly larger than the BAT spectral index during the burst (, and for GRB050126 and GRB050219A respectively) even when we include the spectral steeping by 1/2 due to electron cooling. If we assume that toward the end of the burst increased and reached the value we observe during the afterglow (as appears to be the case for GRB050219A), then the above argument suggests that the high-angle emission dominated the observed flux during the adiabatic expansion of shells in the internal shock, and . Thus, the internal shock model for the steep X-ray lightcurve has the same characteristic spectral and temporal features as the model involving high-angle emission in external shocks described above.
3.4 Redshift and luminosity
Adopting the host galaxy redshift of 1.29 for GRB050126 (Berger & Gonzalez 2005) and a BAT fluence of erg cm-2 we derive an isotropic gamma-ray energy of erg in the 15-350 keV band (assuming a WMAP Cosmology of km s-1 Mpc-1, , and ). For GRB050219A there was no ground-based optical/IR detection and hence no redshift estimate for this source. However, we can estimate the redshift (with large uncertainty) using the relationship (Amati et al 2002; Moran et al. 2004). For GRB050219A () we estimate a redshift of , which for a BAT fluence of erg cm-2 implies an isotropic gamma-ray energy erg in the 15–350 keV band.
Re-writing the Amati relation (Amati et al. 2002) in terms of the isotropic energy, , and peak energy , ie. , (Friedman and Bloom 2005), we derive a rest-frame keV for GRB050126. Using the Ghirlanda relation (Ghirlanda, Ghissellini & Lazzati 2004; Friedman & Bloom 2005) which describes the dependence of the total energy radiated in -rays on , where , we derive an erg. This implies a beaming fraction . For GRB050219A, we measure a mean rest-frame peak energy of keV using our adopted redshift of 1.94, close to the predicted rest-frame of 305.6 keV found using the Ghirlanda relation. Using these estimates for we derive erg, and beaming fraction .
As far as these relationships are applicable to GRBs in general666The Ghirlanda relation is derived from bursts the majority of which have outside of the 10-100 keV range, where the BAT has the largest effective area., then both and for GRB050126 place it amongst the low-end of the and distributions given in Frail et al. (2001), while for GRB050219A and lie near the mean of these distributions. We note that the derived beaming fraction for both sources is a factor of a few larger than the mean beaming fraction () found by Frail et al. for the same sample. The predicted break timescales, 11.2 days and 2.4 days for GRB050126 and GRB050219A respectively, both occur later than the last XRT observation for these sources and are consistent with the non-detection of a jet-break in their lightcurves.
4 Summary and Conclusions
The early X-ray decay light-curves of GRB050126 and GRB050219A are characterised by an unusually steep early decline (), flattening to a more gradual decline on timescales of a few hundred seconds.
The prompt -ray and the early X-ray afterglow emissions for GRB 050126 & 050219A require at least two, possibly three, distinct mechanisms. The X-ray lightcurve after the break for these GRBs is produced in the forward external shock. The early, steeply falling, X-ray lightcurve may be due to synchrotron self-Comptonisation in the reverse shock. However, in order to avoid early bright optical emission from these bursts, which was not seen in the UVOT data, we require the GRB ejecta to be highly enriched with pairs, and to have a Lorentz factor of at least a few hundred. Furthermore, it is difficult to see how SSC can account for a steep decay over almost 2 orders of magnitude. An alternate possibility is that the early X-ray light-curve was produced in the external shock from a jet consisting of narrow regions (regions of angular size ) of high energy density.
We suggest that the most plausible explanations for the steep early decay are either high-latitude () emission from a relativistic jet arriving at the observer when emission from has dropped to zero (the curvature effect) or X-ray flares, indicative of late time activity of the central engine.
Acknowledgements.
MRG would like to thank the anonymous referee for a prompt and thorough reading of this manuscript. This work is supported at the University of Leicester by the Particle Physics and Astronomy Research Council (PPARC), at Penn State by NASA contract NAS5-00136, and in Italy by funding from ASI on contract number I/R/039/04..
References
- (1) Amati, L. et al. 2002, A&A 390, 81.
- (2) Band, D. et al. 1993 ApJ 413, 281.
- (3) Barthelmy, S.D. 2004 SPIE 5165, 175.
- (4) Barthelmy, S.D. et al. 2005, ApJ submitted.
- (5) Berger, E. and Gonzalez, S. 2005, GCN 3048.
- (6) Burrows D.N. et al. 2005, Sp. Sc. Rev. in press.
- (7) Burrows D.N. et al. 2005b, Proceedings of “The X-ray UNiverse” Conference, El Escorial, Spain, 2005, in prep.
- (8) Campana et al. 2005a, GCN2996.
- (9) Campana et al. 2005b, ApJ 625, L23.
- (10) Chincarini, G. et al. 2005, ApJ submitted (astro-ph/0506453).
- (11) Costa, E. et al. 1997, Nature 387, 783.
- (12) Cummings et al. 2005, GCN3044.
- (13) Cusumano, G. et al 2005, ApJ in press (astro-ph/0509689).
- (14) de Ugarte Postigo, A., Eguchi, S., Gorosabel, J., Yock, Ph., and Castro-Tirado, A.J. 2005, GCN 3041.
- (15) Dermer, C. 2004, ApJ, 614, 284.
- (16) Fan, Y.Z. and Wei, D.M. 2005, MNRAS submitted (astro-ph/0506155).
- (17) Ford, L.A. et al. 1995, ApJ 439, 307.
- (18) Gehrels et al. 2004, ApJ 611, 1005.
- (19) Ghirlanda, G. Ghisellini, G. and Lazzati D. 2004, ApJ 616, 331.
- (20) Kennea et al. 2005, GCN2984.
- (21) Kobayashi, S. et al 2005b, in prepration.
- (22) Kumar, P. and Panaitescu, A., 2000, ApJ 541, L51.
- (23) Kumar, P. and Piran. T., 2000, ApJ 535, 152.
- (24) Hill, J. E. et al. 2004, Proc. SPIE, Vol 5165, 217.
- (25) Hill, J. E. et al. 2005, ApJ in press (astro-ph/0510008).
- (26) Hullinger et al. 2005, GCN3038.
- (27) Krimm, H., Parsons, A. & Markwardt, C. 2004.
- (28) McMahon, E., Kumar, P. and Panaitescu, A., 2004, MNRAS 354, 915.
- (29) Méeszáros, P. and Rees, M.J., 1993, ApJ 418, L59.
- (30) Mészáros, P. & Rees, M.J. 1997, ApJ 476, 232.
- (31) Mészáros, P. and Rees, M.J., 1999, MNRAS 306, L39.
- (32) Mészáros, P. and Rees, M.J., 2000, ApJ 530, 292.
- (33) Mészáros, P. and Rees, M.J., 2001, ApJ 556, L37.
- (34) Mészáros, P., Ramirez-Ruiz, E., Rees, M.J. & Zhang, B., 2002, ApJ 578, 812.
- (35) Moran et al. 2005 A&A 432, 467.
- (36) Norris, J. P., Share, G. H., Messina, D. C., Matz, M., Kouveliotou, C., Dennis, B. R., Desai, U. D., Cline, T. L. 1986, In: Advances in Space Research (ISSN 0273-1177), vol. 6, no. 4, 1986, p. 19-22
- (37) Nousek et al. 2005, submitted to ApJ (astro-ph/0508332).
- (38) Panaitescu, A., Mészáros, P., and Rees, M.J., 1998, ApJ 503, 314.
- (39) Ramirez-Ruiz, E., Celotti, A. and Rees, M.J., 2002, MNRAS 337, 1349.
- (40) Rees, M.J., and Mészáros, P., 2005, ApJ 628, 847.
- (41) Roming et al. 2005, submitted to Science.
- (42) Sari, R. and Piran, T., 1999, ApJ 517, L109.
- (43) Sato et al. 2005, GCN2987.
- (44) Schady et al 2005, GCN 3039.
- (45) Tagliaferri et al. 2005, Nature, 436, 985.
- (46) Vaughan, S. et al 2005, ApJ in press, astro-ph/0510677.
- (47) Yamazaki, R., Ioka, K., and Nakamura, T., 2004, ApJ 607, L103.
| GRB050126 | GRB050219a | |
| Parameter | ||
| T90 (s) | ||
| Fluence ( erg cm-2) | ||
| Model 1: Power-law (20–150keV) | ||
| 66.2/53 | 125/53 | |
| Model 2: Cut-off powerlaw (20–150 keV) | ||
| – | ||
| – | ||
| – | 46.9/52 | |
| GRB050126 | GRB050219a | |
| Parameter | Model 1: Powerlaw () | |
| – | 225.1/38 | |
| 62.0/20 | – | |
| Model 2: Broken powerlaw | ||
| – | 74.6/36 | |
| 26.1/20 | – | |
| Model 3: Offset powerlaw | ||
| – | 114.1/37 | |
| 31.7/20 | – | |
| Model 4: Gaussian + powerlaw | ||
| (fixed) | 0.0 | 0.0 |
| – | 89.4/36 | |
| 26.4/20 | – | |
ndp number of data points.
| GRB050126 | GRB050219a | |
| Model 1: - alla | ||
| Mode | PC only | WT+PC+LrPD |
| gal | ||
| – | ||
| /dof | 8.2/8 | 55/52 |
| Model 2: - all tiedb | ||
| Mode | PC only | WT only |
| gal | ||
| – | ||
| /dof | 8.6/6 | 66/49 |
| Model 3: - untiedc | ||
| Mode | PC only | WT only |
| gal | ||
| – | ||
| 5.0/5 | 66/48 | |
Here we use the standard XSPEC notation where
means absorbed powerlaw.
all - simultaneous fit to all data.
all tied - simultaneous fit to pre- and post-break spectra
with the photon index in each part of the spectrum tied together.
untied - simultaneous fit to pre- and post-break spectra
allowing and where applicable to freely vary between
the pre- an post-break data.
| segment 1 | segment 2 | segment 3 | segment 4 | segment 45 | |
|---|---|---|---|---|---|
| duration (s) | 8 | 6 | 4 | 7 | 14 |
| † | |||||
| /dof |
The error on is the 90% confidence limit
for a fixed value of the high energy cut-off , where .
| Forward shock | ||||||
| Source | ||||||
| GRB050126 | ||||||
| GRB050219a | ||||||
| External shock | Internal/Reverse shock | |||||
| () | () | |||||
| GRB050126 | ||||||
| GRB050219a | ||||||