The shower size parameter as estimator of extensive air shower energy in fluorescence telescopes
Abstract
The fluorescence technique has been successfully used to detect ultrahigh energy cosmic rays by indirect measurements. The underlying idea is that the number of charged particles in the atmospheric shower, i.e, its longitudinal profile, can be extracted from the amount of emitted nitrogen fluorescence light. However the influence of shower fluctuations and the very possible presence of different nuclear species in the primary cosmic ray spectrum makes the estimate of the shower energy from the fluorescence data analysis a difficult task. We investigate the potential of shower size at maximum depth as estimator of shower energy. The detection of the fluorescence light is simulated in detail and the reconstruction biases are carefully analyzed. We extend our calculations to both HiRes and EUSO experiments. This approach has shown some advantages to the reconstruction of the energy when compared to the standard analysis procedure.
pacs:
96.40.PqI Introduction
Cosmic rays (CR) are the highest energy particles present in nature with energies exceeding 1020eV . Their origin, nature and possible acceleration mechanisms are still a mystery, despite the efforts of many cosmic ray experiments in the last decades. Such challenge is in part due to the very low flux of high energy and the consequent few observed events to be analyzed.
Measuring extensive air showers (EAS) is currently the only way to study the cosmic ray spectrum and chemical composition at energies around and above PeV. At energies 1017 eV the shower development can be directly observed by measuring the fluorescence light from atmospheric nitrogen that is excited by the ionization of the secondary charged shower particles (essentially electrons and positrons). Experiments applying this technique can determine the depth of maximum air shower development () and the corresponding number of charged particles (). Presently, the HiRes bib:hires , Pierre Auger Observatory bib:auger-nim , EUSO bib:euso-artigo , OWL bib:owl-artigo and Telescope Array bib:telescope:array ) experiments are using or planning to use fluorescence detectors to investigate the ultra high energy cosmic rays.
The total amount of emitted fluorescence light in a shower is a very good approximation to the total number of charged particles (), where is the atmospheric depth. In this sense the number of particles at shower maximum can serve as an estimator of the shower energy. The total energy that goes into electromagnetic charged particles is obtained by integration of the shower longitudinal profile
| (1) |
where is the average ionization loss rate bib:song , and the integral on the right-hand side represents the total track length of all charged particles in the shower projected onto the shower axis.
As an alternative proposal bib:bruce:gap the electromagnetic energy can also be calculated by using the fluorescence light intensity and the fluorescence efficiency, without the need of reconstructing the number of particles as a function of the atmospheric depth. Such approach is taken as a very precise measurement of the primary shower energy because it is supposed to be weakly dependent on the simulation models and on the primary particle type. However, when the shower development details are taken into account the calorimetric measurement can lead to high systematic uncertainties. Of no less concern is the important fact that the fluorescence efficiency as a function of air pressure, density and humidity is only known to a certain extent. On approach given by Eq. 1, the average ionization loss rate is used in the air shower reconstruction and hence the energy spectrum of the electron shower particles must be known via Monte Carlo simulation.
Although the electrons and positrons constitute the majority among the charged particles in a shower and contribute most to the production of fluorescence light, an also important fraction of the shower energy is carried by particles which cannot be measured by the fluorescence technique, i.e., particles that are invisible to fluorescence telescopes. This so called “missing energy” has been calculated by Monte Carlo air shower simulation and contributes to the uncertainties involved in the method, being sensitive to primary composition.
Theoretical works have shown the existence of a clear relation between the primary energy and the maximum number of particles in the shower. Recently, Alvarez-Muñiz et al. bib:alvarez have studied the shower quantity as an estimator for the primary shower energy, confirming the efficiency of this technique. Such approach was analyzed for different primary particles and energies using a fast one-dimensional simulation program. However, telescopes particularities and reconstruction procedures must be considered due to the introduction of biases and fluctuations in the calculation of .
The scope of this work is to explore the possibility of estimating the primary shower energy based on , taking as case studies the HiRes bib:hires and EUSO bib:euso-artigo fluorescence experiments, i.e., ground and space based experiments, respectively. The telescopes particularities and the reconstruction procedures are included in our analysis configuring a very realistic context for the application of the technique.
II fluctuations
Fluctuations are intrinsic to any extensive air shower and are a cause of uncertainty in the energy reconstruction. In addition to that, the energy of the shower is calculated without the knowledge of the mass of the primary particle which initiated the shower. The nature of the primary particle affects the longitudinal development of showers and can exert influence on the reconstruction of the air shower energy, especially when primary photons are taken into account.
On the other hand, reconstruction procedures must relay on simulation programs in order to relate the measurable parameters to energy. In addition to the choice of the particular simulation program to be used, there is a general agreement that most shower reconstruction uncertainties originate on uncertainties on the hadronic interaction models.
The usual procedure used by the HiRes and Auger collaborations to reconstruct the shower energy with fluorescence telescopes correlates the integral of the energy deposited in the atmosphere to the total shower energy. As mentioned before, a certain amount of the shower energy is carried away by particles which are invisible to the fluorescence technique, i.e., muons, neutrinos and high energy hadrons which are not converted to fluorescence photons. Such “missing energy” has been estimated by Monte Carlo simulations and shown to be dependent on the hadronic interaction model, primary composition, shower energy and arrival direction.
In reference bib:song , Song et al. have estimated that the fluctuations due to the type of primary particle are about for showers initiated by proton and iron nuclei and around if primary photons are taken into account. Meanwhile Barbosa et al. bib:barbosa and Alvarez-Muniz et al. bib:alvarez have calculated similar values for hadronic primaries (5%) which decrease with energy. According to bib:alvarez , the hadronic interaction model is the main source of systematic fluctuation in the estimation of the missing energy at the highest energies. Due to the differences in the multiplicities of secondary particles simulated by QGSJET01 bib:qgsjet and SIBYLL2.1 bib:sibyll hadronic interaction models, the unseen energy calculated with QGSJET is about 50% higher than the value predicted by SIBYLL at eV, which can be translated into an uncertainty of in the shower energy reconstruction.
The dependence of the missing energy on the energy of the primary is a consensus among the various studies made so far. In addition, Barbosa and co-workers bib:barbosa have studied the dependence of the missing energy on the arrival direction of the shower and limited it to be at most 0.7%.
Furthermore, it has been suggested in reference bib:alvarez that the discrepancies among such studies are on the order of 1-3% and could be explained by different hadronic interaction models for lower energy particles. It might be relevant to mention that both groups used different simulation programs: Song et al. and Barbosa et al. used different versions of the well tested CORSIKA Heck98a , while Alvarez-Muniz et al. used a hybrid fast one-dimensional simulation program Alvarez02 .
Considering all the uncertainties in the determination of the missing shower energy listed above, one can estimate that the total systematic fluctuation related to the primary energy reconstruction is about 5% to 10%.
In order to investigate the fluctuations in the maximum number of particles due to the natural fluctuations of the shower, the different primary particles and the artificial fluctuations introduced by different hadronic interaction models, we have used the recently released CONEX bib:conex shower simulation program. We have simulated 5,000 showers initiated by proton, iron and gamma primaries at each considered energy and for the QGSJET01 and SIBYLL2.1 interaction hadronic models. Shower have been simulated with the minimum cuts available, 1 GeV for hadrons and 1 MeV for electromagnetic particles.
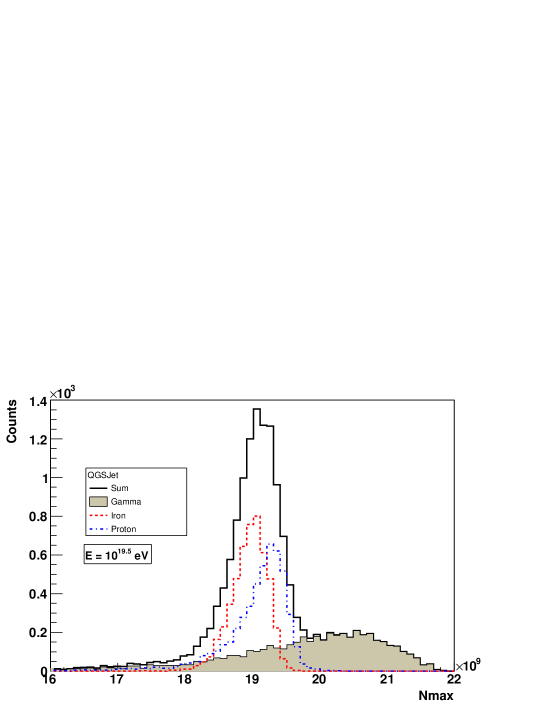
Fig. 1 shows the distribution for 5,000 showers initiated by protons, iron nuclei and gamma at eV simulated with the QGSJET hadronic model. The distribution illustrates the previous discussion regarding the fluctuations due to the primary particle type. If only proton and iron nuclei are considered, the distribution shows a very narrow distribution with median value of and a dispersion of 3.6% at the 68% of confidence level. If gamma shower are considered, the median of the combined distribution (gamma+proton+iron nuclei) increases slightly to while the dispersion reaches 7% at 68% of confidence level.
The same calculation has been done for proton and iron nuclei at eV and the fluctuations presented the same level of 3.6%. Gamma air showers have not been studied at the energy of eV due to the fact that the CONEX program does not include the pre-shower algorithm effect bib:pre:shower ; bib:pre:shower:2 that takes into account photon interactions with the geomagnetic field affecting the longitudinal development of showers with energy above eV.
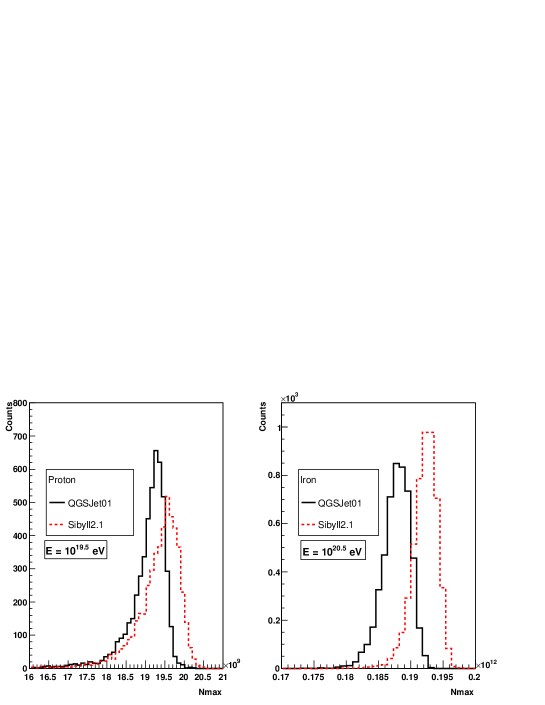
In order to investigate the uncertainty due to the hadronic interaction model we have simulated 5,000 proton showers with the CONEX program using SIBYLL and QGSJET hadronic interaction models. Fig. 2 illustrates the distribution for proton showers simulated with QGSJET and SIBYLL at eV and the corresponding fluctuation is 4.6%. Fig. 2 also shows the same distribution for iron nuclei at eV and the corresponding fluctuation is 3.3%.
Comparing the numbers given above and Figs. 1 and 2, we are able to conclude that the systematic uncertainties in are dominated by the hadronic interaction models rather than mass composition if proton and iron nuclei are considered, however the fluctuations due to both effects are very similar, 4.6% and 3.6%, respectively at eV. If primary gamma are considered, mass composition would be more relevant than hadronic interaction models to the fluctuations.
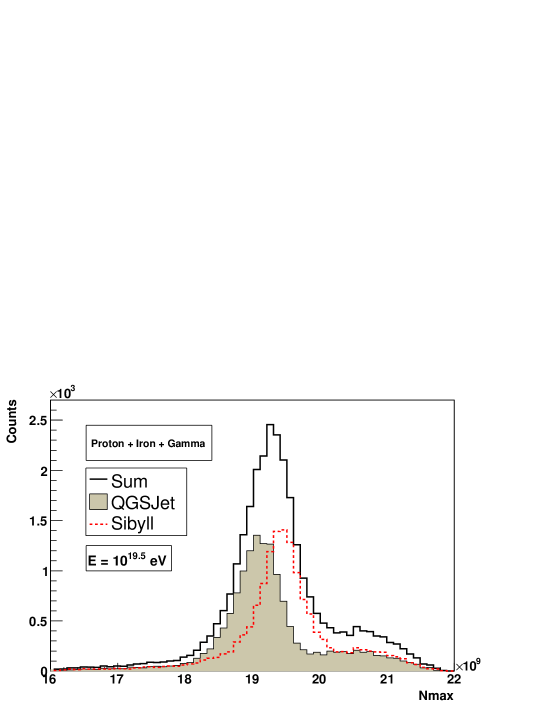
In order to exemplify the increase in the uncertainty by allowing the introduction of photons in the cosmic ray flux, we also consider the peculiar case of equal abundances of protons, iron and gammas. Fig. 3 shows 5,000 air showers induced by gamma, proton and iron nuclei simulated with QGSJET and SIBYLL hadronic interaction models, at the energy of eV. The total uncertainty is which is comparable to the systematic uncertainties introduced by the missing energy correction calculation.
III Shower and Telescope Simulation
The results presented in the current section have been obtained by using the CORSIKA 6.2 simulation program. In addition, gamma showers have been simulated by considering the pre-shower effect. The thinning factor Hillas97a of the simulations is and the longitudinal air shower profiles were sampled in steps of 5 g/cm2. The energy thresholds were set to 0.1 MeV, for electrons and photons, 0.3 GeV for hadrons and 0.7 GeV for muons. Protons and gamma ray showers were simulated in the energy interval from to eV in steps of dex. For each energy and primary particle we simulated 100 events which were recycled 50 times by randomly drawing a new arrival direction and core position. For gamma showers simulated with the pre-shower effect only the core position was randomized since the relative direction of the primary particle with the geomagnetic field affects the development of the shower.
The simulations of the HiRes telescopes were performed following the same general procedure adopted by the HiRes Collaboration as published in bib:hires:espectro and bib:hires:espectro:2 . Comparisons of our simulation with the HiRes Collaboration simulation and the HiRes data can be seen in bib:espectro:2005 .
A similar simulation program was written for the EUSO telescope in which we incorporated the geometry details of that telescope. The EUSO experiment has been proposed to operate at 430 km of altitude looking downwards to measure the fluorescence light produced by the passage of a cosmic ray shower. It is configured with a 60 degree field of view covered by pixels of 0.1 degree resulting in 200.000 km2 detection area.
For the HiRes studies we have simulated shower cores within a radius of 50 km from the telescope. The zenith angle has been randomly chosen from 0 to 60 degrees. For the EUSO studies we allowed showers with cores within a radius of 250 km from the axis of the telescope and the zenith angle was chosen from 0 to 90 degrees.
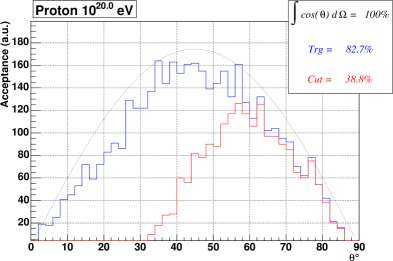
Besides the configuration details, included in our simulation program, we also paid careful attention to the simulation of the atmosphere since the field of view of the EUSO telescope spans the entire atmosphere. In order to verify our code we have the EUSO acceptance as a function of the arrival direction of the primary particle. Fig. 4 illustrates the acceptance for the EUSO telescope, which is in good agreement with the predicted values given in bib:euso-artigo .
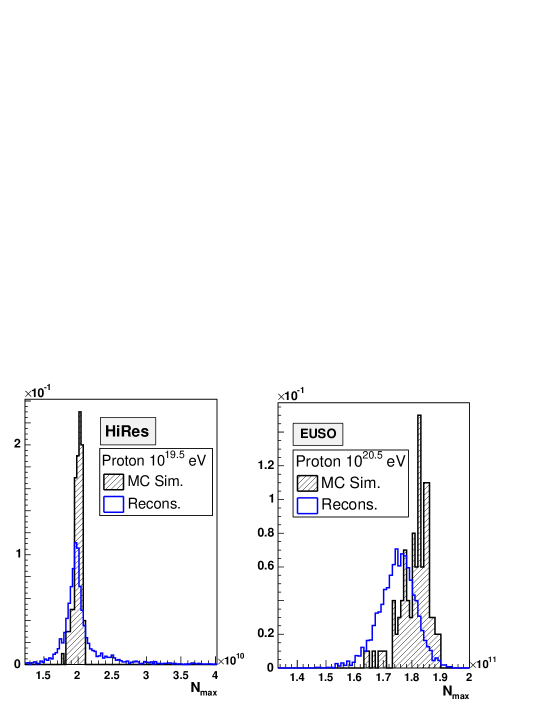
The importance of a detailed telescope simulation in the studies of as an energy estimator can be seen in Fig. 5 in which the simulated distribution as predicted by the CORSIKA code is compared to the reconstructed , obtained after the detection by the EUSO and HiRes-I telescopes. It is evident from the figure that the distortion of the distribution after the detection and reconstruction of the shower must be taken into account properly. Fluorescence telescopes have detection biases regarding arrival direction, primary energy and core position which are very difficult to control. Moreover, the reconstruction procedure also introduces fluctuations which depend on several parameters. These effects result in a distortion of the distribution that depends on the configuration of the telescope and the chosen reconstruction method. Therefore the simulation of the telescope and the application of the reconstruction procedure is fundamental in order to obtain a meaningful relation between and energy and to properly estimate the reconstruction errors attained by this method.
IV Primary Energy Reconstruction
For the energy reconstruction of a shower there is one procedure which is unavoidable by all proposed methods, especially those in investigation here. Each pixel hit in the telescopes corresponds to a given atmospheric depth and the respective signal measured by it can be correlated to the number of particles or, more directly, to the energy deposited by the shower at that depth. From a limited number of points along the longitudinal profile, a function must be fitted in order to calculate, by extrapolation, the energy deposited by the shower beyond the limits of the field of view of the telescope. The most widely used function is the Gaisser-Hillas, which efficiency have been extensively tested and confirmed bib:hires:espectro .
In this section, we are going to investigate the influence of the fitting procedure in the uncertainty of the energy for two reconstruction methods. The analysis will be done for a ground based experiment and may differ for a space based telescope.
The standard method used by the HiRes and Auger Collaborations is based on the integration of the fitted Gaisser-Hillas function to obtain the shower energy and, from now on, it will be referred as the integral method. In addition, the method based on the parameter will be referred as the method. Our intention here is to evaluate the influence of the knowledge of a limited portion of the shower longitudinal development in the determination of the parameters related to energy, which are the integral of the longitudinal profile for the integral method and the parameter for the method.
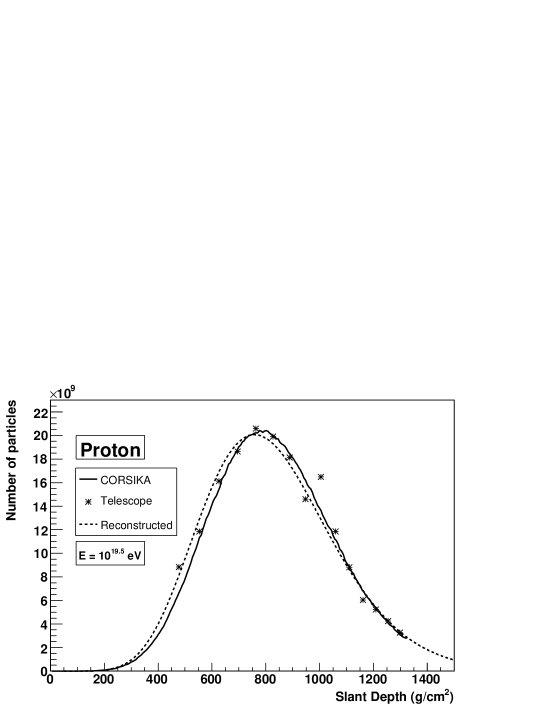
We try to determine which parameter is less affected by the fact that the telescopes, in most of the cases, measure only a small part of the shower, and whether the extrapolation of the observed longitudinal profile depends on geometric parameters. In order to do so, we simulated 5,000 CORSIKA proton showers with energy eV through the HiRes-II telescopes. For each shower we compare the integral of the longitudinal number of particles as calculated by CORSIKA using the whole profile of the shower with the integral of the fitted longitudinal profile based on the points actually measured by the telescope. The same comparison is made between the given by CORSIKA based on the whole development of the shower and the reconstructed after the restriction of the shower in the field of view of the telescope. Fig. 6 and 7 illustrate this procedure. These figures show the longitudinal profile simulated by CORSIKA in solid black lines. Star symbol shows the points measured by the telescope after the inclusion of noise while the dashed line shows the Gaisser-Hillas fit to the points.
The Gaisser-Hillas fit was implemented according to the procedures adopted by the HiRes Collaboration in bib:hires:espectro and bib:hires:espectro:2 .
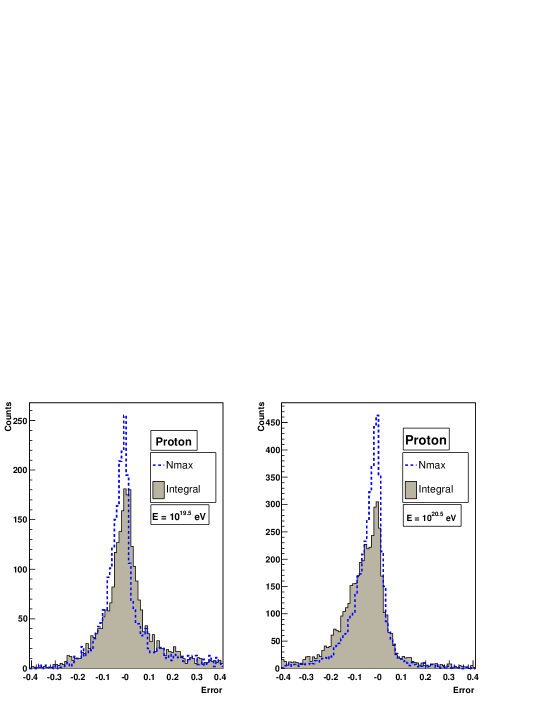
Fig. 8 shows the distribution of errors in the determination of the integral of the longitudinal profile and in the calculation of the parameter for proton showers at and eV. Table 1 shows the mean and RMS values for all the distributions. The error is defined as the reconstructed value minus the simulated value divided by the simulated value.
The same behavior is noticed in the and integral errors. At eV, the parameter and the integral of the longitudinal profile are underestimated and the opposite happens at eV where both values are overestimated. This might happen because showers with higher energy develop deeper in the atmosphere hitting ground level in an earlier stage. However, its is noticeable that the parameter is less affected by reconstruction showing a mean closer to zero and a slightly smaller RMS value for both energies.
The RMS values shown in Table 1 are the intrinsic fluctuations of the determination of the parameter and of the integral value of the longitudinal profile. Nevertheless, we have not applied any quality cuts to the showers analyzed so far, besides asking that falls inside the field of view of the telescope.
It has been claimed that , as an energy estimator, should be superior to the integral method for showers with short track length detected by fluorescence telescopes. Other authors have also mentioned the dependence of the method on the shower zenith angle and on the distance from the telescope to the shower core. However, both zenith angle and distance to the core, are the variables which determine the track length of the shower in the field of view of the telescope.
As illustrated in Figs. 6 and 7 the path length is the parameter which influences directly the fit of the Gaisser-Hillas function and, therefore, the energy reconstruction. The distance between telescope and shower also influences the energy reconstruction via the lateral size of the shower in the photomultiplier camera, as discussed in bib:corsika-astro and bib:astroph:1dX3d , but this effect should be small compared to the reduction of the path seen by the telescope.
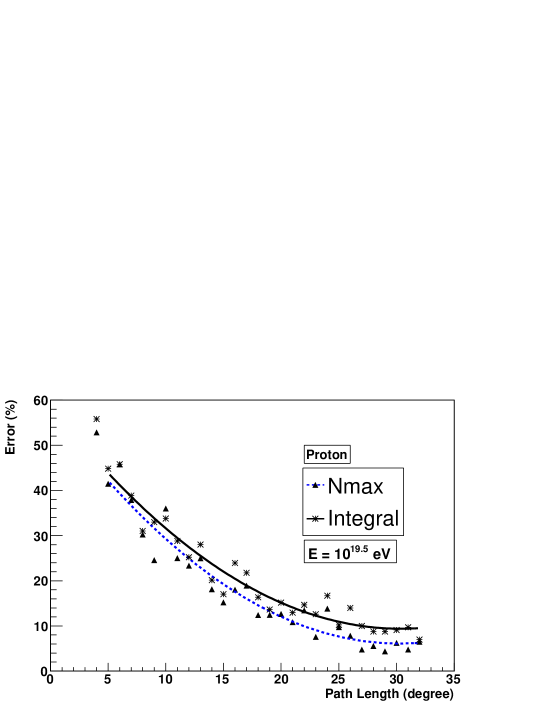
Fig. 9 illustrates the reconstruction error of the integral and of the parameter as a function of path length for proton showers with energy eV. The line is a polynomial fit to the points. In this case, a slight better resolution for the parameter is seen for the entire range of path length.
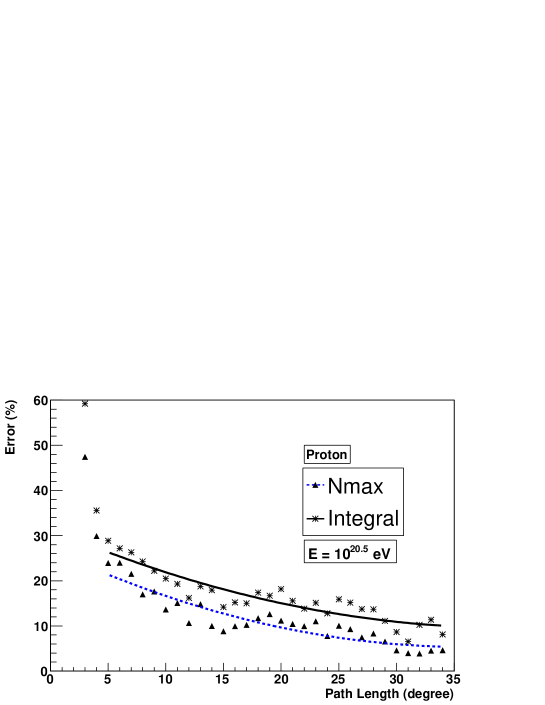
Fig. 10 shows the same plot for proton showers at eV where a small difference between the reconstruction of the and the integral can be seen for the range of path length from 5 to 35 degrees.
These results show that the reconstruction of the parameter is equivalent to the reconstruction of the integral independently of the size of the shower detected by the telescope. Our calculations suggest that the reconstruction of the parameter might become slightly more accurate than the integral reconstruction for the highest energies above eV.
| Energy (eV) | Integral | |||
|---|---|---|---|---|
| Mean | RMS | Mean | RMS | |
| 0.02 | 0.16 | 0.03 | 0.17 | |
| -0.04 | 0.10 | -0.06 | 0.14 | |

V Relation between primary energy and
Finally, we used the simulation programs already described to determine the relationship between the reconstructed and the primary energy of the shower. We used the same set of CORSIKA showers described above and simulated them through the HiRes-II and EUSO telescopes. The present are intended to assess the potential of the parameter as an energy estimator by means of a full simulation and reconstruction chain including all types of systematic and statistical errors.
The HiRes-II and EUSO telescopes were chosen to illustrate the method for ground and space based telescopes. The HiRes-II telescope is, in principle, very similar to the Auger telescopes regarding the variables explored here. Both experiments have 30 degrees of field of view in zenith and the pixel size for the Auger telescope is 1.5 degree while for the HiRes-II telescope is 1 degree. These small differences should not affect our conclusions.
VI HiRes Telescope
The reconstruction of the shower was also carried out according to the explanations given by the HiRes Collaboration in bib:hires:espectro and bib:hires:espectro:2 of their own procedures. The and parameters of the Gaisser-Hillas were fixed to -60 and 70 g/cm2 respectively.
The following quality cuts were applied to the showers after reconstruction:
-
•
Angular speed 11
-
•
Selected tubes 7.
-
•
0.85 Tubes/degree 3.0.
-
•
Photoelectrons/degree 25.
-
•
Track length , or for events extending above elevation.
-
•
Zenith angle .
-
•
, and is visible in detector
-
•
Geometry .
-
•
Profile fit .
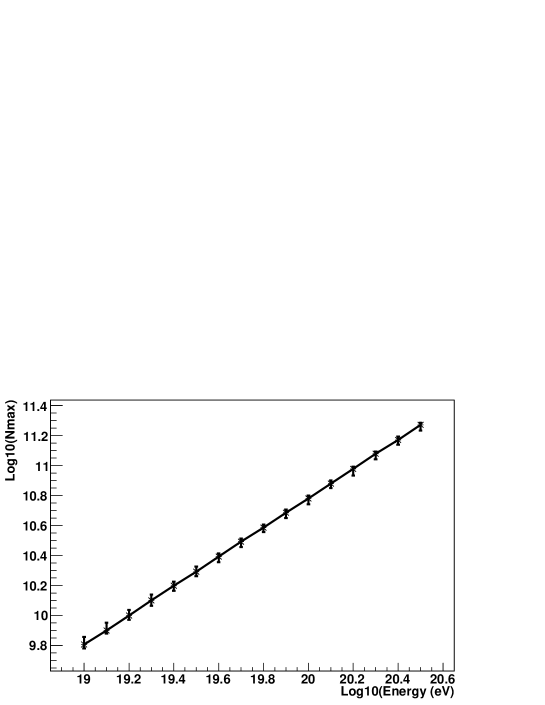
At each energy 5,000 showers were simulated and reconstructed. Fig. 11 illustrates the relation between the median and the primary energy. The error bars represent the 68% of confidence level of the reconstructed distribution. The relationship found is almost linear and can be well fitted by the equation Log10() = Log10().
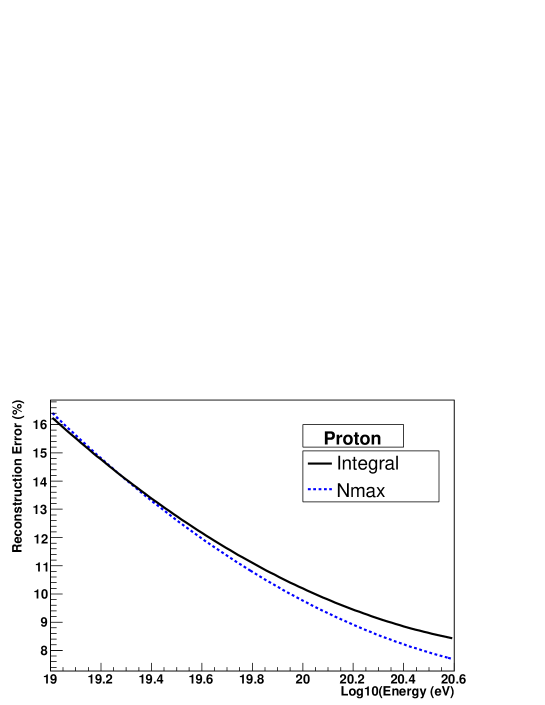
In order to test the reconstruction of the energy based on the parameter we simulated a second set of 5,000 independent showers. The energy was reconstructed using the previous equation and by integrating the Gaisser-Hillas function. Fig. 12 presents the error in the energy reconstruction as a function of the primary energy. As suggested in the calculations above, the estimator is as good as the integral procedure for energies between and eV. For energies above eV the estimator gets slightly superior to the standard integral method.
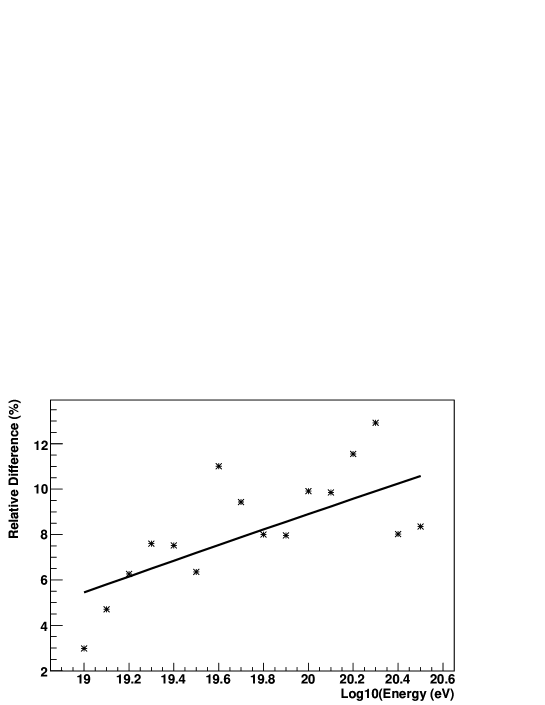
We also studied the relationship between and the primary energy for primary gamma showers. The relation is also linear and very similar to the one for protons shown in Fig. 11. Fig. 13 shows the relative difference between the median for proton and gamma showers. The difference is defined as . The points in Fig. 13 show the difference calculated with the median given by the reconstructed distribution at each energy for proton and gamma primaries. The solid line is the difference calculated using the fitted relations between energy and .
For the energy range to eV, the difference is smaller than 12%. This difference would influence the energy reconstruction in a mixed composition of proton and gamma primaries. The same effect would be seen in both reconstruction methods: and integral according to the discussion in Section II.
If a mixed composition of 50% proton and 50% gammas is considered the energy resolution would degrade but still would show a behavior similar to the one show in Fig. 12. At eV the resolution would degrade to 20% for both methods. At the resolution for the method would be 16% and for the integral procedure it would be around 18%.
VII EUSO
The same analysis were extended to the EUSO telescope. The details of this experiment were included in the simulations as explained in Section III. However, not only the telescope is different but its peculiar field of view also requires a considerable change in the shower reconstruction program. This can be verified in Fig. 4 in which we show the EUSO acceptance.
Since there are no quality cuts yet optimized for the EUSO telescope, we imposed very loose ones requiring total path length greater than and greater than 200 g/cm2 and in the field of view of the telescope. We would like to stress that different quality cuts will modify the relation between and energy presented here.
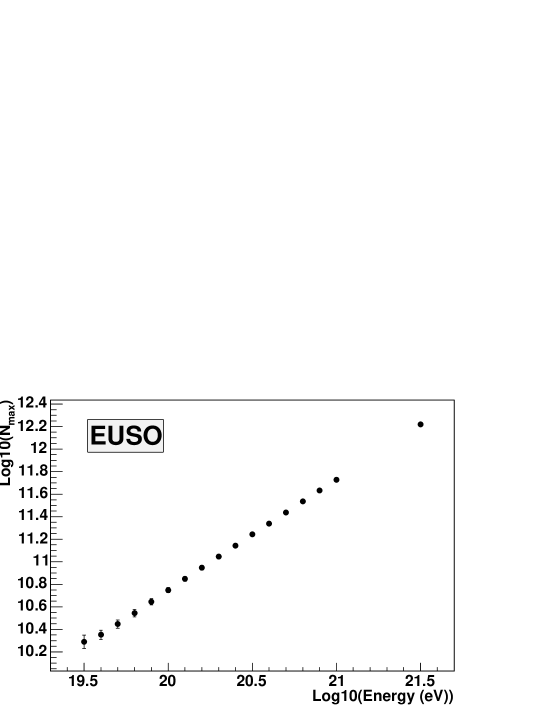
Fig. 14 shows the relation between the reconstructed and the simulated energy, which can be well approximated by the equation: Log10() = -8.95 + 0.90 Log.
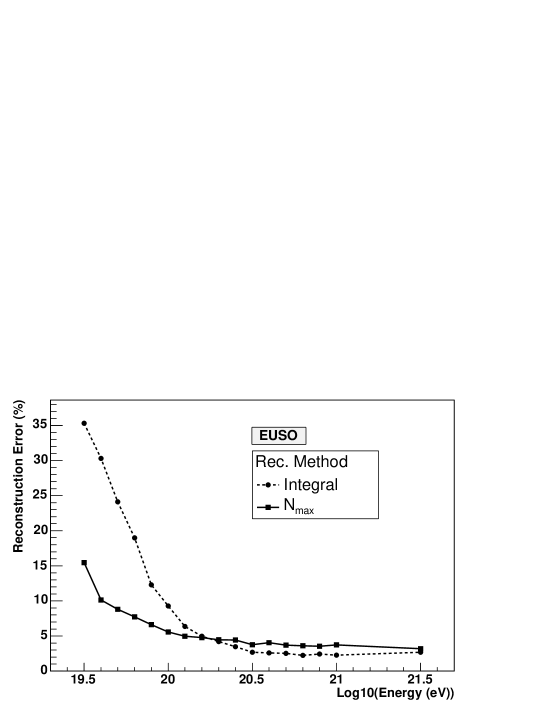
In order to test the reconstruction of the energy based on we simulated a second set of 5,000 independent shower. The energy was reconstructed using both, the equation above and the integration of the Gaisser-Hillas fitted profile. Fig. 15 shows the error in the energy reconstruction as a function of the primary energy. For energies below eV, the estimator was superior to the integral method. For energies above eV, both methods are equivalent.
These results are different from those for the HiRes-II telescopes, which confirms that the relation between and primary energy depends on the telescopes and details of the analysis, mainly the quality cuts.
The exact influence of each quality cut on the energy resolution is not completely understood at present and is out of the scope of this paper. However, the results shown here suggest that the quality cuts imposed by the HiRes Collaboration are well optimized in order to guarantee a good energy resolution for the integral method for the energy ranging from to eV. On the other hand, the loose cuts applied by us to the EUSO analysis do not achieve an optimal selection of event for energies below eV resulting in an increase of the reconstruction error for both techniques. It is also apparent that , for EUSO, is less sensitive to well calibrated cuts because, despite the fact that the errors in this method increases at lower energies, they still remain within reasonable bounds, i.e., smaller than 15% down to eV.
VIII Conclusion
In the present work, we tested the number of particles at the maximum air shower development, , as an energy estimator. The uncertainties associated with the simulation models were calculated and compared to the uncertainties in the missing energy calculation. A similar intrinsic fluctuation of around 5-10% at eV was verified for both approaches. These uncertainties decrease with increasing energy.
The systematic uncertainties in the determination of are dominated by mass composition rather than hadronic interaction models if gamma showers are taken into account. If gamma showers are excluded from the analysis, mass composition and hadronic interaction models would contribute equivalently to the total uncertainties.
Full telescope simulations were considered in our analysis. The first source of uncertainty in the reconstruction procedure is the fit of the points measured by the telescope using a Gaisser-Hillas function. We investigated the statistical uncertainties involved in the evaluation of and of the integral of the longitudinal distribution function as a function of the path length seen by the telescope. appears to be slightly better reconstructed independent from the path length observed by the telescope. At eV the difference in reconstructing and the integral is very small, however with increasing energy, at eV for example, the difference is of the order of a few percent, depending on energy (see Fig. 10).
The relation between the and primary energy for proton showers was calculated for the HiRes-II telescope including the quality cuts used by the HiRes collaboration. appears to be equivalent to the standard integral procedure as an energy estimator, with a small superiority of the approach for the highest energies (see Fig. 12). We also calculated the same relation for gamma showers and the relative difference for the proton shower is smaller than 12%. If a mixed composition of 50% proton and 50% gammas is considered the energy resolution degrades to 20% at eV for both methods. At the resolution for the method is 16% while for the integral procedure is .
The same analysis were performed for the EUSO telescope and we demonstrated that the method also works well for space based telescopes. The specific relationships, however, depend on the telescopes characteristics and reconstruction methods.
Finally, was established as a good energy estimator for fluorescence telescope with some advantages over the standard integral procedure.
IX Acknowledgments
This work was supported by the Brazilian science foundations FAPESP and CNPq. F. Sanches thanks IAG/USP for the hospitality and INFN/UNIMI for funding supports. Most simulations were carried out on a Cluster Linux TDI, supported by Laboratório de Computação Científica Avançada at Universidade de São Paulo.
References
- (1) T. Abu-Zayyad, et al., Nucl. Instr. Meth. A 450 (2000) 253.
- (2) The Auger Collaboration, Nucl. Instr. Meth. A 523 (2004) 50.
- (3) M. Teshima, et al., for the the EUSO Collaboration, Int. Cosmic Ray Conf., Tsukuba, Japan (2003) 1069.
- (4) P. Dierickx, et al., Proceedings of the Bäckaskog Workshop on Extremely Large Telescopes (2000) 43.
- (5) Y. Arai, et al., for The Telescope Array Experiment, Int. Cosmic Ray Conf., Tsukuba, Japan (2003) 1025.
- (6) C. Song, et al., Astropart. Phys. 14 (2000) 7.
- (7) D. Dawson, Auger Technical Note, GAP-02-067 (2002).
- (8) J. Alvarez-Muñiz, et al., Phys.Rev. D 69 (2004) 103003.
- (9) H. Barbosa, et al., Astropart. Phys. 22 (2004) 159.
- (10) N. N. Kalmykov, S. S. Ostapchenko, A. I. Pavlov, Nucl. Phys. B (Proc. Suppl.) 52B (1997) 17.
- (11) R. Engel, T. K. Gaisser, P. Lipari, T. Stanev, Phys. Rev. D 46 (1992) 5013.
- (12) D. Heck, J. Knapp, J. Capdevielle, G. Schatz, T. Thouw, wissenschaftliche Berichte, Forschungszentrum Karlsruhe (1998).
- (13) J. Alvarez-Muñiz, et al., Phys. Rev. D66 (2002) 033011.
- (14) T. Pierog, et al., astro-ph/0411260 (2004).
- (15) P. Homola, et al., astro-ph/0311442 (2003).
- (16) R. Risse, et al., Astropart. Phys. 21 (2004) 479.
- (17) A. M. Hillas, Nucl. Phys. B (Proc. Suppl.) 52B (1997) 29.
- (18) R. U. Abbasi, et al., Phys. Rev. Lett. 92 (2004) 151101.
- (19) R. U. Abbasi, et al., Astropart. Phys. 23 (2005) 157.
- (20) V. de Souza, G. Medina-Tanco, J. A. Ortiz, astro-ph/0411260 (2004).
- (21) V. de Souza, H. Barbosa, C. Dobrigkeit, Astropart. Phys. 22 (2004) 263.
- (22) V. de Souza, et al., astro-ph/0509496 (2005).