The Fastest Relativistic Jets: VLBA Observations of Blazars with Apparent Speeds Exceeding
Abstract
We have measured peak apparent speeds of , , and in the jets of 0235+164, 0827+243, and 1406076, respectively, based on six epochs of high-sensitivity VLBA observations at 22 and 43 GHz during 2002 and 2003 (=71 km s-1 Mpc-1, , and ). These blazars had been identified as potentially having apparent speeds exceeding 40 in an earlier VLBA survey of EGRET blazars by Jorstad et al. We therefore confirm (with high confidence in 0827+243, and lower confidence in 0235+164 and 1406076) the presence of highly relativistic pattern speeds in these three jets, although not at the levels reported by Jorstad et al. The lower limit to the bulk Lorentz factor implied by the observed apparent speeds is in these three sources, if the pattern speeds are equal to or slower than the bulk flow speed.
I Introduction
Since the discovery of apparent superluminal motion in extragalactic jets with VLBI, there have been occasional reports of very fast apparent speeds, exceeding 40 or so (e.g., Jorstad et al. 2001; An et al. 2004). Because the apparent speed of a jet places a lower limit on its bulk Lorentz factor (under the assumption of equal bulk and pattern speeds), establishing the peak apparent speed present in relativistic jets is equivalent to establishing the peak Lorentz factor of the population. The peak Lorentz factor is an important quantity for several reasons, perhaps most importantly because theoretical models of jet acceleration should be able to produce jets that reach (but do not greatly surpass) this observed maximum Lorentz factor.
Some previous claims of very fast apparent speeds have appeared upon subsequent observation to most likely be a result of component misidentification among VLBI images (e.g., 1156+295, McHardy et al. 1990; Piner & Kingham 1997), a potential problem when comparing VLBI images with possibly sparse plane coverage and a limited number of epochs. Because of their importance, and because of the possibility of component misidentification, candidate high-speed objects should be confirmed by follow-up observations.
In this paper, we report follow-up VLBI observations of the three sources 0235+164, 0827+243, and 1406076, reported by Jorstad et al. (2001) (hereafter J01) to have apparent speeds exceeding 40 (using our cosmological values, see below) 111The apparent speed reported by J01 for 0827+243 was actually due to an incorrect redshift for the source. The speed of reported by J01 for 0827+243 (using our cosmological model) is actually once the correct redshift is used.. These three objects were observed by J01 during their EGRET blazar monitoring program from 1993 to 1997. Because they monitored 42 blazars, their integration time on each and therefore their image dynamic range was limited, and some of their detections of these fast components were only slightly above their noise levels. We monitored these three sources with the NRAO Very Long Baseline Array (VLBA)222The National Radio Astronomy Observatory is a facility of the National Science Foundation operated under cooperative agreement by Associated Universities, Inc., using full-track observations to obtain images of these jets with improved sensitivity over those in J01. In this paper we use cosmological parameters km s-1 Mpc-1, , and . When results from other papers are quoted, they have been converted to this cosmology.
II Observations
We observed 0235+164, 0827+243, and 1406076 each at six epochs with the VLBA between 2002 March and 2003 May, under observation code BP089. Epochs were spaced roughly every two months, although there were also some significantly shorter (as short as six days) and longer (as long as six months) spacings between epochs. Frequencies were chosen to match the observing frequency at which the fastest reported component had been seen most clearly by J01: 0235+164 was observed at 43 GHz, 0827+243 and 1406076 were observed at 22 GHz. The total observation time at each epoch was 18 hours (for the three target sources plus calibrators). This yielded a average rms noise in the uniformly-weighted images of about 1 mJy beam-1, or roughly a factor of four lower than the average rms noise of 4 mJy beam-1 for these same three sources in J01. All observations recorded dual-circular polarization. Only the proper motion results from the total intensity data are reported here; flux and polarization variability will be presented in a subsequent paper.
Calibration and fringe-fitting were done with the AIPS software package. Images were produced using standard CLEAN and self-calibration procedures from the DIFMAP software package. Naturally weighted images (beam sizes given in Table 1) of 0235+164, 0827+243, and 1406076 are shown in Figures 1 to 3; the individual source morphologies are discussed in . Natural weighting has been used to better show some of the faint jet components, such as C1 in 0235+164. The parameters of these images are given in Table 1. Figure 4 shows a set of tapered images of 1406076 (beam sizes given in Figure 4); these tapered images show the farther out, more extended components in this source.


| Peak Flux | Lowest | |||
|---|---|---|---|---|
| Density | Contour33footnotemark: 3b | |||
| Source | Epoch | Beam444aa | (Jy beam-1) | (mJy beam-1) |
| 0235+164 | 2002 Mar 23 | 0.45,0.23,16.0 | 1.11 | 1.28 |
| 2002 Jun 27 | 0.61,0.16,12.2 | 0.83 | 1.36 | |
| 2002 Jul 3 | 0.43,0.17,10.1 | 0.94 | 1.73 | |
| 2002 Aug 30 | 0.65,0.17,15.3 | 0.92 | 1.29 | |
| 2002 Nov 15 | 0.49,0.17,11.2 | 0.85 | 1.07 | |
| 2003 May 26 | 0.68,0.20,16.5 | 0.79 | 1.90 | |
| 0827+243 | 2002 Mar 23 | 0.75,0.34,14.1 | 1.16 | 0.63 |
| 2002 Jun 27 | 0.93,0.32,8.8 | 1.65 | 1.69 | |
| 2002 Jul 3 | 0.77,0.33,8.1 | 1.63 | 1.64 | |
| 2002 Aug 30 | 0.88,0.29,7.7 | 1.65 | 1.83 | |
| 2002 Nov 15 | 0.86,0.32,12.6 | 1.20 | 0.99 | |
| 2003 May 26 | 0.80,0.32,14.9 | 1.11 | 0.98 | |
| 1406076 | 2002 Mar 23 | 1.17,0.48,5.8 | 1.11 | 0.76 |
| 2002 Jun 27 | 1.15,0.37,12.1 | 0.92 | 1.19 | |
| 2002 Jul 3 | 0.98,0.32,10.6 | 0.87 | 1.36 | |
| 2002 Aug 30 | 1.21,0.31,15.1 | 0.98 | 1.47 | |
| 2002 Nov 15 | 1.00,0.30,12.5 | 1.05 | 1.03 | |
| 2003 May 26 | 1.01,0.29,12.5 | 0.92 | 1.11 |
Numbers given for the beam are the FWHMs of the major and minor axes in mas, and the position angle of the major axis in degrees. Position angle is measured from north through east. 44footnotetext: bThe lowest contour is set to be three times the rms noise in the image. Successive contours are each a factor of 2 higher.
After imaging, Gaussian model components were fit to the visibility data using the modelfit task in DIFMAP. The cores were modeled by elliptical Gaussians, the jet components by circular Gaussians. (The cores were modeled as circular Gaussians during the early stages of the model-fitting procedure in order to ensure the correct number of components near the core, at the end of the model-fitting procedure the cores were allowed to become elliptical Gaussians in order to improve the chi-squared of the fit.) Model fitting of the visibility data allows sub-beam resolution to be obtained when the signal-to-noise ratio is high, and the locations of components near the core can be identified accurately in the model fitting even when these components appear merged with the core on the images. Identification of separate components near the core is confirmed by preliminary polarization images, which show changes in polarization properties between the core and the closest component for all three sources. Parameters of the model fits are given in Table 2, and the locations of model component centers are indicated in Figures 1 to 4. Components are identified as C1 to C6, from the outermost component inward (too much time has elapsed between J01’s observations and ours to identify any common components, so we do not attempt to continue J01’s naming conventions). We note the distinction between model ‘components’ (Gaussians fit to the visibilities) and jet ‘features’ (visually distinct regions on the images). In particular, asymmetric features may be represented by more than one component; for example, the bright eastern jet feature in 0827+243 is modeled by Gaussian components C2, C3, and C4, representing its southern edge, compact center, and trailing edge, respectively.
| 55footnotemark: 5a | 66footnotemark: 6b | PA77footnotemark: 7b | 88footnotemark: 8c | 99footnotemark: 9c | |||||
|---|---|---|---|---|---|---|---|---|---|
| Source | Epoch | Comp. | (mJy) | (mas) | (deg) | (mas) | 1010footnotemark: 10c | (deg) | 1111footnotemark: 11d |
| 0235+164 | 2002 Mar 22 | Core | 867 | … | … | 0.07 | 0.62 | 28.7 | 0.49 |
| C2 | 445 | 0.12 | 56.0 | 0.09 | 1.00 | … | |||
| C1 | 35 | 0.25 | 46.5 | 0.56 | 1.00 | … | |||
| 0235+164 | 2002 Jun 27 | Core | 747 | … | … | 0.09 | 0.28 | 17.7 | 0.55 |
| C2 | 424 | 0.16 | 64.1 | 0.10 | 1.00 | … | |||
| C1 | 16 | 0.43 | 71.2 | 0.14 | 1.00 | … | |||
| 0235+164 | 2002 Jul 3 | Core | 887 | … | … | 0.10 | 0.42 | 13.3 | 0.56 |
| C2 | 445 | 0.16 | 65.1 | 0.10 | 1.00 | … | |||
| 0235+164 | 2002 Aug 30 | Core | 963 | … | … | 0.15 | 0.32 | 8.2 | 0.56 |
| C2 | 333 | 0.19 | 73.0 | 0.12 | 1.00 | … | |||
| 0235+164 | 2002 Nov 15 | Core | 751 | … | … | 0.11 | 0.37 | 11.2 | 0.66 |
| C3 | 206 | 0.16 | 6.4 | 0.06 | 1.00 | … | |||
| C2 | 155 | 0.21 | 76.3 | 0.15 | 1.00 | … | |||
| 0235+164 | 2003 May 26 | Core | 713 | … | … | 0.04 | 0.0 | 85.5 | 0.50 |
| C3 | 195 | 0.24 | 5.1 | 0.09 | 1.00 | … | |||
| C2 | 30 | 0.37 | 51.1 | 0.10 | 1.00 | … | |||
| C1 | 10 | 0.85 | 48.6 | 0.19 | 1.00 | … | |||
| 0827+243 | 2002 Mar 23 | Core | 1139 | … | … | 0.11 | 0.39 | 63.3 | 0.66 |
| C5 | 123 | 0.23 | 121.6 | 0.13 | 1.00 | … | |||
| C4 | 17 | 1.01 | 105.7 | 0.36 | 1.00 | … | |||
| C3 | 33 | 1.22 | 110.4 | 0.10 | 1.00 | … | |||
| C2 | 29 | 1.33 | 122.7 | 0.52 | 1.00 | … | |||
| C1 | 11 | 5.67 | 135.1 | 1.91 | 1.00 | … | |||
| 0827+243 | 2002 Jun 27 | Core | 1753 | … | … | 0.16 | 0.51 | 56.0 | 0.65 |
| C5 | 69 | 0.21 | 133.3 | 0.27 | 1.00 | … | |||
| C3 | 49 | 1.27 | 111.3 | 0.14 | 1.00 | … | |||
| C2 | 52 | 1.34 | 121.0 | 0.73 | 1.00 | … | |||
| 0827+243 | 2002 Jul 3 | Core | 1669 | … | … | 0.14 | 0.26 | 69.7 | 0.69 |
| C5 | 126 | 0.19 | 140.3 | 0.22 | 1.00 | … | |||
| C3 | 58 | 1.27 | 110.9 | 0.17 | 1.00 | … | |||
| C2 | 38 | 1.36 | 122.8 | 0.74 | 1.00 | … | |||
| 0827+243 | 2002 Aug 30 | Core | 1700 | … | … | 0.15 | 0.06 | 89.5 | 0.74 |
| C6 | 235 | 0.17 | 138.4 | 0.15 | 1.00 | … | |||
| C5 | 12 | 0.53 | 107.0 | 0.01212footnotemark: 12e | … | … | |||
| C3 | 52 | 1.31 | 110.4 | 0.18 | 1.00 | … | |||
| C2 | 38 | 1.51 | 121.5 | 0.51 | 1.00 | … | |||
| 0827+243 | 2002 Nov 15 | Core | 1388 | … | … | 0.23 | 0.42 | 62.7 | 0.87 |
| C6 | 42 | 0.21 | 96.0 | 0.0 | … | … | |||
| C4 | 6 | 0.96 | 125.3 | 0.34 | 1.00 | … | |||
| C3 | 53 | 1.34 | 109.0 | 0.25 | 1.00 | … | |||
| C2 | 25 | 1.61 | 122.2 | 0.31 | 1.00 | … | |||
| 0827+243 | 2003 May 26 | Core | 1034 | … | … | 0.14 | 0.33 | 45.7 | 0.61 |
| C6 | 243 | 0.23 | 119.4 | 0.19 | 1.00 | … | |||
| C5 | 12 | 0.50 | 112.8 | 0.0 | … | … | |||
| C4 | 5 | 1.32 | 107.5 | 0.34 | 1.00 | … | |||
| C3 | 40 | 1.68 | 112.8 | 0.24 | 1.00 | … | |||
| C2 | 15 | 1.88 | 126.5 | 0.49 | 1.00 | … | |||
| C1 | 8 | 5.17 | 143.3 | 1.12 | 1.00 | … | |||
| 1406-076 | 2002 Mar 23 | Core | 1204 | … | … | 0.22 | 0.0 | 86.3 | 0.57 |
| C3 | 78 | 0.43 | 107.7 | 0.0 | … | … | |||
| C2 | 7 | 1.62 | 93.8 | 0.94 | 1.00 | … | |||
| C1 | 21 | 6.39 | 104.8 | 2.01 | 1.00 | … | |||
| 1406-076 | 2002 Jun 28 | Core | 793 | … | … | 0.10 | 0.63 | 25.3 | 0.54 |
| C4 | 253 | 0.21 | 79.8 | 0.16 | 1.00 | … | |||
| C3 | 67 | 0.45 | 107.3 | 0.28 | 1.00 | … | |||
| C2 | 12 | 2.02 | 99.6 | 2.18 | 1.00 | … | |||
| C1 | 28 | 6.51 | 104.7 | 2.38 | 1.00 | … | |||
| 1406-076 | 2002 Jul 3 | Core | 862 | … | … | 0.18 | 0.56 | 23.8 | 0.65 |
| C4 | 210 | 0.24 | 85.6 | 0.16 | 1.00 | … | |||
| C3 | 48 | 0.53 | 110.7 | 0.28 | 1.00 | … | |||
| C2 | 10 | 2.19 | 80.0 | 1.34 | 1.00 | … | |||
| C1 | 20 | 6.52 | 108.2 | 1.94 | 1.00 | … | |||
| 1406-076 | 2002 Aug 30 | Core | 986 | … | … | 0.17 | 0.63 | 27.8 | 0.58 |
| C4 | 157 | 0.25 | 78.7 | 0.14 | 1.00 | … | |||
| C3 | 121 | 0.38 | 112.4 | 0.38 | 1.00 | … |
TABLE 2—Continued
| 1313footnotemark: 13a | 1414footnotemark: 14b | PA1515footnotemark: 15b | 1616footnotemark: 16c | 1717footnotemark: 17c | |||||
|---|---|---|---|---|---|---|---|---|---|
| Source | Epoch | Comp. | (mJy) | (mas) | (deg) | (mas) | 1818footnotemark: 18c | (deg) | 1919footnotemark: 19d |
| C2 | 9 | 2.05 | 104.4 | 1.35 | 1.00 | … | |||
| C1 | 23 | 6.50 | 107.5 | 2.05 | 1.00 | … | |||
| 1406-076 | 2002 Nov 15 | Core | 1035 | … | … | 0.13 | 0.24 | 46.4 | 0.63 |
| C4 | 186 | 0.25 | 89.3 | 0.31 | 1.00 | … | |||
| C3 | 29 | 0.67 | 122.1 | 0.17 | 1.00 | … | |||
| C2 | 4 | 2.15 | 119.9 | 0.0 | … | … | |||
| C1 | 21 | 6.33 | 104.3 | 2.03 | 1.00 | … | |||
| 1406-076 | 2003 May 27 | Core | 966 | … | … | 0.19 | 0.0 | 59.2 | 0.63 |
| C5 | 131 | 0.18 | 91.9 | 0.0 | … | … | |||
| C4 | 85 | 0.43 | 99.3 | 0.31 | 1.00 | … | |||
| C3 | 24 | 0.76 | 122.6 | 0.21 | 1.00 | … | |||
| C2 | 12 | 2.32 | 101.9 | 1.74 | 1.00 | … | |||
| C1 | 20 | 6.72 | 102.9 | 1.98 | 1.00 | … |
a Flux density of the component.
b and PA are the polar coordinates of the
Gaussian center relative to the core.
PA is measured from north through east.
c and are the FWHM of the major and minor axes of the Gaussian,
and
is the position angle of the major axis.
d Reduced Chi-squared of the model.
e The size of a component occasionally goes to zero in DIFMAP model fitting,
if the size is not well constrained by the data.
III Results
Apparent speeds for the jet components in Table 2 were derived from linear least-squares fits to the separation of the components from the VLBI core versus time at two or more epochs (with the exception of the diffuse component C1 in 0827+243). These fits are shown in Figure 5. Component C1 in 1406076 is considerably farther from the core (separation about 6.5 mas) than the other components, so is not shown in Figure 5. The disappearance of a component on Figure 5 followed by its re-appearance at later epochs (e.g., component C1 in 0235+164) does not imply the literal disappearance and re-appearance of the component on the images. Rather, the component is usually present at a marginally significant level in the intervening images, but is not significant enough to have its properties well constrained by the model fitting. Multiple components close to the core are occasionally blended into a single component by model fitting, e.g., the first three detections of ‘C5’ in 0827+243 are most likely a blend of components C5 and C6 that cannot be separated by the resolution of these observations.

Error bars on component separations were defined to be a fraction of the beam size 202020Maximum extent of the projection of the two-dimensional beam onto a line joining the center of the core to the center of the Gaussian component., where was an integer from 1 to 4 that was set according to the average dynamic range of the component detection (see Table 3). The relation between and the dynamic range was calibrated using the scatter in the model-fit positions between components in the second and third epochs, which were only six days apart (hence differences in model-fit positions between these two epochs are due to errors rather than component motions). We note that the fitted apparent speeds and associated errors are not significantly different if no error bars are specified for the component positions, i.e., if the error in the apparent speed is determined by the scatter of the positions about the fit, as in Kellermann et al. (2004) (hereafter K04).
The measured apparent speeds are tabulated in Table 3. A “quality code” (Excellent, Good, Fair, or Poor) is assigned to each apparent speed measurement in Table 3, using the same criteria used for the 2 cm survey (see K04 for definitions of the quality codes). The peak measured apparent speeds were , , and for 0235+164, 0827+243, and 1406076, respectively. The minimum Lorentz factor that can produce an apparent speed, , is determined as , where is in units of the speed of light. For the highest apparent speed in each source, is approximately equal to the apparent speed (assuming these fastest measured apparent pattern speeds are equal to or less than the apparent bulk speed). Corresponding maximum angles to the line-of-sight ()) are 4.5, 4.5, and 4.1 degrees for 0235+164, 0827+243, and 1406076, respectively. We measure significantly different apparent speeds for the different components in the jets of 0235+164 and 0827+243; this detection of different apparent speeds for different components has a significance exceeding 3 for 0827+243. Implications of these different apparent speeds are discussed in .
| Source | Comp. | (mas yr-1) | 2121footnotemark: 21a | Quality222222ab | |
|---|---|---|---|---|---|
| 0235+164 | C1 | 2 | P | ||
| C2 | 4 | G | |||
| C3 | 4 | P | |||
| 0827+243 | C2 | 3 | E | ||
| C3 | 3 | E | |||
| C4 | 2 | F | |||
| C5 | 2 | P | |||
| C6 | 4 | F | |||
| 1406-076 | C1 | 1 | P | ||
| C2 | 2 | F | |||
| C3 | 2 | F | |||
| C4 | 4 | G |
Radial error bars are expressed as a fraction of the beam. 2222footnotetext: bQuality code: Excellent (E), Good (G), Fair (F), or Poor (P).
If non-radial motion is present, then the apparent speeds in Table 3 will be lower limits to the actual apparent speed (i.e., they will represent only the radial component). We investigated possible non-radial motions using the method described by K04. Separate linear fits were made to and ; this provides a fit to the direction of motion. A direction of motion significantly different from the average position angle indicates non-radial motion. We found significant non-radial motion (, toward the south) only for C2 in 1406076. The possibility of accelerated radial motion was also investigated, by performing second-order fits to , and checking the significance of the second-order term. Radial acceleration at borderline significance (2.2) was found only for C4 in 1406076. While these deviations from ballistic motion in 1406076 are formally significant, C2 is a faint (9 mJy) component that received only a ‘Fair’ quality code, and the direction of its non-radial motion is in the direction of poor angular resolution for this low-declination source. Thus, while it seems qualitatively clear that C2 exhibits non-radial motion toward the south, we have not replaced the linear fits in Table 3 with the nonlinear values.
Below we discuss some of the specific results for individual sources:
0235+164.—() This source has been noted as having varying component position angles since its early VLBI observations (Jones et al. 1984). We confirm the morphology of this source seen by J01 — the source has components at varying position angles: to the northwest at about (our C1 and C2, and J01’s B1), and to the north at about (our C3 and J01’s B2). As noted by J01, this indicates a broad projected opening angle () within about 0.5 mas of the core. The peak apparent speed measured in this paper ( for C2) is different at the 2 level from the peak apparent speed measured by J01 ( for their B1). A Lorentz factor equal to our of 26 for this source would allow Doppler factors up to 52. Very high Doppler factors of have been suggested for this source, based on its radio variability (Kraus et al. 1999) and high brightness temperature (Frey et al. 2000). K04 classify 0235+164 as a naked core at 15 GHz, suggesting that the components in this source are not long lived and are detectable only close to the core.
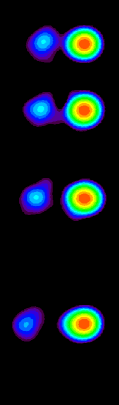
0827+243.—() Of the fastest components in our three sources, only C2 in 0827+243 has an ‘Excellent’ quality code. This is because the bright eastern jet feature (made up of Gaussian components C2, C3, and C4) is a distinct feature that is not merged with the core or any other features, so that there is no ambiguity in tracking the feature from epoch to epoch. Figure 6 shows a mosaic of four of our six images of 0827+243, where the motion of this feature at is clearly visible. The proper motion that we measure for component C2 agrees well with the proper motion of J01’s component D2 (but note that these are not the same component), the difference in the apparent speeds for these components between this paper and J01 is due solely to the different redshifts used in the two papers (see footnote (1) of Jorstad & Marscher, 2004). Analysis of the large-scale jet (Jorstad & Marscher 2004) has shown it to be highly relativistic out to kiloparsec scales.
1406076.—() We find a similar morphology to J01. The jet dims rapidly with distance from the core, and the components become faint and difficult to follow at 22 GHz. Non-radial motion of a component toward the south was seen by J01 for their component B3, similar to the path followed by our C2. However, the fitted speeds of those components are different at the 2 level: J01 measure for their B3, we measure for our C2. Note also that the very high apparent speed we measure for C2 is in part due to the low value of the radial position at the first epoch (see Figure 5, without this first point the fitted apparent speed is a somewhat lower ), although this position seems well-determined (see Figure 4).
We conclude this section by noting that our measurements of apparent speeds exceeding 25 in 0235+164 and 1406076 are, like the measurements of the apparent speeds of those two sources in J01, only of marginal confidence. This is not through any fault of the data, since these are high-sensitivity full-track VLBA observations, but is due to the fact that the jets in these two sources fade rapidly with distance from the core, so that components become faint and difficult to follow. A very fast apparent speed for component C2 in 0827+243, however, has been established with a high degree of confidence.
IV Discussion
Inspection of Table 3 shows that different Gaussian components in the same source have different apparent speeds. There are two possible origins of these different apparent speeds. The first possibility is that the components move with different pattern speeds that are not necessarily equal to the bulk speed. Lister (2005) concluded from a correlation of apparent speeds from the 2 cm and MOJAVE surveys with other source properties that various pattern speeds are present in the jets, but that the fastest measured pattern speed is approximately equal to the bulk speed (i.e., patterns are formed that move with speeds up to and including the bulk speed). In that case, our fastest measured pattern speeds of would be the speeds most indicative of the bulk apparent jet speeds for these sources in 2002 and 2003. The differences between our peak apparent speeds and those measured by J01 for 0235+164 and 1406076 of could then be due to either an actual decrease in the bulk Lorentz factor of the flow between 1995 and 2002, or the fact that no component with a pattern speed quite equal to the higher bulk speed of the jet existed during the time of our monitoring. An alternative to different bulk and pattern speeds is that the apparent bulk speed of the components changes with distance from the core, due to either a change in bulk Lorentz factor or viewing angle. This is suggested by the increase of apparent speed with distance from the core in all of our sources, and is expected in some models (e.g., Vlahakis & Königl 2004). However, such changes would also yield predictable changes in the brightness of components due to changing Doppler boosting, and these changes are not seen (however, such changes would be complicated by the intrinsic changes in the brightness of components).
A consensus appears to be forming from several recent studies that peak apparent speeds in blazar jets are about , and therefore that bulk Lorentz range up to . Example peak apparent speeds include from K04, from Jorstad et al. (2005) (excluding 1510089, see below), and from Piner et al. (2004). While there is general agreement on the statistical distribution of apparent speeds, there is considerable disagreement for apparent speeds of individual sources (e.g., 0528+134 in K04 and Jorstad et al. (2005)). Whether such different measurements for the same sources reflect actual differences in the jet with time or observing frequency, or whether they are related to different component identifications by different observers, remains to be seen. The two current outliers to the apparent speed distribution, with apparent speeds well in excess of , are 1502+106, (An et al. 2004), and 1510089, (Jorstad et al. 2005). Both sources merit continued study, to see if components are repeatedly produced in these jets.
These measurements of peak Lorentz factors attained by parsec-scale jets are useful in providing a value that must be reached by jet acceleration models. Current numerical simulations do not produce jets with Lorentz factors exceeding , but this is most likely due to the limited acceleration region caused by the limits to the numerical grid size (Koide 2004). Analytical models that are not constrained by these size limits (but that make simplifying assumptions to make the analysis tractable) have been successful in predicting acceleration of components to (Vlahakis & Königl 2004). The interplay between the apparent speed observations and the theoretical models should continue to be a valuable tool for constraining acceleration mechanisms of relativistic jets.
Acknowledgements.
Part of the work described in this paper has been carried out at the Jet Propulsion Laboratory, California Institute of Technology, under contract with the National Aeronautics and Space Administration. We acknowledge the constructive comments given by the anonymous referee. This work was supported by the National Science Foundation under Grant No. 0305475, and by a Cottrell College Science Award from Research Corporation.References
- (1) An, T., Hong, X. Y., Venturi, T., Jiang, D. R., & Wang, W. H. 2004, A&A, 421, 839
- (2) Frey, S., et al. 2000, PASJ, 52, 975
- (3) Jones, D. L., Unwin, S. C., Baath, L. B., & Davis, M. M. 1984, ApJ, 284, 60
- (4) Jorstad, S. G., & Marscher, A. P. 2004, ApJ, 614, 615
- (5) Jorstad, S. G., Marscher, A. P., Mattox, J. R., Wehrle, A. E., Bloom, S. D., & Yurchenko, A. V. 2001, ApJS, 134, 181 (J01)
- (6) Jorstad, S. G., et al. 2005, preprint (astro-ph/0502501)
- (7) Kellermann, K. I., et al. 2004, ApJ, 609, 539 (K04)
- (8) Koide, S. 2004, ApJ, 606, L45
- (9) Kraus, A., et al. 1999, A&A, 344, 807
- (10) Lister, M. L. 2005, in Blazar Variability II, in press
- (11) McHardy, I. M., Marscher, A. P., Gear, W. K., Muxlow, T., Lehto, H. J., & Abraham, R. G. 1990, MNRAS, 246, 305, and erratum 261, 464
- (12) Piner, B. G., Fey, A. L., & Mahmud, M. 2004, in Proceedings of the 7th EVN Symposium, Ed. R. Bachiller, F. Colomer, J. F. Desmurs, & P. de Vicente, 99
- (13) Piner, B. G. & Kingham, K. A. 1997, ApJ, 485, L61
- (14) Vlahakis, N., & Königl, A. 2004, ApJ, 605, 656
- (15)