The AMIGA sample of isolated galaxies
We present a complete refinement of the optical morphologies for galaxies in the Catalog of Isolated Galaxies (Karachentseva karachentseva73 (1973)) that forms the basis of the AMIGA (Analysis of the interstellar Medium of Isolated GAlaxies) project. Uniform reclassification using the digitized POSS II benefited from the high resolution and dynamic range of that sky survey. Comparison with independent classifications made for an SDSS overlap sample of more than 200 galaxies confirms the reliability of the early vs. late-type discrimination and the accuracy of spiral subtypes within 1–2. CCD images taken at the Observatorio de Sierra Nevada were also used to solve ambiguities in early versus late-type classifications. A considerable number of galaxies in the catalog ( 193) are flagged for the presence of nearby companions or signs of distortion likely due to interaction. This most isolated sample of galaxies in the local Universe is dominated by two populations: 1) 82% spirals (Sa–Sd) with the bulk being luminous systems with small bulges (63% between types Sb–Sc) and 2) a significant population of early-type E–S0 galaxies (14%). Most of the types later than Sd are low luminosity galaxies concentrated in the local supercluster where isolation is difficult to evaluate. The late-type spiral majority of the sample spans a luminosity range 18 to 22 mag. Few of the E/S0 population are more luminous than 21.0 marking an absence of, an often sought, super merger (e.g. fossil elliptical) population. The rarity of high luminosity systems results in a fainter derived for this population compared to the spiral optical luminosity function (OLF). The E–S0 population is from 0.2 to 0.6 mag fainter depending how the sample is defined. This marks the AMIGA sample as almost unique among samples that compare early and late-type OLFs separately. In other samples, which always involve galaxies in higher density environments, is almost always 0.3–0.5 mag brighter than , presumably reflecting a stronger correlation between and environmental density for early-type galaxies.
Key Words.:
galaxies: evolution – galaxies: interactions – galaxies: luminosity function – surveys1 Introduction
The AMIGA project (Analysis of the interstellar Medium of Isolated GAlaxies, see http://www.iaa.es/AMIGA.html) involves identification and parameterization of a statistically significant sample of the most isolated galaxies in the local Universe. Our goal is to quantify the properties of different phases of the interstellar media of the galaxies least likely affected by their external environment. In an earlier paper (Verdes-Montenegro et al. verdes05 (2005); hereafter Paper I) we summarized the optical properties of the Catalog of Isolated Galaxies (CIG) and presented an improved OLF. That work showed that CIG is a reasonably complete sample (80%) down to m and within 100 Mpc. Analysis of the redshift and magnitude distributions suggests that CIG ( 1050) can be interpreted in five parts:
-
1.
A local supercluster population () rich in dwarf galaxies (within km s-1) and largely unsampled in the rest of the CIG which involves galaxies with radial velocities 1500–15 000 km s-1. While many are regarded as members of groups within the local supercluster, some have been noted for their isolation (e.g. CIG 45, Makarova & Karachentsev makarova98 (1998); CIG 121, Karachentsev et al. karachentsev96 (1996); CIG 524, Uson & Matthews uson03 (2003); CIG 624, Drozdovsky & Karachentsev drozdovsky00 (2000)).
-
2.
A local supercluster population within km s-1 that contributes a few more luminous () and possibly isolated galaxies to the CIG ().
-
3.
A contribution from the lowest surface density parts of the Pisces-Perseus supercluster in the range 4000–6000 km s-1 ().
-
4.
A quasi-homogeneous population of isolated galaxies that account for about 50% of the total sample within 10 000 km s-1. This contribution is as close to a “field population” as exists in the local Universe. Early claims for such a component in a largely independent sample (Turner & Gott turner75 (1975)) were later challenged (Huchra & Thuan huchra77 (1977) (14 CIG in their sample of 39); Haynes & Giovanelli haynes83 (1983)) ().
-
5.
The remaining 250 CIG galaxies lie mostly between 10 000–15 000 km s-1 forming a high redshift tail to quasi-homogeneous component 4) and involving some of the most luminous objects in the sample. Inclusion/exclusion from an OLF calculation will only affect the bright end.
The main goal of this paper is to present a revision of optical morphologies for the CIG based upon the POSS II images. All of the above components are included in the revision in order to facilitate creation of well-defined subsamples later on. An ancillary goal involves identification of certain and suspected examples of CIG galaxies involved in one-on-one interaction. A comparison is made between previous classifications as well as recent results for restricted samples based on our own CCD data as well as Sloan Digital Sky Survey (SDSS) images. Finally we present type-specific OLFs and compare them with other, mostly recent, OLF derivations.
2 Past work on CIG morphologies
The first attempts at morphological revision of the CIG began in the years immediately after its publication (Karachentsev & Karachentseva karachentsev75 (1975); Arakelyan arakelyan84 (1984)). They were hampered by the lack of any significant number of images superior to those of POSS I. The POSS I-based early and late-type populations for the CIG are 168 (E/S0) and 883 (S/I) respectively (Sulentic sulentic89 (1989)). Despite their low resolution, classifications from POSS I based on the Kodak 103a emulsions were at least uniform. A radio continuum survey of the CIG (Adams et al. adams80 (1980)) also provided an upgrade of POSS I classifications using the glass plates rather than the photographic print version. Image-tube data for 64 likely or possible early-type galaxies were also provided. They assigned E/S0 and spiral classifications to 120 and 440 galaxies, respectively, in the approximately half of the CIG that they examined. An H i survey of a bright subsample of the CIG showed evidence that at least some of the early-type galaxies in the CIG were misclassified (Haynes & Giovanelli haynes84 (1984)). Attempts to isolate the early-type fraction in CIG have continued to this day (Aars et al. aars01 (2001); Saucedo-Morales & Beiging saucedo01 (2001); Stocke et al. stocke04 (2004)).
A few detailed studies of CIG galaxies, recognized as very isolated, also exist (CIG 947, Verdes-Montenegro et al. verdes95 (1995); CIG 121, Karachentsev et al. karachentsev96 (1996); CIG 710, Verdes-Montenegro et al. verdes97 (1997); CIG 164, 412, 425, 557, 684, 792, 824, 870, 877, Marcum et al. marcum04 (2004); CIG 96, Espada et al. espada05 (2005)). CIG have also been included in many detailed studies of smaller samples of isolated galaxies (number of CIG galaxies follows each reference): Xanthopoulos & de Robertis xanthopoulos91 (1991) (1); Marquez & Moles marquez96 (1996), marquez99 (1999) (4); Morgan et al. morgan98 (1998) (3); Aguerri aguerri99 (1999) (6); Colbert et al. colbert01 (2001) (1); Kornreich et al. kornreich01 (2001) (1); Pisano et al. pisano02 (2002) (4); Madore et al. madore04 (2004) (1); Reda et al. reda04 (2004) (2).
The goal of the AMIGA project is to extract a significant subsample of the most isolated galaxies from the CIG which should be the most isolated galaxies in the local Universe. The need for a large and uniformly selected sample of isolated galaxies is obvious especially if one wants to evaluate morphology as a function of isolation. The size of the CIG sample allows one to refine and yet retain a sample large enough to distinguish degrees of isolation and morphology statistical. Our morphology refinement complements the upcoming refinement (Verley et al. 2005) of probabilistic isolation by identifying close pairs and peculiar galaxies that might remain undetected in that more automated study.
3 The data
The only available classifications for a majority of AMIGA/CIG galaxies come from POSS I and this motivated our uniform survey with POSS II. POSS I was based on the 103a–O and E emulsions providing broad-band blue and red images for all CIG galaxies. POSS II is based on the IIIa–J and –F emulsions which provide higher contrast and resolution (100 lines/mm vs. 60 lines/mm for 103a emulsions). The higher contrast (dynamic range) is especially important for recognizing spiral galaxies with a high surface brightness bulge embedded in a lower surface brightness disk. Overall the higher resolution and contrast POSS II improved discrimination between E/S0 and spiral subtypes as well as detection of close companions. The SDSS provided CCD images for 215 CIG galaxies through the 3rd Data Release (DR3). SDSS band images (scale 0396/pixel) were extracted from the SDSS archive for all of the CIG overlap sample. This comparison sample offers an excellent test of the reliability of POSS II results.
We have obtained CCD images for more than 120 CIG galaxies with the 1.5 m Sierra Nevada Observatory (OSN) telescope near Granada (Spain). The observations involve galaxies for which POSS II classifications are regarded as uncertain. We used a 2k2k EEV CCD camera giving a 8 field with 023 pixels. Most images were obtained in the and or and bands, and reduced using standard IRAF tasks111IRAF is distributed by the National Optical Astronomy Observatory, which is operated by AURA, Inc., under cooperative agreement with the National Science Foundation.. Table 1 lists all CIGs observed at OSN with the explicited filters and exposure times, as well as the seeing.
| CIG | Filters | Exposures (s) | Seeing |
|---|---|---|---|
| 3 | 1800/1800/1800 | 18/18/18 | |
| 8 | 900/900 | 20/20 | |
| 14 | 1800/1800 | 16/14 | |
| 21 | 900/900 | 17/17 | |
| 23 | 900/900 | 23/18 | |
| … | … | … | … |
1 The full table is available in electronic form from CDS or at http://www.iaa.csic.es/AMIGA.html.
4 POSS II morphologies for the CIG
4.1 Classification considerations
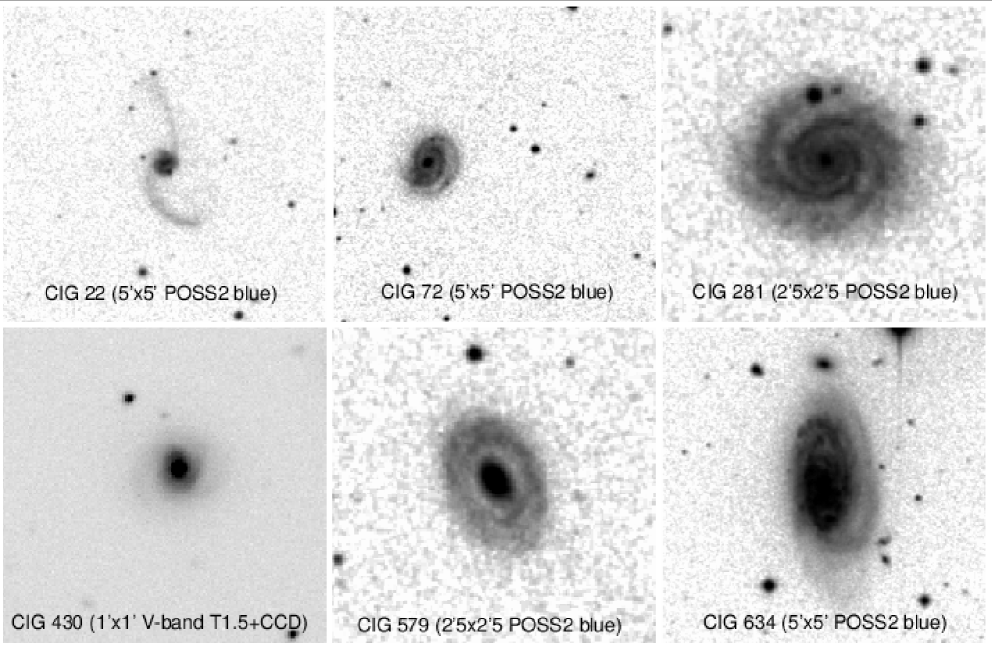
POSS II images were evaluated (see Sect. 3) using ds9 which enabled us to control zoom and scaling functions while deriving morphological types. Figure 1 shows six examples of CIG galaxies that illustrate examples of specific types or problems. Each image is labeled with a CIG designation as well as information about the origin of the image. The individual images will be discussed in the text where appropriate. All types were derived by JWS with AD providing independent estimates for the 200 galaxies previously classified as early-type. Classifications for the bulk of the sample follow the basic Hubble sequence with spiral sub-types estimated from the observed bulge to disk ratio (e.g. = Sb). In the majority of CIG spirals this ratio is reasonably unambiguous, however for some spirals the presence of an inner ring can confuse the classification. A small nuclear bulge (e.g. ) indicates an Sc type but a small bulge embedded in an inner ring can cause one to assign an earlier type. In some cases a small nuclear bulge can be resolved within the ring and other times not. These galaxies would be classified Sc and Sab–Sb, respectively. Only detailed surface photometric studies can resolve this kind of ambiguity. The images for CIG 281 and 579 show, respectively, examples of common small (Sc) and rare large (Sab) bulge spirals. Openness of spiral arms is not taken as a type indicator but rather as an indication of tidal perturbation. We argue, for example, that it is meaningless to assign a standard Hubble type of Sc or Sb to a galaxy like CIG 22 (Fig. 1). While the presence/absence of a bar was noted in unambiguous cases the results are unlikely to carry much statistical weight given the plate-to-plate variations at POSS II resolution. Another difficulty involves distinguishing between E, S0 and Sa types. We found the IIIa images to be surprisingly effective for detecting a disk component (via an inflection in ) in early types. This means that differentiating between E and S0 was effective with discrimination between S0 and Sa the larger challenge especially beyond km s-1.
4.2 Distorted morphologies/minor interactions
We removed objects from the sample that unambiguously violate the goal of the CIG catalog. Thirty-two involve interacting systems (CIG 6, 22, 31, 62, 63, 76, 80, 85, 126, 146, 247, 293, 349, 439, 468, 634, 687, 701, 761, 773, 787, 796, 809, 819, 853, 921, 940, 946, 977, 1027 and 1038) with the other identified as a local globular cluster (CIG 781). We also noted 161 entries where interaction is suspected based upon evidence for asymmetries/distortions that might be of tidal origin, as e.g. CIG 72. CIG 72 and 634 (with companions) are illustrated in Fig. 1. In the latter case the companion redshift is consistent with physical association while in the former the companion has not been identified. Some of these objects were noted in previous CIG analysis but we have chosen to start from scratch in order to proceed in an uniform way.
Statistics in Table 2 are based upon the 1018 CIG sources that remain when the clearly interacting galaxies are removed. This tabulation does not exhaust the number of CIG with faint “companions” because some evidence of perturbation of the CIG primary was required to warrant designation as suspected interaction. Surprisingly, many of the latter cases show no evidence for a companion brighter than 17 mag. A fundamental question raised by this result involves how much detectable kinematic/morphological perturbation can be caused by a dwarf companion (see Espada et al. espada05 (2005) for the beginning of detailed follow-up on some of these cases). This statement assumes of course that the features were not produced by an accretion event which, in any case, is more difficult to prove. All of the suspected interacting systems were assigned a Hubble type and retained in the statistics. Many/most additional, especially late-type spirals, are accompanied by small low surface brightness objects that in many cases could be dwarf companions in the 15 absolute magnitude range. Their POSS II detectability depends on the quality of a particular plate. Perhaps, in this sense, no luminous spiral can be called “isolated”.
| Type | I/A=? | /215 | ||||
| I/A | 32 | — | 0 | |||
| E | 5 | 58 | 0.057 | 1 | 7 | 0.032 |
| E/S0 | 3 | 14 | 0.014 | 0 | 4 | 0.019 |
| S0 | 2 | 67 | 0.066 | 3 | 17 | 0.079 |
| S0/a | 0 | 19 | 0.019 | 2 | 7 | 0.033 |
| Sa | 1 | 13 | 0.013 | 2 | 3 | 0.014 |
| Sab | 2 | 52 | 0.051 | 8 | 11 | 0.051 |
| Sb | 3 | 159 | 0.156 | 20 | 25 | 0.116 |
| Sbc | 4 | 200 | 0.196 | 40 | 33 | 0.153 |
| Sc | 5 | 278 | 0.273 | 68 | 69 | 0.321 |
| Scd | 6 | 61 | 0.060 | 7 | 15 | 0.070 |
| Sd | 7 | 41 | 0.040 | 7 | 13 | 0.060 |
| Sdm | 8 | 15 | 0.015 | 0 | 7 | 0.033 |
| Sm | 9 | 15 | 0.015 | 1 | 3 | 0.014 |
| Im | 10 | 26 | 0.026 | 2 | 7 | 0.033 |
| E–S0 | 139 | 0.137 | 4 | 28 | 0.130 | |
| Sa–Sd | 804 | 0.790 | 152 | 169 | 0.786 | |
| Sb–Sc | 637 | 0.626 | 128 | 127 | 0.591 |
4.3 Results of the reclassification
Table 3 presents results of the POSS II based morphological reevaluation for 1000 km s-1 and is formatted as follows: 1) CIG number, 2) estimated Hubble type (a “:” indicates uncertain type and need for better imaging data), 3) a “y” indicates secure presence and a “n” clear absence of a bar, 4) a “y” indicates a morphologically distorted system and/or almost certain interacting system while ”?” indicates evidence for interaction/asymmetry with/without certain detection of a companion. Table 4 presents a tabulation of literature classifications for CIG galaxies within km s-1. This table is a companion to Table 2 in Paper I that summarized redshift independent distance determinations for these nearby galaxies. Galaxies within 1000 km s-1 are tabulated separately because standard Hubble morphologies are not very useful for these local galaxies. Table 2 summarizes the breakdown of Hubble subtypes in terms of the number and sample fraction. The numerical scale is taken from RC3 and the correspondences are given in the table.
| CIG | (RC3) | Bar | Interacting |
|---|---|---|---|
| 1 | 5 | n | ? |
| 2 | 5 | y | |
| 3 | 3: | ||
| 4 | 5 | ||
| 5 | 4 | ||
| … | … | … | … |
1 The full table is available in electronic form from CDS or at http://www.iaa.csic.es/AMIGA.html.
| CIG | Morphology | Reference2 |
|---|---|---|
| 45 | Im/BCD | 1 |
| ” | SAm | 2 |
| 105 | SAB(s)d | 3 |
| ” | SBc(s) | 4 |
| ” | SBc | 5 |
| … | … | … |
Table 2 reveals that the CIG is dominated by two types of galaxies: 1) late-type galaxies with 82% of the CIG in the range Sa–Sm ( 1–9) and 2) early-type E–S0 galaxies comprising about 14% of the sample. Early-type spirals are quite rare with Sa–Sab representing only 6% of the sample while Sb–Sc are the prototype CIG population compromising 63%. The early-type spiral fraction may be even smaller than the numbers suggest as some of these have very uncertain classifications. Distinction between types Sa/Sab/Sb is more ambiguous than for Sb/Sbc/Sc and a large part of this ambiguity involves the more frequent presence of inner rings in the former range. Given the uncertainties about degree of isolation for types later than 6–7 that are: a) largely within the local supercluster and b) undetectable beyond a few 1000 km s-1, we are unable to characterize any very isolated low luminosity population.
Figure 2 shows the distributions of new morphologies as a function of recession velocity () while Fig. 3 shows the distributions as a function of absolute magnitude (). The latter are derived from (Paper I) assuming H km s-1 Mpc-1. The horizontal dotted line indicates the sample derived in Paper I for the most complete part of the CIG between mB-corr = 11 and 15.0 mag.


4.4 POSS II versus old and new classifications
Comparison of CIG types from the literature for individual CIG galaxies sometimes spans the entire Hubble sequence. POSS II classifications represent an order of magnitude improvement in reliability especially for: 1) discrimination between early (E–S0) and late-types (Sa–Im) as well as 2) determination of spiral subtypes to within –2. Figure 6 compares our new classifications with those from: a) the original CIG compilation (Karachentseva karachentseva73 (1973), K73) based upon POSS I, b) the Lyon-Meudon Extragalatic Database (LEDA), c) the NASA/IPAC Extragalactic Database (NED) and d) the CCD images of the SDSS. LEDA and NED types represent a partial improvement over POSS I because they include literature types based on higher quality photographic or electronic images. At least half of the sample types remain POSS I after the upgrades provided by these somewhat redundant samples. Figure 6 presents histograms showing the distribution of differences in type assignment in the sense POSS II “other”, where “other” can be K73, LEDA, NED or SDSS. The RC3 system contains no major type designation for or so for the purpose of Fig. 6 the early types were moved to E = 3, E/S0 = 2 and S0 = 1, in order to maintain a constant interval between all types in the comparison histograms. Two trends are reflected in the K73, LEDA and NED comparisons: 1) an asymmetry favoring small positive differences, and 2) a very broad base with values from to . The former shows the tendency for spiral types to become later because bulges are better defined with POSS II. The latter reflects larger changes from early- to late-type or vice versa. The LEDA database appears to give the most reliable measures prior to POSS II.
A good test of the robustness of POSS II classification comes from an overlap sample of 215 CIG galaxies in SDSS. This CCD-based survey provides the best available seeing limited images. We reevaluated Hubble types using the SDSS images without reference to the POSS II classifications. Figure 6d shows the results of a comparison in the sense POSS II SDSS. Since the same observer made both sets of classifications this will be a test of consistency/robustness rather than absolute accuracy of type assignments. The results of this comparison are encouraging in the sense that there is close agreement between POSS II and SDSS derived types. We find exact agreement () for about one half of the overlap sample probably reflecting the ease of recognition of the majority Sb–Sc population on both datasets. The bulk of additional objects ( 65) lie within . There is a slight asymmetry toward negative values, which reflects the ability of SDSS to resolve the bulge component in spirals more easily than POSS II, resulting in a shift toward later type.
SDSS confirms the core populations identified with POSS II. 58% of the galaxies in the SDSS subsample are concentrated in the range Sb–Sc. The mostly local late-type (Sd–Im) contributes about 14% (same as POSS II) while Sa–Sab galaxies contribute about 6%. The E–S0 fraction in SDSS is similar to POSS II at 14% with S0 apparently twice as numerous as ellipticals, representing a decrease in the number of E and an increase in the S0 population. 12 of 39 objects in the SDSS subsample previously assigned I/A=? (see Table 2) are rejected. Either signs of distortion were not confirmed on the SDSS images or available SDSS spectra revealed that suspected companions showed a different redshift from the CIG galaxy. There are thirty CIG galaxies whose type was changed from E–S0 to spiral in our POSS II reevaluation. Most of these objects did not show obvious spiral structure on POSS II. However in our judgment they showed colors (blue) and structure (flatter than law luminosity distribution or evidence for high spatial frequency structure) more similar to distant spirals than to E/S0 systems. All six galaxies from this population with SDSS data confirm our spiral classifications. SDSS confirms the utility of POSS II for galaxy classification in the local Universe.
Table 5 lists morphologies derived from our new observations from the OSN, as well as types from POSS II to facilitate comparison, together with the interaction status. An additional 69 galaxies observed did not warrant a type change either because of confirmation or because the new CCD data was obtained in seeing conditions which did not improve upon the POSS II discrimination. Most changes were small except for a population of early-type crossovers. The new CCD data suggest a change from late to early type for 13 galaxies (3 to E, 1 to E/S0 and 9 to S0) and a change from early to late-type for 5 galaxies. Not surprisingly most of the crossovers involve the faintest galaxies in CIG ( 10 with 15.0). The remaining brighter galaxy changes ( 8) that could affect the OLF involve 4 early-type losses and 4 gains that effectively cancel out any possible change. These are the most difficult objects to classify in our sample.
| CIG | OSN | POSS II | ||
|---|---|---|---|---|
| I/A | I/A | |||
| 21 | ? | |||
| 57 | 2 | 3 | ||
| 70 | 2 | 10 | ||
| 74 | 5 | ? | 4 | |
| 87 | ? | |||
| … | … | … | … | … |
In 69 other cases no change was warranted
due to confirmation or images that did not improve upon POSS II.
2 The full table is available in electronic form
from CDS or at http://www.iaa.csic.es/AMIGA.html.

5 The OLF of isolated galaxies as a function of morphology
5.1 Results for the CIG sample
Figure 7 shows OLFs for four morphological bins: E–S0, Sa–Sab, Sb–Sc, and Scd–Im. The first and third bins (E–S0 and Sb–Sc) are most important from the point of view of AMIGA. Table 6 gives best fit Schechter function parmeters for the above bins as well as some extra binnings to facilitate comparison with other samples. The and parameters for the morphological bins are plotted in Figs. 8 and 9. The Sb–Sc population shows a best fit that is 0.2–0.6 brighter than for the E–S0 population, confirming the scarcity of luminous early-types seen in Fig. 5. The E–S0 sample is rather small ( for the full sample and restricting to galaxies in the range ). The result is that the Schechter fit parameters change with small sample modifications. In contrast the Sb–Sc OLF is much more robust with a sample of galaxies in the range. If we restrict the E–S0 derivation to bins containing or more galaxies we obtain , yielding a difference of 0.6 between the E–S0 and Sb–Sc populations, rather than 0.2 mag obtained from Table 6. No matter how we cut our sample, the early-types are fainter than the Sb–Sc sample. In order to better assess the significance of the difference between these samples we performed a nonparametric characterization. Table 7 shows the results of a comparison of the means and 25th, 50th and 75th for the E–S0 and Sb–Sc populations, ranging from the full CIG subsamples to those corresponding to the most complete range (between ). All of them confirm the fact that our E–S0 population is underluminous compared to our Sb–Sc population.
The Sa–Sab population shows the brightest value for a Hubble type bin but with correspondingly large uncertainty reflecting the small sample size. The parameter here and elsewhere must be considered of limited value in the absence of galaxies fainter than to in the bulk of our sample. The steep parameter for the Scd–Im bin reflects the strong contribution of low luminosity dwarfs in the local part of the sample. The high value for for these late-types reflects the rigidity of the Schechter function which, in the presence of such a strong dwarf contribution yields an artificially high . This is amplified by bright Scd–Sd spirals (see Fig. 3) included in that bin. The I/A=y subsample shows the brightest value of possibly reflecting two effects: 1) in some cases magnitude estimates may represent the combined light and 2) optical luminosities in paired galaxies are enhanced by a factor of about 2.0 (Xu & Sulentic xu91 (1991)). We see here evidence for the nurture signature that we are trying to avoid. We note that there is no detectable difference in the OLFs for galaxies with the I/A=? designation and the non-interacting ones.
| Types | (Mpc-3 mag-1) | N | ||
|---|---|---|---|---|
| E | 3.2( 3.4) 10-5 | 1.24 0.67 | 20.16 0.75 | 27 |
| S0 | 4.0( 2.6) 10-5 | 1.53 0.26 | 20.17 0.37 | 36 |
| Sb | 1.2( 0.3) 10-4 | 1.00 0.19 | 20.24 0.16 | 115 |
| Sbc | 1.5( 0.3) 10-4 | 0.91 0.17 | 20.30 0.14 | 159 |
| Sc | 2.1( 0.4) 10-4 | 0.80 0.18 | 20.20 0.14 | 196 |
| Sd | 0.9( 0.7) 10-4 | 0.51 0.39 | 19.64 0.46 | 7 |
| E–S0 | 1.0( 0.4) 10-4 | 1.17 0.24 | 19.99 0.26 | 71 |
| Sa–Sab | 3.0( 1.6) 10-5 | 1.53 0.27 | 20.67 0.31 | 51 |
| Sb–Sc | 5.1( 0.5) 10-4 | 0.76 0.10 | 20.17 0.08 | 470 |
| Sd–Im | 4.5( 0.4) 10-4 | 1.98 0.20 | 20.09 0.42 | 59 |
| I/A=y | 1.1( 0.9) 10-5 | 1.83 0.27 | 20.82 0.44 | 24 |
| I/A=? | 1.6( 0.3) 10-5 | 0.94 0.18 | 20.10 0.14 | 132 |
| I/A=n | 6.1( 0.7) 10-4 | 1.23 0.06 | 20.35 0.07 | 713 |
| Sample | 75th | 50th | 25th | Mean |
|---|---|---|---|---|
| E–S0: All | 20.593 | 20.080 | 19.200 | 19.599 0.167 |
| E–S0: km s-1 | 20.625 | 20.140 | 19.355 | 19.949 0.086 |
| E–S0: km s-1, | 20.622 | 20.230 | 19.504 | 20.044 0.106 |
| Sb–Sc: All | 20.999 | 20.495 | 19.925 | 20.355 0.039 |
| Sb–Sc: km s-1 | 21.020 | 20.526 | 19.984 | 20.418 0.037 |
| Sb–Sc: km s-1, | 21.072 | 20.590 | 20.065 | 20.480 0.041 |

5.2 Comparison of morphology dependent CIG OLF with other samples
In this section we compare our type-specific OLFs with results from other samples involving a range of environments. There are two reasons for such a comparison: 1) OLFs as a function of type and environment have recently become available for several large galaxy surveys and 2) we want to see if our conclusions about the morphologies of galaxies in the lowest density environments are consistent with these new survey results. We concentrate on the shape of the OLF rather than the space density () which is difficult to compare and of less interest in the AMIGA context. Derived Schechter fit parameters for all relevant subsamples are detailed in Table 8. All published values of have been reduced to H0 = 75 km s-1 Mpc-1 and transformed to using the relations given in Paper I. This forms the principal basis for comparison because is sensitive to the faint end which AMIGA cannot effectively sample beyond the local supercluster.
| Morphology | Sample | (Mpc-3 mag-1) | MB-corr | |
| Early types | 2dFGRS - void1 | 0.28( 0.10) 10-3 | 0.15 0.53 | 19.30 0.33 |
| Early types | 2dFGRS - void2 | 0.68( 0.17) 10-3 | 0.43 0.24 | 19.84 0.14 |
| Early types | 2dFGRS - mean | 1.73( 0.19) 10-3 | 0.39 0.11 | 20.06 0.08 |
| Early types | 2dFGRS - cluster | 15.6( 7.7) 10-3 | 1.12 0.14 | 20.81 0.18 |
| Late types | 2dFGRS - void1 | 1.02( 0.55) 10-3 | 1.14 0.24 | 19.46 0.19 |
| Late types | 2dFGRS - mean | 3.37( 0.61) 10-3 | 1.00 0.07 | 19.92 0.07 |
| Late types | 2dFGRS - cluster | 22.7( 12.2) 10-3 | 1.09 0.20 | 20.02 0.18 |
| E–S0 | SSRS2 | 1.9( 0.8) 10-3 | 1.00 0.09 | 20.27 0.10 |
| Sa–Sd | SSRS2 | 3.4( 1.4) 10-3 | 1.11 0.07 | 20.33 0.08 |
| Irr–Pec | SSRS2 | 0.2( 0.08) 10-3 | 1.81 0.24 | 20.68 0.50 |
| E | NOG | 0.46( 0.12) 10-3 | 0.47 0.22 | 20.61 0.26 |
| S0 | NOG | 0.81( 0.20) 10-3 | 1.17 0.20 | 20.30 0.26 |
| Sa–Sb | NOG | 2.20( 0.46) 10-3 | 0.62 0.11 | 20.37 0.12 |
| Sc–Sd | NOG | 3.12 ( 0.59) 10-3 | 0.84 0.10 | 20.25 0.11 |
| Sm—Im | NOG | 0.07( 0.07) 10-3 | 2.41 0.28 | 20.97 0.72 |
| E–S0 | NOG | 1.03( 0.29) 10-3 | 0.97 0.14 | 20.55 0.18 |
| Sa–Im | NOG | 4.58( 0.73) 10-3 | 1.10 0.07 | 20.49 0.09 |
| Field | NOG | 1.10 0.06 | 20.53 0.08 | |
| Groups | NOG | 1.19 0.10 | 20.45 0.12 | |
| All | SDSS - void | 0.08( 0.04) 10-2 | 1.18 0.13 | 20.36 0.11 |
| All | SDSS - wall | 0.60( 0.03) 10-2 | 1.19 0.07 | 21.24 0.08 |
Comparison samples include:
-
•
2dFGRS samples the redshift range down to and includes 81387 galaxies (Croton et al. croton05 (2005)). It is divided between early- and late-types based on spectral characteristics of the galaxies. They distinguish between “void”, “mean” and “cluster” environments in seven subsamples based on the density contrast in spheres of radius Mpc, with the most extreme void subsample similar in size to the CIG. The CIG contains few galaxies in recognized voids however it is not clear that 2dFGRS makes any distinction between a void galaxy and a single galaxy that is very isolated.
-
•
The Second Southern Sky Redshift Survey (SSRS2, Marzke et al. marzke98 (1998)) samples a volume similar to CIG () down to a similar magnitude limit , and contains 5404 galaxies. Morphological classifications come from several sources, ranging from detailed to rough designations. Three broad morphological classes are defined: E/S0, spiral and irregular/peculiar, without environmental distinction.
-
•
The Nearby Optical Galaxy (NOG) sample (Marinoni et al. marinoni99 (1999)) involves 6392 galaxies within = 5500 km s-1 and brighter than , therefore corresponding to the inner part of CIG. They distinguish subsamples according to various group properties (Garcia garcia93 (1993)) for a total of 4025 galaxies. Any galaxy not included in one of the group categories is considered “field”. The morphologies were compiled by Garcia et al. (garciaetal93 (1993)) from RC3.
-
•
A sample of 1000 “void” galaxies extracted from the early data release (sample 10 in Blanton et al. blanton03 (2003) involves 155126 galaxies) of SDSS (Rojas et al. rojas04 (2004), Hoyle et al. hoyle05 (2005)). This volume limited sample extends out to . The void sample is compared to a “wall” sample of 12732 galaxies drawn from the same database. The void sample spans a galaxy luminosity range that is similar to CIG.
-
•
A sample of 102 E and S0 galaxies from the CIG studied by Stocke et al. (stocke04 (2004)) after morphological revision based on new images for 80 and 86% of the E and S0 galaxies, respectively. The remaining galaxies in the sample were given POSS I classifications.
Croton et al. (croton05 (2005)) find the 2dFGRS void population to be composed of primarily late-type galaxies with early-types dominating the cluster population. Early-types are also seen in the void sample which is consistent with our result where 14% of AMIGA galaxies show E–S0 morphologies. The 2dFGRS early-type OLF shows an that decreases systematically (by 1.5 magnitudes) from cluster to void environments. Comparison of Tables 6 and 8 shows that our early-type value is close to their “void2” population. If we remove from our OLF derivation the sample bins with galaxies as described above our results are closest to the 2dFGRS “void1” result (within ) more consistent with AMIGA representing, as we argue, the most extreme local isolated galaxy sample. The dependence of for early-types on the local environment is also found in the analysis of an SDSS sample (Hogg et al. hogg03 (2003)), where “red” galaxies are found to be sensitive to environmental overdensity.
The situation for late-types is less clear. In the SDSS sample “blue” galaxies are relatively insensitive to the environment, while late-type (blue) galaxies in the 2dFGRS show little change in the OLF across all density environments except for a luminosity decrease in the void populations. However our value for late-types is from 0.6–1.1 magnitudes brighter than the 2dFGRS “void1” value. One possible explanation for this difference is that 2dFGRS includes a large population of low-medium luminosity isolated spirals that we do not sample. If so it is well disguised (at least brighter than ) because their late-type parameter values are only slightly steeper than ours. We note that their late-type void values are the lowest of any we consider in Table 8 including an SDSS void estimate discussed later. Hence we interpret the better agreement of CIG with the 2dFGRS early-type OLF to indicate that the disagreement in the late-type population involves an underestimate of for the 2dFGRS. Our late-type is consistently brighter than our early-type value and this is confirmed by more robust tests of the difference in mean luminosity between our early and late-type samples. Overluminous spirals are common in our sample while overluminous early-types are rare. If a bias was operating in the CIG selection process then one would expect it to favor the overluminous early-types at the expenses of the less luminous galaxies.

SSRS2 finds no significant difference between the OLFs for early- and late-type (Sa–Sd) galaxies. Our late-type value agrees closely with theirs while our early-type sample is fainter than their corresponding value. This is most likely due to the lack of environmental discrimination in SSRS2 which permits inclusion of overluminous E–S0 that prefer denser environments. It is difficult to compare because SSRS2 goes deeper than AMIGA and should more effectively sample the dwarf galaxy population. Our Sd–Im bin shows a faint end parameter similar to the Irr/Pec bin of SSRS2 again perhaps reflecting the strong contribution from local dwarfs that is present in our sample. The bright must be attributed to the “peculiar” galaxy part of that population.
The NOG sample (Marinoni et al. marinoni99 (1999)) also argues that the early and late-type OLFs are very similar. NOG early-types show a flatter OLF than in CIG with brighter . The NOG for elliptical galaxies is 0.3–0.4 brighter relative to both spirals and lenticulars while we find to be very similar for our E and S0 subsamples (and less than for spirals). This again likely reflects the inclusion of an overluminous elliptical population found in the richer environments sampled by NOG but that are absent from AMIGA. NOG results for late-type galaxies show and parameters consistent with the CIG. The steep found by NOG () is presumably driven by local group dwarfs. In Paper I we also obtained a steeper ( instead of ) when galaxies within km s-1 were included although not as steep as NOG. That may reflect an underrepresentation of luminous spirals within km s-1 thus allowing to drive the Schechter fit. The – degeneracy makes this possible. The type-specific OLFs given in NOG do not indicate any environmental discrimination.
The SDSS has been used to study the properties of a void sample (Rojas et al. rojas04 (2004); Hoyle et al. hoyle05 (2005)). Void galaxies are found to be significantly bluer over a wide luminosity range. If one assumes that blue = late-type Sb–Sc then AMIGA is consistent with such a result. SDSS found for their void sample to be one magnitude fainter than their “wall” sample. All or most of this difference can again be ascribed to the presence of a significant overluminous early-type population in the wall sample. The and parameters of the void sample are similar to our complete sample values (Paper I). A closer comparison is not possible because, unless we misinterpret the definition (i.e. fewer than three volume limited neighbors within a fixed radius), the selection does not exclude one-on-one interactions. An isolated pair sample like CPG (Catalog of Paired Galaxies; Xu & Sulentic xu91 (1991)) would not be excluded from the void population because such pairs are found in regions of low density contrast. Evidence that: 1) components of such pairs are twice as bright as isolated galaxies of similar types and 2) interacting pairs comprise 10% of the field galaxy population suggests that this contamination can confuse our interpretation of an environment signature in this kind of sample (see I/A=y sample in Table 6).
Stocke et al. (stocke04 (2004)) argue for a luminous “fossil” elliptical population in the CIG in contradiction with an earlier study (Sulentic & Rabaca sulentic94 (1994)). We disagree for two reasons: 1) problems with morphologies and 2) misinterpretation of the OLF comparison sample. We disagree with a number of their assigned E/S0 types and argue that CIG 57, 178, 284 (observed with Chandra as an E or S0), 417, 427, 430 (see Fig. 1), 589, 640 and 690 are spirals while the most luminous object in their sample (CIG 701) is an interacting pair (I/A=y). They compare mag ( = 70 km s-1 Mpc-1) derived from their complete sample of ellipticals with a value obtained in the CfA1/CfA2 survey (Marzke et al. 1994a b ), and find agreement which they interpret as evidence for an overluminous elliptical population in the CIG. We suggest that one must consider this result in the context of values for the spiral population as well. Both the CfA spiral and S0 values are 0.5 magnitudes fainter than the E value. An elliptical population brighter than spirals is typically what one finds when comparing populations for a sample that includes galaxies in richer environments. All of this assumes that the CfA morphologies are reliable and, in this context, we mention that CfA1 types come from multiple sources while CfA2 types were taken from POSS I. A follow up SSRS2 survey (Marzke et al. marzke98 (1998)) finds agreement between for the E/S0 and S subsamples in contradiction with Marzke et al. (b ), spirals being brighter in SSRS2 than in CfA. The disagreement between the SSRS2 and CfA surveys has been ascribed to errors in Zwicky magnitudes or to the earlier study sampling galaxies in richer environments. A detailed study of Zwicky magnitudes (Bothun & Cornell bothun90 (1990)) suggests that some spiral types (e.g. highly inclined) were measured systematically fainter in the Zwicky system. This would contribute towards making CfA spirals too faint relative to spirals in SSRS2. The latter environmental explanation does not seem likely since a higher environmental density would tend to produce brighter ellipticals, rather than fainter spirals.
Our own complete sample of 27 ellipticals yields mag which is not very different from the Stocke et al. (stocke04 (2004)) value, however earlier we showed how we can significantly dim for the elliptical sample with a reasonable truncation of the luminosity range used for the OLF estimation. We also showed how the faintness of our E/S0 sample relative to our much larger spiral sample is significant and robust. It makes no sense for AMIGA and CfA early-type OLFs to agree more closely than the spiral ones. Rather than comparing values based on small samples of ellipticals we prefer the following line of reasoning. The key point is that the luminosity of an ellipticals population is much more sensitive to environment than a corresponding spiral population. is robustly brighter in early vs. late-type comparisons. AMIGA and, e.g., 2dFGRS show that ellipticals become fainter in isolated environments until their mean (or ) value equals, or even drops below, the spiral value. Luminous spirals do not show this environmental sensitivity. A sample that shows an early-type similar in brightness to a late-type does not contain a luminous fossil elliptical population. We are speaking here about samples of luminous galaxies (e.g. brighter than 18 or 19). Surveys that go deeper can confuse this straightforward reasoning if a large population of dwarf galaxies are included in an OLF calculation (as was previously discussed for the 2dFGRS spiral sample). None of the samples discussed here goes significantly deeper than AMIGA. The only effect of dwarf galaxies on this comparison involves inclusion/exclusion of local dwarfs.


6 Discussion
CIG-based AMIGA sample is a magnitude limited sample with quite reasonable level of completeness from which a volume limited sample could be selected. The main goal of AMIGA is to maximize a sample of the most isolated galaxies in the local Universe, galaxies in regions of both: 1) low galaxy surface density and 2) unaffected by one-on-one interactions. The overall impression gained from the morphology survey is that a truly isolated massive galaxy may not exist. Typically luminous isolated galaxies often show an apparent excess of dwarf companions that are 4–5 magnitudes fainter than the AMIGA galaxy (see also Reda et al. reda04 (2004) and Smith et al. smith04 (2004)). In many of these cases (I/A=? should be the most obvious examples) the AMIGA galaxy shows clear signs of distortion (e.g. CIG 72 in Fig. 1) raising the question of what kind of damage a dwarf companion can do to a massive spiral. In the case of CIG 72 we also find a Seyfert nucleus further emphasizing the question (CIG 634 in Fig. 1 is a LINER). Our recent detailed VLA H i study of CIG 96 (Espada et al. espada05 (2005)) faced the same question. In this case a bright spiral showing morphological and kinematic disturbance in an “isolated” environment except for a dwarf companion that is: 1) 4.8 magnitudes fainter and 2) with less than 1% of the H i mass of the CIG primary.
AMIGA identifies two primary populations of extremely isolated galaxies from the CIG:1) 14% E–S0 and 2) 63% Sb–Sc. The overall CIG early/late ratio R = 0.14/0.86 compares to earlier values 0.17/0.83 (Nilson nilson73 (1973)) and 0.20/0.80 (Gisler gisler80 (1980)). A twenty percent overlap with SDSS provides good confirmation of our POSS II based conclusions. That the CIG is one of the most spiral-rich samples is expected if the morphology-density relation (Postman & Geller postman84 (1984)) extends to the most isolated regions of the large scale structure. However, interpreted as an extremely isolated sample, the detection of a significant population of early-type galaxies in CIG raises special questions. The most extreme view is to argue that nurture is much more important than nature in determining galaxy morphology. The most extreme manifestation of this view would see a complete absence of early-type galaxies in extremely isolated environments interpreting all ellipticals as merger products and all lenticulars as a products of spiral harassment (Moore et al. moore96 (1996)). Claims have been made that the most isolated samples contain no elliptical galaxies and few lenticulars (e.g. Einasto & Einasto einasto87 (1987)) but they were based upon a small sample of galaxies from local CIG components 1 and 2 summarized in Sect. 1. POSS I-based classifications suggested an early-type CIG fraction as high as 0.25 while other studies (Saucedo-Morales & Bieging saucedo01 (2001); Stocke et al. stocke04 (2004); and this paper) find 10–15% almost evenly divided between E and S0 types. Thess typical AMIGA environments are where merging and harassment should have the lowest probability of occurrence. The modest luminosities of our E population supports the inference that these galaxies are not products of major mergers. OLF calculations have been discordant with claims for (Stocke et al. stocke04 (2004)) and against (Sulentic & Rabaca sulentic94 (1994)) the existence of a luminous “fossil” elliptical population in the CIG. Stocke et al. (stocke04 (2004)) results were discussed in the previous section, and missclassified objects as well as an offset in of their comparison sample was argued to explain the disagreement with our results. But the most important point, irrespective of the CfA comparison, is that late-type galaxies in the CIG are brighter than the elliptical galaxies in the CIG. Elliptical galaxies viewed as fossil ellipticals should be brighter than the population from which the mergers will be produced. The OLF study of Sulentic & Rabaca (sulentic94 (1994)) ruled out a population of fossil ellipticals from compact group mergers and our new results appear to almost rule out major mergers of CPG pairs or pairs of CIG spirals.
If not major mergers then what are the isolated ellipticals? If not stripped spirals then what are isolated lenticulars? A few CIG ellipticals have been studied in more detail (Marcum et al. marcum04 (2004)) with some showing normal red colors and a few unusually blue colors. CIG 164 and 870 are examples of this latter class and deserve higher resolution study. Both of these galaxies show unusually strong FIR emission for quiescent ellipticals. It is not clear that they are ellipticals at all but it is also possible that they represent recent mergers. Early H i studies of CIG lenticulars (Haynes & Giovanelli haynes80 (1980)) suggested that some of them showed excess H i content and spiral-like H i profiles. Image analysis of CIG 83, variously classified as an E or S0 (including POSS II) shows a weak but well defined spiral pattern after subtraction of a bright bulge component (Saucedo-Morales & Bieging saucedo01 (2001)). Recent work also shows that the CIG S0s follow the radio-FIR correlation for spirals (Domingue et al. domingue05 (2005)). Since this is generally interpreted as a correlation driven by star formation one can ask if these lenticulars, rather than being a product of harassment, are not some kind of natural extension of the spiral sequence. Strong line emission, or early-type absorption, spectra are also not uncommon among CIG early-types (Stocke et al. stocke04 (2004)) further evidence that they may not be typical of their morphological classes. Assumming that a significant fraction of our E and S0 populations are bona fide early types they may represent a primordial population.
In environmentally mixed (e.g. clusters through voids) samples the shapes of the early and late-type OLFs are very similar. Past work discussed above, and references within, indicate that the luminosities of early-type galaxies are more environmentally sensitive, with the parameter decreasing with decreasing environmental density. This can be interpreted as the major signature of nurture among the early-types. Spirals appear to be insensitive, or much less sensitive to environment with luminous spirals found everywhere (albeit less often in clusters). AMIGA is very helpful for interpreting results of other surveys that sample galaxies in a wider range of environments, since it is an extreme where effects of environmental nurture are minimized. An additional term in the environmental equation involves one-on-one interactions. They can produce multiwavelength enhancement signatures that cannot be distinguished from signatures driven by average environmental density. One-on-one interactions appear to be strongest in spirals while environmental density effects are strongest in early-types. Approximately 10% of field galaxies are found in close pairs (and perhaps 2–3% in triplets and compact groups) that are often quite isolated. Strongly interacting pairs are even found in voids (Grogin & Geller grogin00 (2000)). This is potentially a large enough population that, unless adequately taken into account, can confuse or diminish OLF signatures connected to the average galaxy surface density. The AMIGA sample is the first large sample of isolated galaxies where both aspects of nurture are being carefully monitored.
7 Conclusions
The AMIGA sample is the largest local sample of extremely isolated and luminous () galaxies. Our morphological revision shows that it is dominated by: 1) a modest ( 139) early-type (E–S0) population and 2) a dominant ( 637) late-type (Sb–Sc) population. The sample is extreme because the spiral population is more luminous that the elliptical one, an effect seen only in isolated or void-like environments. AMIGA is trying to avoid two forms of “nurture”: one-on-one interactions and galaxy environmental density. We have removed a sample of 32 obviously interacting pairs. The next step involves evaluating the degrees of environmental density in our sample. One-on-one interactions like the 32 AMIGA rejects produce a maximum nurture signature among late-type galaxies. Environmental density produces the maximum signature in the early-type galaxies. The former signature produces a multiwavelength enhancement while the latter a multiwavelength dimming which we see in the low luminosity of the AMIGA early-type population.
The low luminosities of the AMIGA early-type population relative to: 1) the AMIGA spiral population and 2) early-type populations found in most surveys, is one of the most interesting results of this study. Environment appears to be the reason that we contradict claims that the early and late-type OLFs are very similar. The contradiction is due to the presence or absence of bright ellipticals in a sample and this depends on environmental density. AMIGA appears to have found the most nurture-free population of luminous early-type galaxies.
Acknowledgements.
LV–M, GB, UL, DE, SL, SV and EG are partially supported by DGI (Spain) AYA 2002-03338 and Junta de Andalucía TIC-114 (Spain), with additional support by the Secretaría de Estado de Universidades e Investigación (GB). JWS is partially supported by MEC the spanish sabatical grant SAB2004-01-04. Funding for the creation and distribution of the SDSS Archive has been provided by the Alfred P. Sloan Foundation, the Participating Institutions, the National Aeronautics and Space Administration, the National Science Foundation, the U.S. Department of Energy, the Japanese Monbukagakusho, and the Max Planck Society. The SDSS Web site is www.sdss.org. The SDSS is managed by the Astrophysical Research Consortium (ARC) for the Participating Institutions. The Participating Institutions are the University of Chicago, Fermilab, the Institute for Advanced Study, the Japan Participation Group, the Johns Hopkins University, Los Alamos National Laboratory, the Max-Planck-Institute for Astronomy (MPIA), the Max-Planck-Institute for Astrophysics (MPA), New Mexico State University, Princeton University, the United States Naval Observatory, and the University of Washington.References
- (1) Aars, C. E., Marcum, P. M., & Fanelli, M. N. 2001, AJ, 122, 2923
- (2) Adams, M. T., Jensen, E. B., & Stocke, J. T. 1980, AJ, 85, 1010
- (3) Aguerri, J. 1999, A&A, 351, 43
- (4) Arakelyan, M. A. 1984, Ap, 19, 375
- (5) Baggett, W. E., Baggett, S. M., & Anderson, K. S. J. 1998, AJ, 116, 1926
- (6) Blanton, M. R., Hogg, D. W., Bahcall, N. A., et al. 1993, ApJ, 594, 186
- (7) Bothun, G., & Cornell, M. 1990, AJ, 99, 1004
- (8) Burda, P., & Feitzinger, J. V. 1992, A&A, 261, 697
- (9) Colbert, J. W., Mulchaey, J. S., & Zabludoff, A. I. 2001, AJ, 121, 808
- (10) Croton, D. J., Farrar, G. R., Norberg, P., et al. 2005, MNRAS, 356, 1155
- (11) Domingue, D. L., Sulentic, J. W., & Durbala, A. 2005, AJ, 129, 2579
- (12) Drozdovsky, I. O., & Karachentsev, I. D. 2000, A&AS, 142, 425
- (13) Einasto, M., & Einasto, J. 1987, MNRAS, 226, 543
- (14) Espada, D., Bosma, A., Verdes-Montenegro, L., et al. 2005, A&A, in press [astro-ph/0506769]
- (15) Garcia, A. M. 1993, A&AS, 100, 47
- (16) Garcia, A. M., Paturel, G., Bottinelli, L., & Gouguenheim, L. 1993, A&AS, 98, 7
- (17) Gisler, G. 1980, AJ, 85, 623
- (18) Grogin, N. A., & Geller, M. J. 2000, AJ, 119, 32
- (19) Haynes, M. P., & Giovanelli, R. 1980, ApJ, 240, L87
- (20) Haynes, M. P., & Giovanelli, R. 1983, ApJ, 275, 472
- (21) Haynes, M. P., & Giovanelli, R. 1984, AJ, 89, 758
- (22) Hogg, D. W., Blanton, M. R., Eisenstein, D. J., et al. 2003, ApJ, 585, L5
- (23) Hoyle, F., Rojas, R. R., Vogeley, M. S., & Brinkmann, J. 2005, ApJ, 620, 618
- (24) Huchra, J. P., & Thuan, T. X. 1977, ApJ, 216, 694
- (25) Karachentsev, I. D., & Karachentseva, V. E. 1975, SvA, 18, 428
- (26) Karachentsev, I. D., Musella, I., & Grimaldi, A. 1996, A&A, 310, 722
- (27) Karachentseva, V. E. 1973, Comm. Spec. Ap. Obs., USSR, 8, 1
- (28) Kornreich, D. A., Haynes, M. P., Jore, K. P., & Lovelace, R. V. E. 2001, AJ, 121, 1358
- (29) Madore, B. F., Freedman, W. L., & Bothun, G. D. 2004, ApJ, 607, 810
- (30) Makarova, L. N., & Karachentsev, I. D. 1998, A&AS, 133, 181
- (31) Marcum, P. M., Aars, C. E., & Fanelli, M. N. 2004, AJ, 127, 3213
- (32) Marinoni, C., Monaco, P., Giuricin, G., & Costantini, B. 1999, ApJ, 521, 50
- (33) Marquez, I., & Moles, M. 1996, A&AS, 120, 1
- (34) Marquez, I., & Moles, M. 1999, A&A, 344, 421
- (35) Marzke, R. O., Huchra, J. P., & Geller, M. J. 1994a, ApJ, 428, 43
- (36) Marzke, R. O., Geller, M. J., Huchra, J. P., & Corwin, H. G., Jr. 1994b, AJ, 108, 437
- (37) Marzke, R. O., da Costa, L. N., Pellegrini, P. S., Willmer, C. N. A., & Geller, M. J. 1998, ApJ, 503, 617
- (38) Moore, B., Katz, N., Lake, G., Dressler, A., & Oemler, A., Jr. 1996, Nature, 379, 613
- (39) Morgan, I., Smith, R. M., & Phillipps, S. 1998, MNRAS, 295, 99
- (40) Nilson, P. 1973, Uppsala General Catalogue of Galaxies (UGC, Uppsala: Astronomiska Observatorium)
- (41) Pisano, D. J., & Wilcots, E. M. 1999, AJ, 117, 2168
- (42) Pisano, D. J., Wilcots, E. M., & Liu, C. T. 2002, ApJS, 142, 161
- (43) Postman, M., & Geller, M. 1984, ApJ, 281, 95
- (44) Reda, F. M., Forbes, D. A., Beasley, M. A., O’Sullivan, E. J., & Goudfrooij, P. 2004, MNRAS, 354, 851
- (45) Rojas, R. R., Vogeley, M. S., Hoyle, F., & Brinkmann, J. 2004, ApJ, 617, 50
- (46) Sandage, A., & Bedke, J. 1994, The Carnegie Atlas of Galaxies (CAG, Washington, DC: The Carnegie Institution)
- (47) Saucedo-Morales, J., & Bieging, J. 2001, Ap&SS Suppl., 277, 449
- (48) Smith, R. M., Martínez, V. J., & Graham, M. J. 2004, ApJ, 617, 1017
- (49) Stocke, J. T., Keeney, B. A., Lewis, A. D., Epps, H. W., & Schild, R. 2004, AJ, 127, 1336
- (50) Sulentic, J. W. 1989, AJ, 98, 2066
- (51) Sulentic, J. W., & Rabaca, C. R. 1994, ApJ, 429, 531
- (52) Turner, E. L., & Gott, J. R. 1975, ApJ, 197, L89
- (53) Uson, J. M., & Matthews, L. D. 2003, AJ, 125, 2455
- (54) van Zee, L. 2001, AJ, 121, 2003
- (55) Verdes-Montenegro, L., Bosma, A., & Athanassoula, E. 1995, A&A, 300, 65
- (56) Verdes-Montenegro, L., Bosma, A., & Athanassoula, E. 1997, A&A, 321, 754
- (57) Verdes-Montenegro, L., Sulentic, J., Lisenfeld, U., et al. 2005, A&A, 436, 443 (Paper I)
- (58) Xanthopoulos, E., & de Robertis, M. 1991, AJ, 102, 1980
- (59) Xu, C., & Sulentic, J. W. 1991, ApJ, 374, 407
- 1961– (1968) Zwicky, F., Herzog, E., Karpowicz, M., Kowal, C., & Wild, P. 1961–1968, Catalogue of Galaxies and of Cluster of Galaxies (CGCG, Pasadena: California Institute of Technology)