Galactic Corona or Local Group Intergalactic Medium?
Abstract
Cosmological hydrodynamic simulations predict that the low redshift universe comprises a web of warm–hot intergalactic gas and galaxies, with groups of galaxies and clusters forming at dense knots in these filaments. Our own Galaxy being no exception is also expected to be surrounded by the warm–hot intergalactic medium, filling the Local Group. Some theoretical models also predict the existence of a hot Galactic corona. With X-ray and FUV observations of extragalactic sources, we can probe the warm–hot gas through absorption lines of highly ionized elements. Indeed, Chandra, XMM and FUSE observations have detected absorption lines toward many sightlines. The debate that has emerged is over the interpretation of these observations: are the absorption systems from the halo of our Galaxy or from the extended Local Group environment? This has important implications for our understanding of the mass of the Local Group, the physical conditions in the intergalactic medium, the structure of the Galaxy and galaxy formation in general. We will present the current status of the debate and discuss our ongoing observing program aimed at understanding the absorption systems, with an emphasis on the high quality Chandra spectra of the Mrk 421 and Mrk 279 sightlines.
keywords:
Intergalactic Medium; Local Group; Galactic Halo1 Introduction
The intergalactic medium (IGM) is expected to contain most of the baryonic matter in the universe, a tenuous filamentary “web” of gas bridging the gaps between collapsed objects such as galaxies and clusters. At high redshifts () this web appears in quasar spectra as a multitude of Lyman alpha forest absorption lines. In the nearby universe, on the other hand, hydrodynamic simulations show that most of the IGM has been shock–heated to a warm–hot (WHIM) phase with temperatures of K (Cen & Ostriker, 1999; Davé et al., 2001). At these temperatures scant neutral hydrogen remains, and the IGM is thus best detected through absorption lines from highly ionized metals (Hellsten et al., 1998), particularly O vi, O vii, and O viii. Recent Chandra observations have indeed confirmed that this low–redshift WHIM exists and comprises a baryon content consistent with expectations (Nicastro et al., in preparation Nicastro et al., 2005a, b).
Just as other galaxies are expected to form in the densest “knots” of the cosmic web, we also expect to see WHIM adjacent to, perhaps surrounding, our own Milky Way. Indeed, X-ray spectra of several quasars show likely O vii absorption. The upper limit on the O vii emission toward Mrk 421 found by Rasmussen et al. (2003) indicates that this absorption system probably has an extremely low density and is thus likely to be extragalactic. Additionally, other nearby low– and high–ionization components may be associated with either the WHIM itself or may represent gas from the WHIM that has cooled and is now in the process of accreting onto the Galaxy; for example, the high–velocity O vi absorption seen with FUSE along many quasar lines of sight (Wakker et al., 2003) and neutral hydrogen high–velocity clouds (H i HVCs).
2 The Debate: WHIM or Corona?
The origin of the local O vii absorption, and in particular its relation to the observed O vi, is still to a large degree unknown. There is some evidence that these ions could originate in a warm–hot Galactic corona: for example, likely O vii absorption has been detected within 50 kpc of the Galaxy by Wang et al. (2005). The observed deflection and stripping of the Magellanic clouds also lends credence to the existence of a low–density corona. Lower–ionization absorption, such as that from Si iv and C iv, is also seen at the same velocities as some O vi HVCs, indicating that these O vi clouds, at least, may have lower temperatures and higher densities than expected from the WHIM.
However, there are also reasons to believe this absorption is tracing extended WHIM gas. High column densities of O vi, O vii, and O viii from the local IGM are predicted by simulations to lie in certain directions (Kravtsov et al., 2002). Furthermore, the mean velocity vector of the O vi HVCs is highest in the local standard of rest and lowest in the Local Group rest frame, indicating that their origin could indeed be extragalactic (Nicastro et al., 2003). The presence of O vii between the Galaxy and Large Magellanic Cloud does not rule out an extragalactic origin for the absorption in some directions since neither the Galactic absorption or WHIM is necessarily homogeneous; additionally, the WHIM is known to be homogeneous and consist of a variety of temperature and density phases, so some lower–ionization lines may be expected as well.
Thus, the questions – how are the local X-ray and UV absorption components related to each other, which are of Galactic origin, and which arise in the local WHIM?– are still unanswered. The answers to these questions have profound implications for both studies of galaxy formation and cosmology. We are now undertaking a program to determine the distribution and properties of this local hot gas and its ties to lower–ionization components, with a focus on new and archival Chandra and FUSE data. Here we present the first results of this study, an analysis of the particularly high–quality Chandra and FUSE spectra of the bright AGN Mrk 421 and Mrk 279.
3 The Mrk 421 Sightline
A full discussion of the Mrk 421 Chandra and FUSE spectra, and the analysis thereof, can be found in Williams et al. (2005); the following is a summary of the main results.
3.1 Observations and measurements
The bright blazar Mkn 421 was observed during two exceptionally high outburst phases for 100 ks each as part of our Chandra–AO4 observing program: one at erg s-1 cm-2 with the Low Energy Transmission Grating (LETG) combined with the ACIS-S array, and another at erg s-1 cm-2 with the HRC-S array and LETG. Each of these observations contains counts per resolution element at 21.6 Å. Additionally, another short observation of Mkn 421 was taken with HRC/LETG (29 May 2004), providing another 170 counts per resolution element. These three spectra were combined over the 10–60 Å range to improve the signal–to–noise ratio (S/N at 21 Å with 0.0125 Å binning). The final coadded spectrum of Mkn 421 is one of the best ever taken with Chandra: it contains over total counts with counts per resolution element at 21.6 Å, providing a detection threshold of mÅ ( for an unsaturated line).
Using the CIAO fitting package Sherpa we initially modeled the continuum of Mkn 421 as a simple power law with Galactic foreground absorption, excluding the 48–57 Å HRC chip gap region. Metal abundances for the Galactic gas were then artificially adjusted to provide a better fit around the O 1 and C 1 K–edges near 23 Å and 43 Å respectively. This is not intended to represent actual changes to the absorber composition, but rather to correct uncertainties in the instrument calibration. After this fit there were still some systematic uncertainties in the best–fit continuum model; these were corrected with broad ( Å) Gaussian emission and absorption components until the modeled continuum appeared to match the data upon inspection. Indeed, the residuals of the spectrum to the final continuum model have a nearly Gaussian distribution, with a negative tail indicating the presence of narrow absorption lines (see Nicastro et al., 2005a, Figure 8). We searched for narrow, unresolved (FWHM Å) absorption lines at known C, N, O, and Ne transition wavelengths and used Gaussians to measure the equivalent widths (or upper limits thereupon) for all lines found. All in all, equivalent widths for 9 significantly detected absorption lines were measured (including O vii K, , and ) and 4 upper limits calculated.
Mrk 421 was also observed for a total of 84.6 ks with FUSE, providing a signal–to–noise ratio of 17 near the O vi wavelength once all spectra are combined and binned to km s-1. This spectrum shows strong, broad O vi absorption at , most likely originating in the Galactic thick disk, as well as a possible O vi HVC at km s-1 (Figure 1).

3.2 Doppler parameters
To convert the measured equivalent widths to ionic column densities, we calculated curves of growth for each absorption line over a grid of Doppler parameters ( km s-1) and column densities (), assuming a Voigt line profile. Since the X-ray lines are unresolved, cannot be measured directly. It can, however, be inferred from the relative strengths of the three measured O vii K–series lines. These line ratios by themselves are insufficient to determine the physical state of the O vii–absorbing medium since and are degenerate: the K line saturation could be due to high column density, low , or a combination of both. However, given an absorption line with a measured equivalent width and known oscillator strength, the inferred column density as a function of the Doppler parameter can be calculated. The measured equivalent width (and errors) for each transition thus defines a region in the plane. Since the actual value of is fixed, and can be determined by the region over which the contours “overlap;” i.e. the range of Doppler parameters for which the different transitions provide consistent measurements.
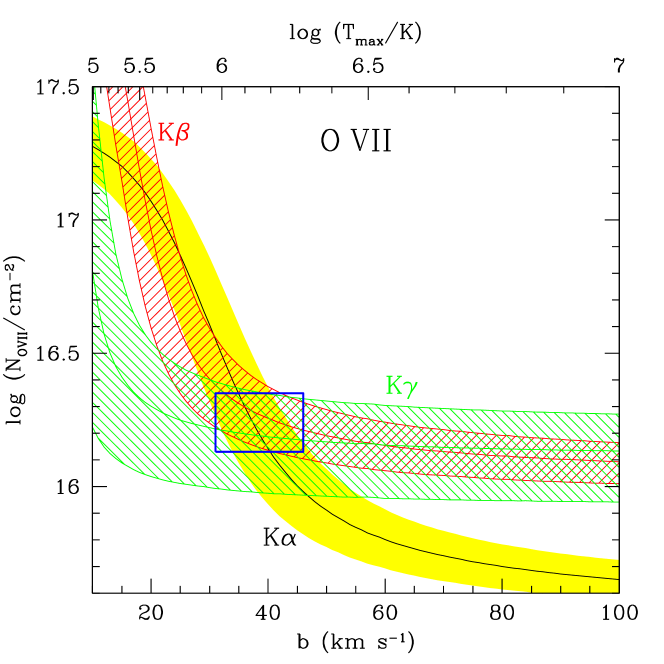
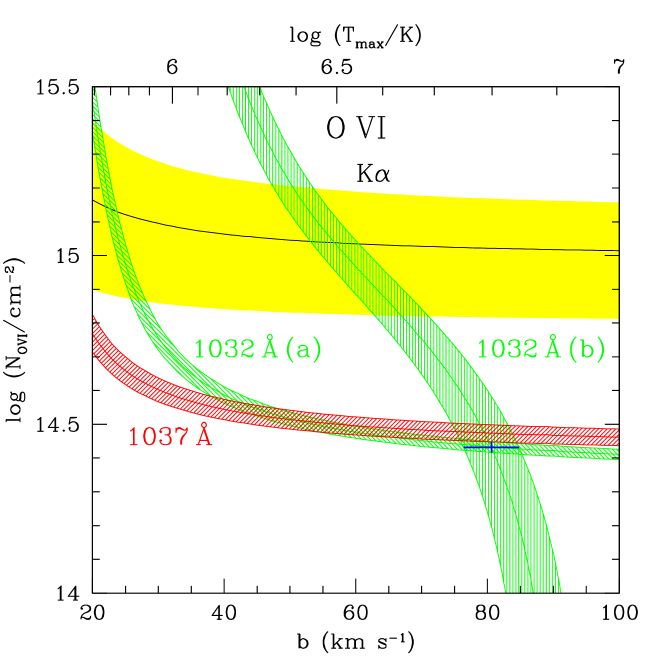
Figure 2 (top panel) shows such contours for the three measured O vii transitions. The K and K tracks appear consistent at the level for km s-1, while the overlap between the K and K tracks provides approximate 2 limits of km s-1. We thus assume a range of km s-1. It should be noted that Figure 2 also shows some overlap between the and at km s-1; however, this solution is unlikely given the lower limit provided by the line. Moreover, km s-1 implies a maximum temperature (assuming purely thermal motion) of K; such a low temperature is unlikely to produce the observed strong high–ionization lines.
A similar analysis is not as effective when applied to the strong O viLV UV doublet (from the thick disk), since these lines are only slightly saturated. The O viLV 1032 Å line is fully resolved by FUSE and relatively unblended, so its Doppler parameter can be estimated much more accurately using the measured line width and strength. In an unsaturated absorption line, ; however, the measured FWHM increases if the line is saturated. We compensated for this by calculating Voigt profile FWHMs on a grid of and , and determining the region consistent with the O viLV 1032 Å FWHM measurement of km s-1.
When the FWHM–derived contour is overlaid on the contour inferred from the equivalent width measurement of the LV–O vi 1032 Å line, the two regions overlap nearly orthogonally (Figure 2, bottom panel) leading to a constraint of (O viLV) km s-1. This is more than higher than the Doppler parameter calculated for the O vii absorption, indicating that the O vii and thick–disk O viLV cannot arise in the same gaseous phase. Also, at no value of the Doppler parameter do the 1032 Å, 1037 Å, and O vi K lines all produce a consistent measurement; in fact, the O viK column density is a factor of higher than that inferred from the UV data. It is thus possible that the O vi UV transition is being suppressed, perhaps by atomic physics effects, in the absorbing medium and the line produces a more accurate representation of the true O vi column density; in the following analysis we consider both possibilities.
3.3 Temperature and Density Constraints
The abundance ratios of metal ions (for example, O vii/O viii) are expected to vary with temperature as a result of collisional ionization; additionally, as the density decreases to typical WHIM values ( cm-3), photoionization from the extragalactic ionizing background plays an increasingly important role. We used Cloudy version 90.04 (Ferland, 1996) to calculate relative ionic abundances for all measured elements over a grid of and . As with the Doppler parameter and column density diagnostics described above, any measured ion column density ratio then produces a “track” of consistency in the plane, and (assuming the ions arise in the same gaseous phase) the overlap between such “tracks” can place constraints on the gas temperature and density.
Column density ratios between different ions of the same element (e.g. O vi, O vii, and O viii) produce the strongest constraints since these ratios are independent of the relative metal abundance in the gas Figure 3 shows such constraints derived from these oxygen abundance ratios. If the O vi K line accurately traces the O vi column density of this medium, then the contours overlap at cm-3. Coupled with the total oxygen column density and assuming O/H of 0.3 times Solar, this implies that the absorber has a radial extent of Mpc and a mass consistent with the expected baryonic mass of the Local Group.
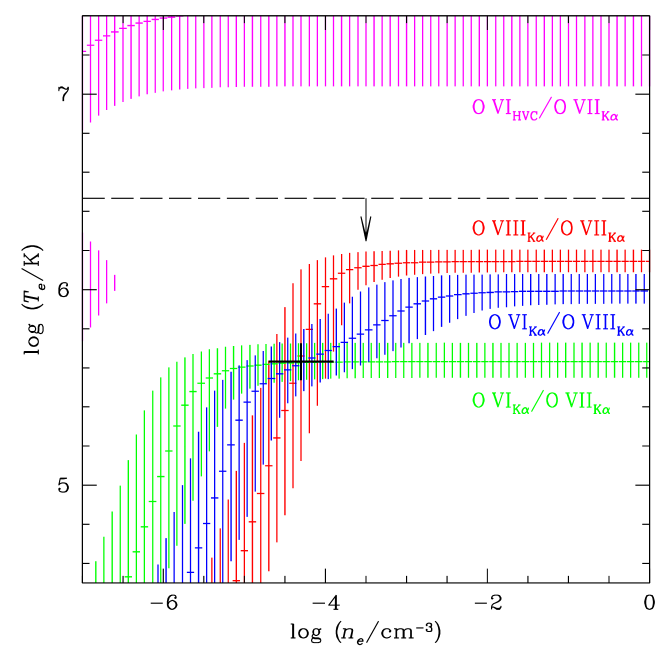
On the other hand, if the O vi K line does not correctly measure , then this absorption can in principle arise in a higher–density Galactic medium with (as derived from the O viii/O vii ratio with collisional ionization as the dominant process; Figure 3). Even in this case, a low–density (extragalactic) medium is fully consistent with the data. Furthermore, the contour derived from the measured Ne/O abundance (not shown in the figure) is consistent in the low–density regime if the Ne/O ratio is significantly supersolar, as has been observed in other Galactic and extragalactic absorption systems.
4 The Mrk 279 Sightline
A full discussion of our analysis of the Mrk 279 Chandra and FUSE spectra will appear in a forthcoming paper (Williams et al., 2006).
4.1 Observations and Measurements
While Mrk 421 was observed for relatively short periods during bright outburst phases, few other bright sources flare this dramatically. We thus searched the Chandra archive for long–duration LETG observations of relatively bright background quasars. One such source, Mrk 279 (an AGN at ) was observed during seven periods in May 2003 for a total exposure time of 340 ks. These seven observations were coadded for a final (unbinned) signal–to–noise ratio of near 22Å. As with the Mrk 421 spectrum, we again used Sherpa to fit a power law and foreground Galactic absorption to the spectrum over Å band (excluding the Å and Å chip gap regions), leaving the relative Galactic metal abundances as free parameters in order to produce a better fit around the absorption edges. The remaining broad residuals were were corrected by including four broad Gaussians in the source model.

Although several strong lines such as C vi, O vii, and N vii are apparent at the blazar redshift (), only O vii K is unambiguously detected at Å ( km s-1) with an equivalent width of mÅ. Upper limits are measured for the O vii K and O viii lines. The Chandra LETG wavelength scale contains intrinsic random errors of approximately Å, on the order of the statistical error on the O vii position measurement, but these errors should not vary with time (J. J. Drake, private communication). To check the absolute wavelength scale near the O vii line, we retrieved the nearest HRC–S/LETG calibration observation of the X-ray bright star Capella (observation 3675, taken on 2003 September 28) from the Chandra archive and reprocessed the data in exactly the same manner as the Mrk 279 data. The wavelength of the strong O vii emission line was found to be Å or km s-1, which is consistent with the km s-1 radial velocity of Capella as listed in the SIMBAD database. Thus, any systematic effects on the measured velocity of the O vii absorption are likely to be insignificant compared to the statistical error.
Mrk 279 was also observed with FUSE for a total exposure time of 224 ks (though only 177 ks of these data were usable); all calibrated data from these observations were retrieved and coadded in the same manner as the Mrk 421 FUSE data. This spectrum also shows strong Galactic thick–disk O vi absorption at , but unlike the Mrk 421 spectrum, the high–velocity O vi is strong and clearly separated from the thick–disk O vi at km s-1. Figure 4 shows the O vii and O vi absorption systems plotted against velocity. Although the error on the O vii velocity is large, it is nonetheless significantly higher than the O vi HVC velocity by about . Thus, a direct association between the O vi HVC and O vii can be ruled out with reasonably high confidence.
4.2 Doppler parameters

In the Mrk 421 Chandra spectrum, three absorption lines from the O vii K-series were strongly detected. While a similar curve–of–growth analysis can be performed for Mrk 279, placing limits on and is more difficult because only the O vii K line is strongly detected; only an upper limit can be measured for the K line. Since the absorption line properties for various column densities and Doppler parameters are known, limits on these quantities can be determined using the Chandra spectrum itself. For each point in the plane, O vii K and K absorption lines with the calculated and FWHM values were added to the best–fit continuum model, and the statistic calculated using the “goodness” command in Sherpa. Since best–fit K line amplitude is zero, the unsaturated case (assuming the O vii line ratio constraint ) produces the best fit to the data. The minimum value was taken from such a fit, and calculated for every point. The 95% confidence interval () calculated with this method is shown in Figure 5 (as well as the contours derived from each transition); at this confidence level all Doppler parameters between km s-1 are ruled out.
Doppler parameters for the O vi absorption were calculated in the same manner as for Mrk 421. In this case, however, two Gaussians are necessary to fit the low–velocity (thick–disk) O vi. The derived velocity dispersions are , , and for the broad Galactic, narrow Galactic, and high–velocity O vi components respectively (producing the best–fit model shown in Figure 4). These are all strongly inconsistent with the limits found for the O vii velocity dispersion, indicating that the O vii is not related to any of the O vi components. Even if the low–velocity O vi is considered to be one non–Gaussian component and its width is measured directly from the spectrum, its Doppler parameter is km s-1, barely consistent with the 95% lower limit on the O vii value.


4.3 Temperature and Density Constraints
An upper limit on the temperature of the absorbing medium of can be derived from the O viii/O vii column density. Since the O vii absorption does not appear to be associated with any of the O vi components, finding a lower limit on the temperature is more difficult. We thus assume that the O vi absorption from the O vii–bearing gas is undetected in the FUSE spectrum, and exists as a very broad ( km s-1) absorption line superposed on the narrower detected components. Limits on the O vi column density associated with the O vii were thus calculated by placing such an absorption line in the FUSE spectrum model, one with km s-1 and one with km s-1, and calculating the corresponding O vi/O vii constraint (shown in Figure 6.
The lower limit on temperature derived from the O vi/O vii upper limit is highly dependent on ; in fact, for km s-1 the two oxygen line ratios are inconsistent with each other for all temperatures and densities. Thus, if the O vii is associated with an undetected broad O vi line, the velocity dispersion of the absorption must be very high (at least km s-1). Such a high velocity dispersion, if purely thermal, implies temperatures of K, which is ruled out by the non–detection of O viii absorption. This absorber must therefore be broadened primarily by nonthermal processes, perhaps due to the velocity shear of infalling hot gas associated with HVC Complex C.
5 Conclusions
We have detected strong X-ray absorption toward both Mrk 421 and Mrk 279. Both absorption systems appear to exhibit similar column densities and consistent temperature and density limits (albeit with large errors). Additionally, in both cases the detected X-ray absorption does not appear to arise in the same phase as the low– or high–velocity O vi absorption seen in the FUSE spectra, indicating that the O vii absorption likely comes from either the local WHIM or a heretofore–undiscovered hot Galactic component. Additionally, the Doppler parameters of the Mrk 421 and Mrk 279 absorption are highly inconsistent with each other, perhaps indicating that these two systems originate from entirely different physical processes.
Acknowledgments
We thank the conference organizers for an enjoyable and informative week, and the Chandra and FUSE teams for their exceptional efforts on these missions. This work has been supported by Chandra award AR5-6017X issued by the Chandra X-ray Observatory Center, which is operated by the Smithsonian Astrophysical Observatory for and on behalf of the NASA under contract NAS8-39073. RJW derives additional support from an Ohio State University Presidential Fellowship.
References
- Cen & Ostriker (1999) Cen, R., & Ostriker, J. P. 1999, ApJ, 514, 1
- Davé et al. (2001) Davé, R., et al. 2001, ApJ, 552, 473
- Ferland (1996) Ferland, G. J., 1996, Hazy, a Brief Introduction to Cloudy 90, University of Kentucky, Physics Department Internal Report
- Hellsten et al. (1998) Hellsten, U., Gnedin, N. Y., & Miralda–Escudé, J. 1998, ApJ, 509, 56
- Kravtsov et al. (2002) Kravtsov, A. V., Klypin, A., & Hoffman, Y. 2002, ApJ, 571, 563
- Nicastro et al. (2003) Nicastro, F., et al. 2003, Nature, 421, 719
- Nicastro et al. (2005a) Nicastro, F., et al. 2005, ApJ, 629, 700
- Nicastro et al. (2005b) Nicastro, F., et al. 2005, Nature, 433, 495
- Rasmussen et al. (2003) Rasmussen, A., Kahn, S. M., & Paerels, F. 2003, ASSL Conference Proceedings, 208, 109
- Wakker et al. (2003) Wakker, B. P., et al. 2003, ApJS, 146, 1
- Wang et al. (2005) Wang, Q. D., et al. 2005, ApJ, accepted (astro-ph/0508661)
- Williams et al. (2005) Williams, R., et al. 2005, ApJ, 631, 856
- Williams et al. (2006) Williams, R., et al. 2006, ApJ, submitted