High Energy Neutrinos from Cosmic Ray Interactions in Clusters of Galaxies
Abstract
The spatial clustering of galaxies in galaxy clusters implies that the background of infrared (IR) light in the intracluster medium (ICM) may exceed the universal background. Cosmic rays injected within the ICM propagate diffusively and at low enough energies are trapped there for cosmological times. The photopion production interactions of cosmic rays with the IR photons are responsible for the generation of neutrinos whose detection may shed some light on the origin and propagation of high energy cosmic rays in the universe. Here we discuss our calculations of the flux of neutrinos from single clusters as well as the contribution of photopion production in clusters of galaxies to the diffuse neutrino background.
I Introduction
Clusters of galaxies are peculiar storage rooms of cosmic rays bbp97 ; volk96 : most non-thermal protons and nuclei injected in the ICM remain confined there for cosmological times, and can either interact with the gas and photon backgrounds or be re-energized by episodic phenomena, such as mergers with other clusters sarazin ; blasi01 . The spatial clustering of 10-1000 galaxies within the cluster volume also enhances the amount of infrared and optical light in that region, thereby increasing the probability of interactions of charged particles with these photons. The enhanced cosmic ray and photon densities make clusters of galaxies the ideal laboratory for the generation of high energy radiations and neutrinos. The detection of a neutrino flux from clusters of galaxies would be a precious tool to weigh the unknown non-thermal content of these large scale structures. As discussed in Sec. II, the amount of cosmic rays trapped in the intracluster medium is still very uncertain, and only weakly constrained by present observations of hard X-rays and gamma rays, most likely generated by high energy electrons brunettirev ; blasirev . The detection of neutrinos on the other hand would allow us to have an independent handle to infer the energetic non-thermal content which is in the form of hadronic cosmic rays. Gamma rays in the 1-1000 GeV range are also expected to carry precious information about the amount of cosmic rays trapped in the ICM cb98 ; ensslin .
In this paper we investigate the most promising mechanism for the generation of high energy neutrinos, namely the production and decay of charged pions in proton-photon inelastic interactions. The relevant photon background in the ICM is provided by the IR and optical light emitted by galaxies within the cluster. The maximum flux of neutrinos from inelastic interactions allowed by the observations of the diffuse gamma ray background was calculated in bbp97 ; cb98 . The calculation of the neutrino flux is carried out both analytically and through a Monte Carlo simulation of the diffusive motion of high energy particles in the turbulent magnetic field of a cluster of galaxies. Such propagation was also investigated in rodo with the purpose of determining the flux of gamma and hard X-rays generated as secondaries of the high energy protons.
The paper is organized as follows: in Sec. II we review the current knowledge of the cosmic ray propagation and energetics in the ICM. In Sec. III we illustrate our calculations of the IR light background and its spatial distribution in the volume of the cluster. In Sec. IV we outline a benchmark analytical calculation of the neutrino flux, in order to emphasize the dependence of the result upon poorly known quantities, such as the diffusion coefficient and the CR energy content of the cluster. A Monte Carlo calculation of these neutrino fluxes is described in Sec. V. In Sec. VI we calculate the maximum expected contribution of these processes of neutrino production in clusters of galaxies to the diffuse extragalactic neutrino flux. We conclude in Sec. VII.
II Cosmic Rays in the intracluster medium
The presence of a non-thermal component in clusters of galaxies is best shown by the observation of regions of extended radio emission, called radio halos, with size 1–2 Mpc, often wider than the X-ray emitting region (see feretti for a recent review). The spectrum of the radio emission is typically a power law with a high frequency cutoff in the 1–10 GHz range and it results from synchrotron energy losses of high energy electrons in the magnetic field of the ICM. Measurements of the rotation measure provide magnetic fields which are of the order of several kim ; clarke , although several of these inferred values depend on assumptions made on the structure of the magnetic field and on the density of background electrons. In a few clusters, the radio emission is accompanied by X-rays in excess of those of thermal origin (due to bremmstrahlung emission). These non-thermal X-rays are most likely the result of inverse Compton scattering (ICS) of the same electron population responsible for the radio emission. The main photon target is represented by the photons of the cosmic microwave background (CMB), while the infrared light, even in the case of the enhanced fluxes considered here, does not play a significant role. In the few cases in which both a radio halo emission and a hard X-ray emission are detected, an estimate of the magnetic field can be obtained fusco . Typical values are in the range 0.1–1. These fields should be considered as averages over the volume of the cluster. Higher fields are likely to be present in the central regions of clusters.
While non-thermal electrons are easily visible in clusters, a much harder task is to identify hadronic cosmic rays. The smoking gun showing their presence, namely a gamma ray emission associated with the decay of neutral pions, is still lacking. This absence of detection is however still compatible with most models of injection of cosmic ray protons in the ICM: the expected gamma ray emission becomes comparable with the EGRET sensitivity only if the protons in clusters have a total energy comparable with the thermal energy in the virialized gas. Lower fluxes should however be detectable with the upcoming GLAST satellite (gabici2 ; gabici3 , see also blasirev for a recent review). One of the main reasons for the interest in the cosmic ray population in clusters is related to the fact that the presence of magnetic fields is able to confine cosmic rays for times in excess of the age of the cluster: these large scale structures work then as storage rooms for cosmic rays bbp97 ; volk96 . This implies that the energy density of cosmic rays in clusters increases with cosmic time. The potential sources of cosmic rays in clusters have been considered in bbp97 and the corresponding energy densities were estimated. The efficiency of the confinement was also investigated: the maximum energy for which the confinement is effective, namely the confinement time exceeds the age of the cluster (roughly the age of the universe), is strongly dependent upon the energy dependence of the diffusion coefficient. For Bohm diffusion and fields, the confinement remains effective up to extremely high energies, while a Kolmogorov spectrum of magnetic fluctuations leads to confinement only up to energies of the order of several TeV.
Normal galaxies in clusters are expected to contribute a total energy in the form of confined cosmic rays , where is the typical number of galaxies in a cluster, is the cosmic ray luminosity of a galaxy like ours. We then obtain erg, more than three orders of magnitude less than the total energy in the thermal gas. A single active galaxy in a cluster should easily contribute a cosmic ray luminosity of . At any time it is reasonable to assume that at least one of the galaxies in the cluster is in an active phase, so that the total energy contributed by active galaxies is expected to be . A similar estimate is obtained if cosmic rays are accelerated through first order Fermi acceleration at the accretion shock in the outskirts of the cluster, if the acceleration efficiency is . These shocks form in the outskirts of clusters and are the result of the propagation of the information on the virialization of the core towards the outer regions bert . Accretion shocks propagate in the cold intergalactic gas and therefore their Mach number can be very high. In the context of the linear theory of particle acceleration at non-relativistic shocks, the expected spectrum of accelerated particles in the limit of very large Mach numbers is a power law with slope . The cosmic ray induced modification of the shock, particularly important for high Mach numbers, may generate higher efficiencies and non-power-law spectra blasirev ; stefano ; jones .
Shock waves are also expected to appear due to the supersonic infall of two or more clusters in a merger event. The typical strength of these shocks is much lower than for accretion shocks, and the expected spectra of accelerated particles is steep gabici1 ; dermer . The energy liberated in the gravitational form during these events is of order , which is in fact of the same order of magnitude of the thermal energy in the cluster, as should be expected since these mergers are believed to be responsible for the heating of the ICM to its virial value. Some fraction of this energy may be in the form of accelerated protons, but the efficiency for particle acceleration is expected to be rather small because of the low Mach numbers, which are also responsible for steep spectra gabici1 .
From the observational point of view, the most severe constraint to the energy density of cosmic rays, though model dependent, is represented by the radio emissivity at a few GHz frequency. Radio emission at this frequency is generated by electrons with energy , where is the magnetic field in . Observations of the Coma cluster show a cutoff in the volume integrated radio spectrum, at observa . If cosmic rays are present, a contribution to the radiating electrons comes from secondary electrons, generated from inelastic collisions. The spectrum of secondary electrons however has no cutoff at such low energies, therefore the radio emissivity at high frequencies imposes a rather severe constraint on the amount of secondary electrons, and therefore of primary cosmic rays in the region Reimer2004 . This bound implies that cosmic rays amount to less than of the thermal energy in the cluster, depending upon assumptions on the spectrum at injection and the morphology of the magnetic field in the cluster. These limits are slightly tighter if reacceleration of the secondary electron-positron pairs is taken into account brunetti .
III The infrared light in the intracluster medium
In this section we illustrate our determination of the InfraRed (IR) background in the intracluster medium. We start with adopting the Spectral Energy Distribution (SED) of individual galaxies following LDP03 . We then carry out the convolution of these SEDs with the spatial distribution of galaxies in a sample cluster of galaxies.
The SED of a normal galaxy as obtained by LDP03 ; LDPweb is illustrated in Fig. 1. The authors of Ref. LDP03 ; LDPweb state that the SED they find is valid only at wavelengths longer than 4m LDP03 , but after comparing it with other models and data we decided to use it at longer wavelengths as well, since the differences were found to be smaller than any other uncertainty of astrophysical origin. The same comment holds for the differences due to different types of galaxies in their model.
We used 1m as upper energy for the background radiation since at higher energies its spectrum is much steeper and even with a steep proton spectrum there is no appreciable contribution to the neutrino production.

In order to determine the IR background within the cluster of galaxies, we calculate the convolution of the given SED from our prototypical galaxy with the spatial distribution of galaxies. Following rodo we assume that the galaxy distribution follows closely the distribution of gas, for which we use:
| (1) |
with , and . Fig. 2 shows the energy density at the peak of the SED as a function of the distance from the center of the galaxy cluster, in the assumption that galaxies are in the cluster.

The function shown in Fig. 2 can be used to construct a useful model of the IR density as a function of the distance to the center of the cluster by integration over different distance ranges. This is shown in Fig. 3 where the sum of the IR emission from cluster sources is added to the extragalactic IR background and plotted in six circular annuli inside the cluster.

IV Neutrino production: an analytical calculation
In this section we present an analytical estimate of the neutrino flux generated as a result of the photopion interactions of high energy protons with the IR and CMB photons in the ICM. For simplicity we assume that there is only one dominant source of energetic protons in the center of the cluster and that the IR photon background is constant within the inner of the cluster. We also assume that the diffusion coefficient within this region is spatially constant.
Under these assumptions the neutrino production in the cluster can be calculated as:
| (2) |
where is the average spectrum of neutrinos produced by a single proton interaction on the photon background, is the number of protons at distance from the center and is the interaction probability per unit time.
The number density of protons at distance from the central source, , can be easily determined by solving the diffusion equation bbp97 , obtaining:
| (3) |
This solution is valid for particles that in the time manage to diffuse out to a distance from the center without suffering appreciable energy losses. This means particles whose energies satisfy . At distances larger than the density of particles with energy drops exponentially.
Here we assume that the diffusion coefficient has the form found in parizot :
| (4) |
where , is the Larmor radius of particles with energy and the reference energy is found by requiring that , being the coherence scale of the magnetic field. The three terms in Eq. 4 correspond to different regimes of propagation (Kolmogorov, Bohm and pitch angle scattering) depending upon the comparison of the Larmor radius of the particle and the coherence scale of the magnetic field.
The upper limit in the integral over the radial coordinate in Eq. IV is defined as , with and the age of the cluster, comparable with the age of the universe, . It is easy to show, following bbp97 , that, for cosmic ray energies for which confinement works, the spectrum of secondaries (gamma rays and neutrinos) is not affected by diffusion and is therefore not steepened by the energy dependence of . For unconfined cosmic rays, diffusion plays a role and the spectrum of secondaries suffers a steepening.
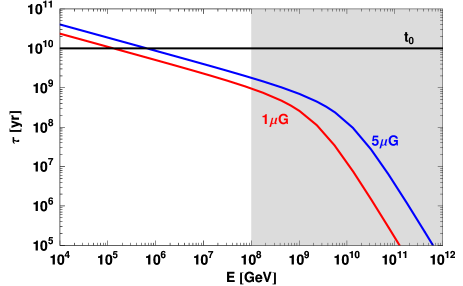
For a given diffusion coefficient, the minimum energy of the particles for which the escape time does not exceed can be estimated by requiring that . In Fig. 4 we plot the diffusion time, , out of a sphere with radius as a function of energy, using as a diffusion coefficient the one reported in Eq. 4. The two curves correspond to magnetic fields in the cluster (lower curve) and (higher curve). As it is clear from the plot, due to the large energy threshold for photopion reaction, all the particles of interest for our problem are not confined on time scales of the order of the age of the cluster. It is however worth keeping in mind that this estimate is rather simplified and that more realistic distributions of magnetic field may reflect into longer confinement times as we actually find in Sec. V.
We used the SOPHIA event generator sophia to calculate the average spectrum of neutrinos produced in a single proton interaction on the cluster photon background and we parametrized the results as:
| (5) |
for and 0 otherwise. In order to calculate the interaction probability per unit time we use the interaction lengths as calculated in the next section and we approximate the interaction length in the region with as: , with (see Fig. 6).
The integration limits for the proton energy in Eq. IV are: and (for the neutrino production is negligible).
For the purpose of numerical calculations, we assume, following bbp97 ; bc , that the cosmic ray source has a luminosity, above energy , (see also Sec. II).
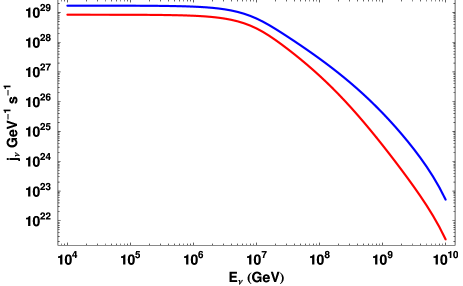
The neutrino spectrum from Eq. IV for is plotted in Fig. 5 for magnetic field (lower curve) and (upper curve). Assuming that the cluster is located at a typical distance of , our estimate of the neutrino flux at the Earth is of for magnetic field and for magnetic field .
This result varies somewhat with different choices of the diffusion coefficient, but not in a substantial way. Steeper injection spectra of cosmic rays imply smaller neutrino fluxes.
V Neutrino production: a Monte Carlo approach
The result obtained in the previous section may somewhat be affected by the adoption of a more detailed distribution of the IR photons in the ICM, as well as by details of the diffusion in a space dependent magnetic field. In particular, both the IR light and the magnetic field are expected to be higher in the central region of the cluster. In order to investigate the effect of these factors on the predicted neutrino flux, we performed a Monte Carlo calculation of the propagation and the related neutrino production.
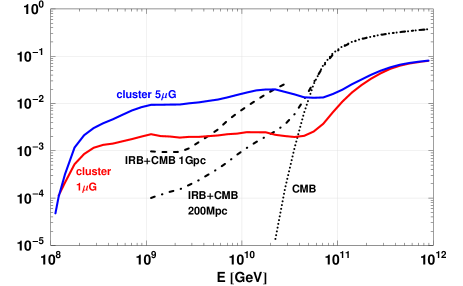
The photon background is taken as the superposition of the IR background, as calculated in Sec. III, and the usual CMB. We divide the cluster in six concentric zones with radii: , , , , and . In each zone we assume the infrared background to be constant and equal to the average one in that zone. The interaction lengths calculated in each zone are plotted in Fig. 6.
The simulation of the propagation of charged particles in the ICM requires a specific choice of the strength, spatial profile and disordered component of the magnetic field. Inspired by the results of mf1 ; mf2 on the cluster Abell 119, we assume that the total magnetic field scales with distance from the center of the cluster as given by the flux freezing condition with an electron thermal component modelled as a -model:
| (6) |
with . This result agrees quite well with both the theoretical expectation of for a magnetic field frozen in matter ( is the electron density) and with the simulation results of Ref. rodo (see their Fig. 1). As a result, the average magnetic field strength in the six zones of the cluster changes from about 4.5 G in the inner zone to about 0.18 G in the outer zone in the case of 5 G strength in the center. The average field values are scaled down by a factor 5 for the 1 G case. The simulation code does not use these averages, rather the magnetic field at the particle location.
We implemented a turbulent magnetic field with the above radial dependence dividing the ICM in cubes of side, each filled with a random magnetic field of average strength satisfying a Kolmogorov spectrum with three logarithmic sub-scales (). Given the proton position we calculate the turbulent magnetic field in the cube containing the particle and then we scale its magnetic field according to Eq. (6). For more informations and details about the actual implementation see Appendix B of Ref. simu .
We calculate the neutrino yield, , namely the spectrum of neutrinos generated during the propagation of protons of energy in the ICM. This calculation is carried out by injecting protons in 30 logarithmic energy bins between and . We inject 10,000 protons for each energy bin. We follow their propagation in the ICM until their distance from the center exceeds or their energy falls below . Clearly the neutrino yield as defined here depends on the specific model for injection of the particles. We limit ourselves to considering only the case of a source that generates cosmic rays in the center of the cluster.
The propagation is simulated using the Monte-Carlo code described in Ref. simu . The nucleon-photon interactions are simulated with the event generator SOPHIA sophia . At each interaction we record the secondary products and then at the end of the simulation we have the spectrum of the neutrinos produced inside the cluster by a proton injected with a given energy, .
We ran our simulation for two values of the magnetic field in the center of the cluster, and . In Fig. 6 we plot the pathlength travelled by particles propagating in the cluster as a function of energy for the case of injection in the center and for . For each energy bin we calculate the average pathlength travelled. In this average we include particles that exit the cluster and particles that go below threshold. This considerably reduces the pathlengths at low energy (below ).
Since at about the interaction time becomes larger than the age of the universe (see Fig. 6) we decided to use only the protons with energy above to calculate the neutrino flux. Lower energy protons, even with a steep spectrum, do not change the predicted neutrino flux because at these energies they lose their energy mainly due to adiabatic energy losses.
Fig. 7 shows the fraction of the proton energy that is converted to neutrinos before leaving the cluster. For energies around 21017 eV this fraction is 0.1% and almost linearly increases with to about 1% at 1018 eV and stays roughly constant at higher energy. The proton energy loss in the cluster is a function of the hadronic cross section and of the containment time in the cluster. Because protons of energy approaching eV propagate almost in straight lines inside the cluster they are not expected to be very efficient in generating neutrinos.
For the case of protons injected at the center of the cluster, the neutrino spectrum is given by
| (7) |
where: is the neutrino yield, for neutrinos of type , at given proton energy and is the injection rate of protons in the cluster.
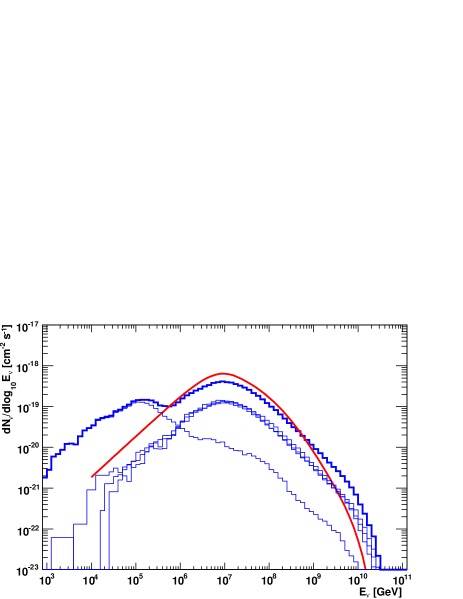
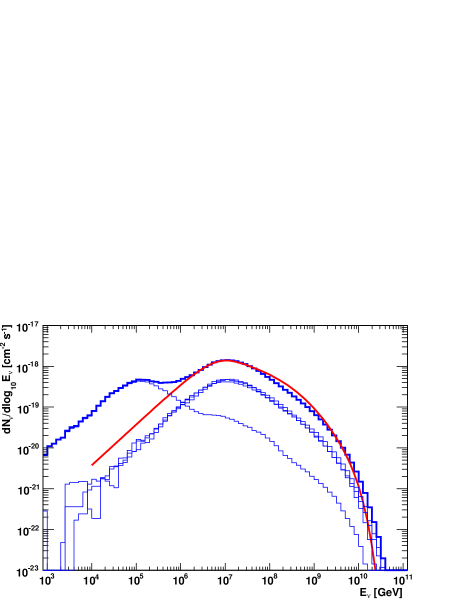
The results of our Monte Carlo calculations are shown in Fig. 8. The upper (lower) panel refers to the case (). Both panels show the well known pronounced two peaks ESS01 due to the direct neutrino production (higher energy peak) and neutrino production following neutron decay (lower energy peak). The from neutrons decaying outside the cluster are not included. The fluxes of neutrinos of different flavors are superimposed and the thick histogram represents the total flux. The continuous line is the result of the analytical calculations discussed in Sec. IV. The agreement between the analytical and Monte Carlo calculations is remarkable, although the former did not include the decay of neutrons, and therefore has no low energy peak.
The integrated flux of neutrinos with energy GeV as calculated from the Monte Carlo for a cluster at a typical distance of 100 Mpc is for and for . One should keep in mind that this flux is obtained for a source luminosity in the form of protons . The neutrino flux scales linearly with , and may be appreciably higher than those predicted here if a substantially more luminous source happens to be located in a nearby cluster. On the other hand, the neutrino flux is dominated by neutrinos with energies around eV, generated by particles that travel within the ICM for a substantial fraction of the age of the cluster. The luminosity reported above should therefore be interpreted as the proton luminosity averaged over a period comparable with the age of the cluster and it is unlikely to find values of much higher than that used here.
VI The Diffuse Neutrino Flux
In this section we illustrate our calculations of the contribution of photopion production in clusters of galaxies to the diffuse neutrino flux. For this purpose, we use the results of our Monte Carlo calculations (Sec. V) to obtain a template spectrum to be convolved with the mass distribution of clusters of galaxies. For the integral mass function of clusters of galaxies we use the following expression bc93 :
| (8) |
where is the total (gravitational) mass of a cluster within and is a reference cluster mass. This distribution covers the range from to . For our numerical calculations we adopt for the dimensionless Hubble constant. The flux of diffuse neutrino radiation from clusters of galaxies, as due to photopion production can be written as
| (9) |
where we neglect the effect of redshift since the uncertainties in the determination of the neutrino emissivity, , are very large compared with the effects of cosmology. Rather than presenting several cases of diffuse neutrino fluxes, depending on the choice of the several parameters that enter the calculations, we decided here to show the maximum neutrino flux. In order to estimate this flux, we assume that the maximum allowed cosmic ray luminosity in the cluster is
| (10) |
where we used the definition of virial radius as
| (11) |
with , for the matter fraction in the universe and for the critical density. One should keep in mind that luminosities of this order of magnitude can only be reached in the context of major mergers of clusters of galaxies, namely when two clusters with comparable masses merge to form a new more massive cluster. Aside from the obvious fact that these events are rather rare, one should also remember that the shock waves that develop during these events and that are responsible for both the heating of the intracluster gas and the possible acceleration of cosmic rays, have relatively low Mach numbers gabici1 (e.g. ). The spectrum of particles accelerated at these shocks is typically very steep gabici1 , and certainly quite steeper that , used in our calculations of the neutrino emissivity. Eq. 10 is therefore expected to be an absolute upper limit to the cosmic ray luminosity (or equivalently to the cosmic ray energy density averaged over the age of the cluster, ), in particular if used together with relatively flat spectra (e.g. ). These large energy densities would also be in contradiction with the upper bounds to cosmic ray pressure found in Reimer2004 for the Coma cluster, although these limits are somewhat model dependent. Lower cosmic ray luminosities and flatter injection spectra are likely to be obtained if particle acceleration takes place at shock waves that develop at the outskirts of clusters gabici2 ; gabici3 ; ryu , due to their larger Mach numbers (namely lower temperatures of the background unshocked gas).
The estimate of our upper limit on the diffuse neutrino flux from photopion production in clusters of galaxies is shown in Fig. 9: the thick (thin) histogram represents our upper limit when the maximum energy of protons in clusters is eV ( eV). We also show there the upper bound on the neutrino flux from interactions as found in bbp97 (dotted line). Note however that the upper limit in bbp97 was found by requiring that gamma rays generated in proton-proton inelastic scatterings in the ICM would saturate the EGRET diffuse gamma ray background. This would require in Eq. 10 and injection spectrum . As we already stressed, this situation is totally unphysical, as also discussed in bbp97 , but represents a solid upper limit to the flux of neutrinos from clusters.
In Fig. 9 the flux of atmospheric neutrinos is also plotted (from atmo ) in order to emphasize the flatness of the neutrino spectrum as predicted here and the energy region in which neutrinos from photopion production in clusters may overcome the atmospheric neutrino flux (the dark-hatched region is the standard atmospheric neutrino flux, while the light-hatched region refers to prompt neutrino emission from charmed mesons). This happens at energy GeV. The upper limits that we show are still above the ICECUBE sensitivity (but below AMANDA II), as shown in the plot.
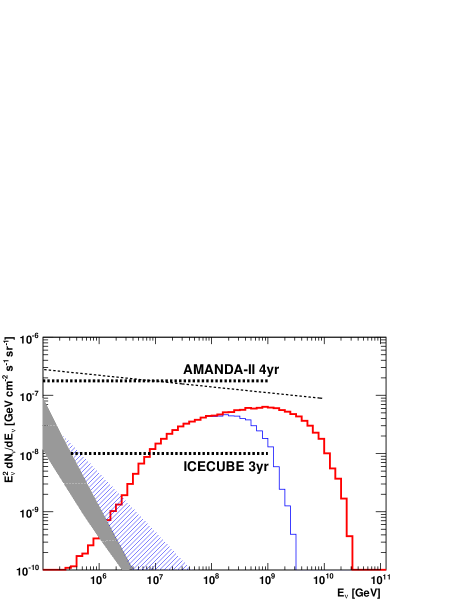
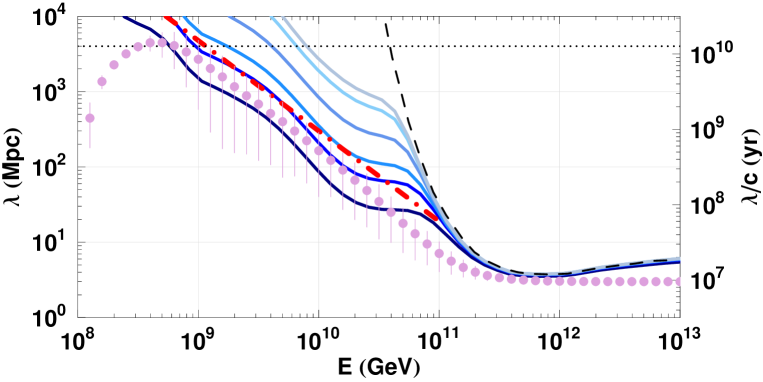
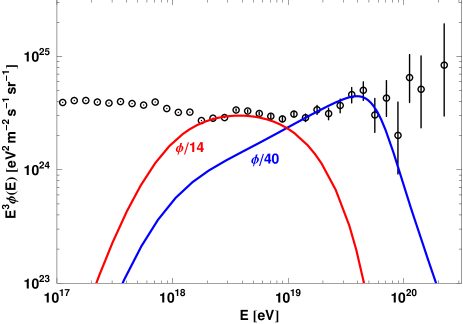
In obtaining the upper limit neutrino flux in Fig. 9, we did not consider however another important constraint: as we stressed in Sec. IV, there are cosmic rays that are able to escape from the cluster volume in times shorter than the age of the cluster. Following Fig. 6 we adopt as a fiducial energy for the escape eV: particles with larger energies are not trapped inside the cluster and contribute to the flux of extragalactic cosmic rays at the Earth. It is important to realize that the spectrum of the escaping particles is very close to the injection spectrum at the source and does not resemble the spectrum of cosmic rays in the ICM (Eq. 3). The effect of energy losses on the spectrum of escaping cosmic rays is negligible. We calculated the flux of cosmic rays escaping clusters and reaching the Earth following the well known approach to propagation illustrated in grigo , which allows us to take into account photopion production, Bethe-Heitler pair production and adiabatic losses on cosmological scales. The results of our calculations are plotted in Fig. 10 for a maximum energy of the primary protons eV and eV. The low energy ( eV) cutoff in the spectra reflects the lack of confinement of higher energy cosmic rays. The curves are normalized to the data of AGASA and Akeno: in order to avoid exceeding the observed fluxes of cosmic rays at the Earth, the flux from clusters needs to be suppressed by a factor for and by a factor for . The neutrino fluxes in Fig. 9 need to be lowered by the same factors, so that the predicted neutrino fluxes from photopion production in clusters drop below the sensitivity limit for ICECUBE.
VII Discussion and Conclusions
We calculated the neutrino flux that could be expected from the photopion interactions of very high energy protons with the infrared light and the cosmic microwave background in clusters of galaxies. The main target for these interactions is represented by the infrared photons generated by galaxies in the cluster itself. This background can be much higher than the cosmic infrared background. This argument, added to the effective confinement of cosmic rays within the ICM for long times make clusters interesting targets for neutrino telescopes.
The calculations have been carried out both analytically and with a Monte Carlo code for the propagation and interaction of high energy protons. There are many uncertainties involved in these calculations: the cosmic ray luminosity in the ICM averaged over cosmological times is very uncertain, though somewhat limited by multifrequency observations of some clusters. These observations suggest that less than of the thermal energy content of cluster is in the form of cosmic rays. This limit is rather weakly dependent on the diffusion coefficient, which instead strongly affects the escape times out of clusters.
The confinement time is important for our calculations because neutrinos are mainly produced by cosmic rays with energy in excess of eV, where the confinement time is expected to be comparable with or shorter than the age of a cluster (Fig. 6). The extent to which this is true depends on the choice of the diffusion coefficient which is unknown and poorly constrained due to our ignorance of the strength, structure and coherence scale of the magnetic field in the ICM. As shown in Fig. 6, for reasonable assumptions on this magnetic field, the diffusion coefficient in clusters is expected to have a dependence on momentum which is roughly linear in the energy region from to eV. We have checked the correctness of this finding in toy propagation models and concluded that without particle energy losses the containment time is exactly , despite the fact that the model of magnetic field turbulence adopted for the scattering of the particles is of Kolmogorov type. While we believe that we describe well the proton propagation in the transition region, the diffusive part of the propagation might be not fully realistic. If we overestimated the diffusion time of cosmic rays out of the clusters, then the neutrino flux is correspondingly reduced. This applies equally well to all neutrino flavors.
The location where cosmic rays are injected also changes the predicted neutrino fluxes but only in a rather marginal way. If the sources are spread over the cluster volume rather than being concentrated in the center as we assumed, then the neutrino fluxes are estimated to be a factor lower than predicted here. On the other hand it is reasonable to think that the IR background could have been higher in the past epochs due to luminosity evolution of the galaxies in clusters. This evolution might enhance the rate of neutrino production in the past, that would reflect into a higher diffuse neutrino flux for a given cosmic ray luminosity.
The neutrino fluxes from single galaxy clusters as calculated here were found to be undetectable with the currently planned and constructed detectors, such as IceCube IceCube and the European km3 detector km3 . Their detection would require the development of detection techniques able to provide much higher detection volumes, such as the radio detection technique radio .
The superposition of the tenuous neutrino fluxes from all clusters in the universe generates a diffuse neutrino flux and turns out to be somewhat more interesting that the single sources. We estimated this diffuse neutrino flux in Sec. VI and our results are plotted in Fig. 9. The upper limit to the neutrino flux appears to be detectable by IceCube. On the other hand, the cosmic rays that are responsible for the production of these neutrinos also escape the cluster and may reach us as cosmic rays. When the flux of these cosmic rays is calculated, it exceeds the observed fluxes of cosmic rays by a factor if the maximum energy of protons is eV and by a factor if this maximum energy is eV. The neutrino fluxes are expected to be suppressed by the same factors, unless some other process inhibits the propagation of these cosmic rays on cosmological scales. One example of such processes, although not a viable one, could be provided by the presence of a non negligible magnetic field in the intergalactic medium (spread over scales comparable with the loss length of particles with energies eV). However, the value of the magnetic field needed to shrink the so-called magnetic horizon of particles of energy eV to, say, 1/10 of the size of the universe is of the order of , which appears to be unreasonably large for the magnetic field averaged over the size of the universe.
Acknowledgements This work was supported in part by NASA grant ATP03-0000-0080. The work of PB was supported through Cofin 2004.
References
- (1) V.S. Berezinsky, P. Blasi and V.S. Ptuskin, Ap. J. 487, 529 (1997)
- (2) H.J. Volk, F.A. Aharonian and D. Breitschwerdt, Space Sci. Rev. 75, 279 (1996)
- (3) Y. Fujita and C.L. Sarazin, Ap. J. 563, 660 (2001)
- (4) P. Blasi, Astropart. Phys. 15, 223 (2001)
- (5) G. Brunetti, Journ. of the Korean Astron. Soc. 37, 493 (2004)
- (6) P. Blasi, Journ. of the Korean Astron. Soc. 37, 483 (2004)
- (7) S. Colafrancesco and P. Blasi, Astropart. Phys. 9, 227 (1998)
- (8) T.A. Ensslin, P.L. Biermann, P.P. Kronberg, and X-P. Wu, Ap. J. 477, 560 (1997).
- (9) C. Rordorf, D. Grasso and K. Dolag, Astropart. Physics 22, 167 (2004)
- (10) L. Feretti, G. Brunetti, G. Giovannini, N. Kassim, E. Orr and G. Setti, G., Journ. of the Korean Astron. Soc. 37, 315 (2004)
- (11) K-T. Kim, P.P. Kronberg, P.E. Dewdney, and T.L. Landecker, Ap. J. 355, 29 (1990)
- (12) T.E. Clarke, P.P. Kronberg and H. Böhringer, Ap. J. Lett. 547, 111 (2001)
- (13) R. Fusco-Femiano, D. Dal Fiume, L. Feretti, G. Giovannini, G. Matt and S. Molendi, Adv. Sp. Res. 25, 757 (2000)
- (14) S. Gabici and P. Blasi, Astropart. Phys. 19, 679 (2003)
- (15) S. Gabici and P. Blasi, Astropart. Phys. 20, 579 (2004)
- (16) E. Bertschinger, Ap. J. Suppl. Ser. 58, 39 (1985)
- (17) S. Gabici and P. Blasi, Proc. of High Energy Gamma-Ray Astronomy: 2nd International Symposium, Heidelberg (Germany). Edited by F.A. Aharonian, H.J. Völk, and D. Horns. AIP Conference Proceedings, Volume 745. New York: American Institute of Physics, 2005, p.561.
- (18) H. Kang and T.W. Jones, Journ. of the Korean Astron. Soc. 37, 405 (2004)
- (19) S. Gabici and P. Blasi, Ap. J. 583, 695 (2003)
- (20) R.C. Berrington and C.D. Dermer, Ap. J. 594, 709 (2003)
- (21) M. Thierbach, U. Klein and R. Wielebinski, A&A 397, 53 (2003)
- (22) A. Reimer, O. Reimer, R. Schlickeiser and A. Iyudin, A&A 424, 773 (2004)
- (23) G. Brunetti and P. Blasi, MNRAS, in press. (2005)
- (24) G. Lagache, H. Dole and J.-L. Puget, MNRAS, 338, 555 (2003)
- (25) http://lully.as.arizona.edu/Model/
- (26) A. Franceschini et al, A&A, 378, 1 (2001)
- (27) E. Parizot, Nucl. Phys. Proc. Suppl. 136, 169 (2004)
- (28) A. Mucke, R. Engel, J.P. Rachen, R.J. Protheroe and T. Stanev, Comput. Phys. Commun. 124, 290 (2000)
- (29) P. Blasi and S. Colafrancesco, Astropart. Phys. 12, 169 (1999)
- (30) K. Dolag, S. Schindler, F. Govoni and L. Feretti, A&A 378, 777 (2001)
- (31) M. Murgia et al., preprint: astro-ph/0406225
- (32) T. Stanev, R. Engel, A. Mucke, R.J. Protheroe and J.P. Rachen, Phys. Rev. D 62, 093005 (2000)
- (33) R. Engel, D. Seckel & T. Stanev, PRD 64, 093010 (2001)
- (34) N.A. Bahcall and R.Y. Cen, Ap. J. Lett. 407, 49 (1993)
- (35) D. Ryu, H. Kang, E. Hallman and T.W. Jones, Ap. J. 593, 599 (2003)
- (36) J. Ahrens et al. [IceCube Collaboration], Astropart. Phys. 20, 507 (2004)
- (37) C. Spiering, in the proceedings of Nobel Symposium 2004: Neutrino Physics, Haga Slott, Enkoping, (2004) [preprint astro-ph/0503122]
- (38) V.S. Berezinsky and S.I. Grigorieva, A&A 199, 1 (1988)
- (39) http://icecube.wisc.edu
- (40) http://www.km3net.org
- (41) H. Falke, P. Gorham and R.J. Protheroe, New Astron. Rev. 48, 1487 (2004)