SPH simulations of accretion flow via Roche lobe overflow and via mass transfer from Be disk
Abstract
We compare the accretion flow onto the neutron star induced by Roche lobe overflow with that by the overflow from the Be disk, in a zero eccentricity, short period binary with the same mass transfer rate, performing three-dimensional Smoothed Particle Hydrodynamics simulations. We find that a persistent accretion disk is formed around the neutron star in both cases. The circularization radius of the material transferred via Roche lobe overflow is larger than that of the material transfered from the Be disk. Thus, the growth of the accretion disk in the former case becomes significantly slower than in the latter case. In both cases, the mass accretion rate is very small and varies little with orbital phase, which is consistent with the observed X-ray behaviour of Be/X-ray binaries with circular orbits (e.g. XTE J1543-568).
1Department of Applied Physics, Graduate School of Engineering,
Hokkaido University, Kitaku N13W8, Sapporo 060-8628, Japan.
2Faculty of Engineering, Hokkai-Gakuen University, Toyohira-ku,
Sapporo 062-8605, Japan.
3Centre for Astrophysics and Supercomputing, Swinburne University of Technology,
Hawthorn Victoria 3122 Australia.
1. Introduction
Most of binaries, which exhibit the X-ray activity, have a circular orbit around the common center of mass, in which an accretion disk is mainly formed via the Roche lobe overflow from a mass-donor star. On the other hand, in Be/X-ray binaries which consist of a neutron star and a Be star, an accretion disk is formed around the neutron star via the mass transfer from the circumsteller disk of the Be star (Hayasaki & Okazaki 2004). Little work has been so far done on the accretion flow around the neutron star with an attention to the difference between the overflow from the circumsteller disk around the Be star (model A) and the Roche lobe overflow from the Be star (model B). In this paper, we study how the material accretes onto the neutron star in both cases, performing three dimentional (3D) Smoothed Particle Hydrodynamics (SPH) simulations.
2. Formation and Evolution of the accretion disk
We carried out the simulations by using the same 3D SPH code as in Hayasaki & Okazaki (2004, 2005a and 2005b) [see also Okazaki et al. (2002); Bate, Bonnell & Price (1995)]. In order to investigate the accretion flow around the neutron star, two simulations have the same parameters as Hayasaki & Okazaki (2005b) except for the eccentricity , the mass transfer rate and the inner boundary radius , where is the semi-major axis of the binary. In model B, the Roche lobe overflow is modelled by launching the gas particles at the inner Laglange point , in which we add SPH particles per orbit with an initial speed , in a direction rad prograde of the binary axis (Lubow & Shu 1975). In what follows, the units of time is .
Fig.1 shows the orbital-phase dependence of the circularization radius (the left panel) and the viscous time-scale in units of (the right panel). In each panel, the solid line and the dotted line denote the circularization radius and the viscous time-scale of model A and model B, respectively. As shown in Fig.1, it is likely that the disk growth of model A is faster than that of model B.
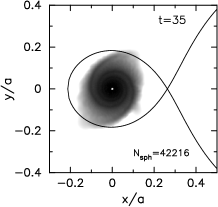
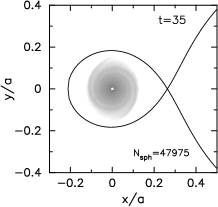
Fig.2 gives snapshots of the accretion flow around the neutron star at . Each panel shows the logarithm of the surface density, where the solid curve denote the inner Roche lobe. As seen in Fig.2, we note that a persistent accretion disk is formed around the neutron star in both cases.
Fig.3 shows the evolution of mass-accretion rate. The solid line and the dotted line show the mass-accretion rate of model A and model B, respectively. We note from the figure that the mass accretion rate of model A is much higher than that of model B.


3. Summary
We have perfomed 3D SPH simulations in order to compare the accretion flow onto the neutron star induced by Roche lobe overflow with that by the overflow from the Be disk in a a zero eccentricity, short period binary with the same mass-transfer rate. We have found that a persistent accretion disk is formed around the neutron star in both cases, as seen in Fig.2. The mass accretion rate in model A is much higher than that in model B becasue of the smaller circularization radius in model A, as shown in Fig.1 and 3. This indicates that the disk growth is faster as the specific angular momentum of gas particles is lower. In either case, the tiny mass-accretion rate is consistent with the observed X-ray behaviour of Be/X-ray binaries with circular orbits (e.g. XTE J1543-568).
Acknowledgments.
The simulations reported here were performed using the facility of the Centre for Astrophysics & Supercomputing at Swinbune University of Technology, Australia. This work has been supported by Grant-in-Aid for the 21st Century COE Scientific Research Programme on ”Topological Science and Technology” from the Ministry of Education, Culture, Sport, Science and Technology of Japan (MECSST) and in part by Grant-in-Aid for Scientific Reserch (15204010) of Japan Society for the Promotion of Science.
References
- Bate, Bonnell & Price (1995) Bate M.R., Bonnell I.A.,Price N.M., 1995, MNRAS, 285, 33
- Hayasaki & Okazaki (2004) Hayasaki K & Okazaki A.T., 2004, MNRAS, 350, 971
- Hayasaki & Okazaki (2005a) Hayasaki K & Okazaki A.T., 2005a, MNRAS, 360L, 15
- Hayasaki & Okazaki (2005b) Hayasaki K & Okazaki A.T., 2005b, another proceedings in this conference
- Lubow & Shu (1975) S H. Lubow & H F. Shu., 1975, ApJ, 198, 383
- Okazaki et al. (2002) Okazaki A.T., Bate M.R., Ogilvie G.I & Pringle J.E., 2002, MNRAS, 337, 967