Luminous Compact Blue Galaxies in Intermediate Redshift Galaxy Clusters: A Significant But Extreme Butcher-Oemler Population
Abstract
We identify a population of Luminous Compact Blue Galaxies (LCBGs) in two galaxy clusters: MS0451.6-0305 () and Cl1604+4304 (). LCBGs are identified via photometric characteristics and photometric redshifts derived from broad and narrow band images taken with the WIYN telescope and the Hubble Space Telescope. We analyze their surface densities and clustering properties to find they compose a statistically significant portion ( and ) of the Butcher-Oemler galaxies in both clusters, and their spatial distributions are best characterized by a shell model. The enhancement of the projected space-density of LCBGs with M in the clusters relative to the field is 3-10 times higher than the BO population as a whole, but 2 times lower than the red population, except in the core where LCBGs are absent. Assuming some fading, a natural descendant would be small, low-luminosity galaxies found preferentially in today’s clusters, such as dEs.
1 Introduction
The number of blue, star forming galaxies increases in all environments at intermediate redshifts (). In the field, there is a dramatic rise in the space-density of luminous222We adopt H km s-1 Mpc-1, , and . (), compact (kpc), and blue () galaxies known as LCBGs (Koo et al. 1994; Guzmán et al. 1997). These galaxies produce stars at such a tremendous rate ( M⊙ yr-1, Hammer et al. 2001) they provide a substantial fraction of the star formation in the universe at (Guzmán et al. 1997). In clusters, Butcher & Oemler (1978, 1984; hereafter BO) claimed the fraction of blue galaxies increases with redshift. Blue cluster galaxies have been classified as a mix of normal galaxies absent in local clusters, morphologically disturbed, and star forming galaxies (Oemler, Dressler, & Butcher 1997). Recent studies indicate star forming galaxies in intermediate redshift clusters are typically small, disk-like (de Propris et al. 2002; Lotz, Martin, & Ferguson 2003; Finn, Zaritsky, & McCarthy 2003) and falling into the cluster (Balogh, Navarro, & Morris 2001; Homeier et al. 2004; Tran et al. 2005) in groups and clumps (Kodama et al. 2002). While several studies exist for LCBGs in the field and Koo et al. (1997) have identified a handful of LCBGs in CL0024, no thorough census of LCBGs in clusters has been completed.
Field LCBGs and cluster star-forming galaxies have been proposed as the progenitors of dwarf elliptical (dE) galaxies (Koo et al. 1994; Guzmán et al. 1997; Koo et al. 1997; Martin et al. 2000) or low-mass S0’s (Tran et al. 2005). The line widths and physical sizes of field and cluster LCBGs are consistent with those of dwarf elliptical galaxies (or field “dEs” like NGC205). Recent bursts inferred from the stellar histories of local dwarf ellipticals (Grebel, Gallagher, & Harbeck 2004) and in nearby clusters (Poggianti et al. 2001; Conselice, Gallagher, & Wyse 2001) support a fading scenario. LCBGs are viable candidates to explain, and eventually fill in, the missing faint red sequence of galaxies seen at (de Lucia et al. 2004, Goto et al. 2005). However, the high masses (P97), high metallicities (Kobulnicky & Zaritsky 1999), large extinctions (Hammer et al. 2001), and centrally concentrated star-bursts (Barton and van Zee 2001) seen in some LCBGs make them plausible candidates to be a burst phase of more massive spiral galaxies. Both dE’s and more massive bulges are accreted populations in local clusters (Conselice et al. 2001; Biviano et al. 2002), but they have very different morphology-density relationships (Ferguson & Bignelli 1994). Understanding the prevalance and distribution of LCBGs in clusters should constrain their role as a progenitor population.
In this Letter we measure the density and clustering properties of LCBGs in two rich clusters (Table 1): MS 0451.6-0305 (catalog ) and Cl1604+4304 (catalog ). MS0451 is an incredibly rich, X-ray bright cluster (Ellingson et al. 1998; Donahue et al. 2003). Cl1604+4304 is part of a super-cluster complex (Postman, Lubin, & Oke 2001, Lubin, Mulchaey, & Postman 2004, Gal & Lubin 2005), but is not as x-ray luminous. The cluster redshifts span an epoch where the dynamical mass of field LCBGs changes rapidly (P97), and are sufficiently disparate to permit the derivation of complementary field samples using the same data.
2 Observations and Analysis
Observations were obtained with the WIYN 333The WIYN Observatory is a joint facility of the University of Wisconsin-Madison, Indiana University, Yale University, and the National Optical Astronomy Observatories. 3.5m telescope’s Mini-Mosaic Camera ( per pixel and field of view) and augmented with archival HST WFPC2 and ACS images for both clusters, reduced via the standard HST reduction pipeline. MS0451 is sampled by images in the F775W, F814W, and F850LP bandpasses; Cl1604 is imaged in F606W and F814W. Harris UBRI, Gunn z, and two narrow-band filters 444On-band filters were custom-made narrow-band () filters sampling rest-frame [OII]Å. Off-band filters were NOAO filter KP1582 () for MS0451 and another custom filter () for Cl1604. were obtained at WIYN between 1999 October and 2004 June. We use data from nights with good transparency and seeing (FWHM arcsec).
Reduced Mini-Mo images are flat to within of their initial sky values. We created deep mosaics by combining only high quality data weighted by the ratio of the flux from an average star to the square root of the sky deviation and seeing for that image (Bershady, Lowenthal, & Koo 1998). Data were calibrated through: (1) spectro-photometric standard stars (Massey et al. 1988) and Landolt (1992) photometric stars observed during the WIYN 3.5m runs; (2) observations of Landolt (1992) standards and cluster fields at the WIYN 0.9m telescope; (3) comparisons to the HST WFPC2 and ACS observations; (4) comparison of the observed stellar locus to that derived for our filter set from the Gunn-Stryker catalog (Gunn & Stryker 1983). Through these methods, we estimate relative and absolute calibration uncertainties are below , assuming no large metallicity differences exist between the Gunn-Stryker catalog and our field stars.
Object detection was performed on the sum of the UBRIz images using SExtractor (Bertin & Arnouts 1996) with the criterion that objects contained contiguous pixels above of the sky noise. Detection completeness was determined via Monte Carlo simulations reinserting real objects back into the images. Total magnitudes and half-light radii are determined from light-profile curves of growth. Total magnitudes are set to the flux within an aperture which is a multiple of the radius ( is the Petrosian ratio as defined by Kron 1995). The multiplier is determined from the light-concentration parameter, (Bershady, Jangren, & Conselice al. 2000). With this “tailored” aperture, total magnitudes are measured to an accuracy regardless of profile shape (cf., only 80% of the light is enclosed where for an profil; Graham et al. 2005). Colors were determined within seeing-matched aperture of radius FWHM in each image. Photometric precision is 0.1 mag at for total and seeing-matched apertures, respectively. Random errors for total magnitudes depend on the light-profile shape; -law profile errors are larger than the values quoted here for exponential profiles.
Photometric redshifts are determined through a method similar to Csabai et al. (2003). We convolved a standard set of model and observed galaxy templates with our filters to produce a template-redshift grid for and . Both fields have close to 100 galaxies with spectroscopic redshifts (Ellingson et al. 1998; Postman et al. 1998). For each field we match galaxies with high-quality spectroscopic redshifts and good photometry with points on the template-redshift grid, and correct the grid for differences between the simulated and measured colors. The trained grids yield photometric redshifts for every object with a precision (blue objects) and 0.03 (red objects) to and .
Absolute magnitudes, radii, rest-frame surface-brightness and colors were calculated for all objects using photometric or spectroscopic redshifts. K-correction calculations adopt method 4 of Bershady (1995). Half-light radii were measured in the band closest to rest-frame B, and corrected for PSF effects by quadrature subtraction of the stellar half-light radius. Surface brightnesses in the WIYN images were corrected for seeing using measurements from the overlapping regions with the HST data. WIYN-based surface brightnesses have a 1.5 mag dispersion due to seeing-correction effects on the measured radii.
3 Identification of LCBGs
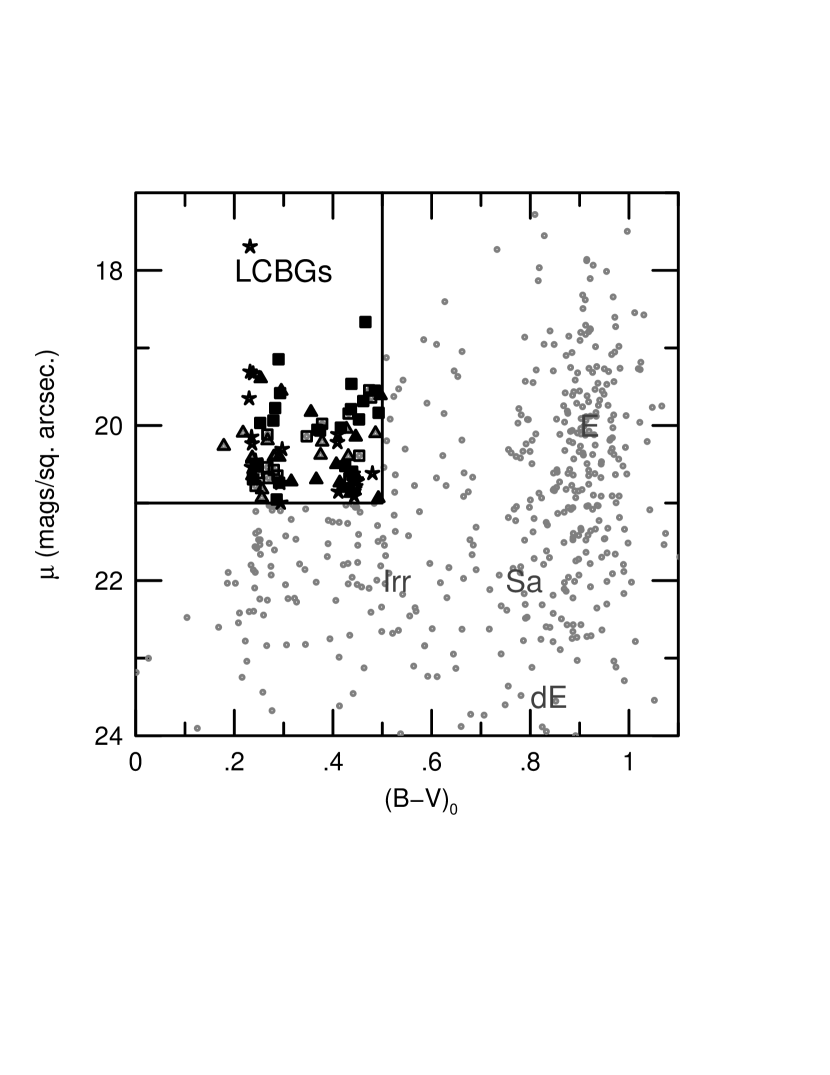
We define LCBGS here as “enthusiastic” star forming galaxies. For these purposes, we define LCBGs as having the following properties: and mag arcsec-2, where is the rest-frame B-band average surface brightness within the half-light radius. A galaxy with and a constant star formation rate will have and for ages more than a few 108 yr. A moderate amount of extinction, e.g. , will leave the galaxy with the above parameters. Anything bluer or brighter will be more than an enthusiastic star former. The selection region for LCBGs is plotted in Figure 1. This region is mostly devoid of objects in local surveys (e.g., Werk et al. 2004, Garland et al. 2004) and is purposely constructed to identify actively star forming galaxies that are extreme compared to the local universe in clusters or the field. For comparison with other LCBG samples and to differentiate them from “dwarf” galaxies (at least in luminosity), we also require LCBGs to have .
Galaxies were selected from the ground-based data set. We estimate, based on extant HST data, this selection misses of the bona-fide LCBGs ( primarily due to the error in the size measurement ), while introducing the same percentage of false classifications. We identified “cluster” galaxies in our sample– including LCBGs – as having a photometric redshift within of the cluster’s redshift and a reasonable probability to be at the cluster redshift based on the individual photometric error and measurements from the training set (Brunner and Lubin 2000). Within 1 Mpc of the clusters’ centers, we find 41 candidate LCBGs. Four objects are confirmed as cluster members through spectroscopic redshifts, and 23 are confirmed by having strong emission (equivalent width greater than 10 Å) in the “on” narrow-band image, which samples rest-frame [OII]. We have 3 objects that are identified as cluster LCBGs, but have spectroscopic redshifts that place them outside of the cluster (still within a redshift of 0.1 of the cluster) and weak [OII] emission. The remaining 10 objects require spectroscopic follow-up to confirm cluster membership.
We select two other groups of luminous (M) cluster galaxies in our data, red and blue, to compare to the LCBG population. We fit the color-magnitude relationship in both clusters, splitting the population according to the classic definition of the Butcher-Oemler effect (Butcher & Oemler 1978, 1984): are “BO” galaxies, which include the LCBG population. The remainder are the red cluster sequence. We measure within Mpc, rising to at Mpc in MS0451, in good agreement with Ellingson et al. (2001) and de Propris et al. (2003). For Cl1604, we measure within Mpc, and rising to by Mpc, as compared to the values of as measured by Rakos & Schombert (1995).
4 The Number Density and Distribution of Cluster LCBGs
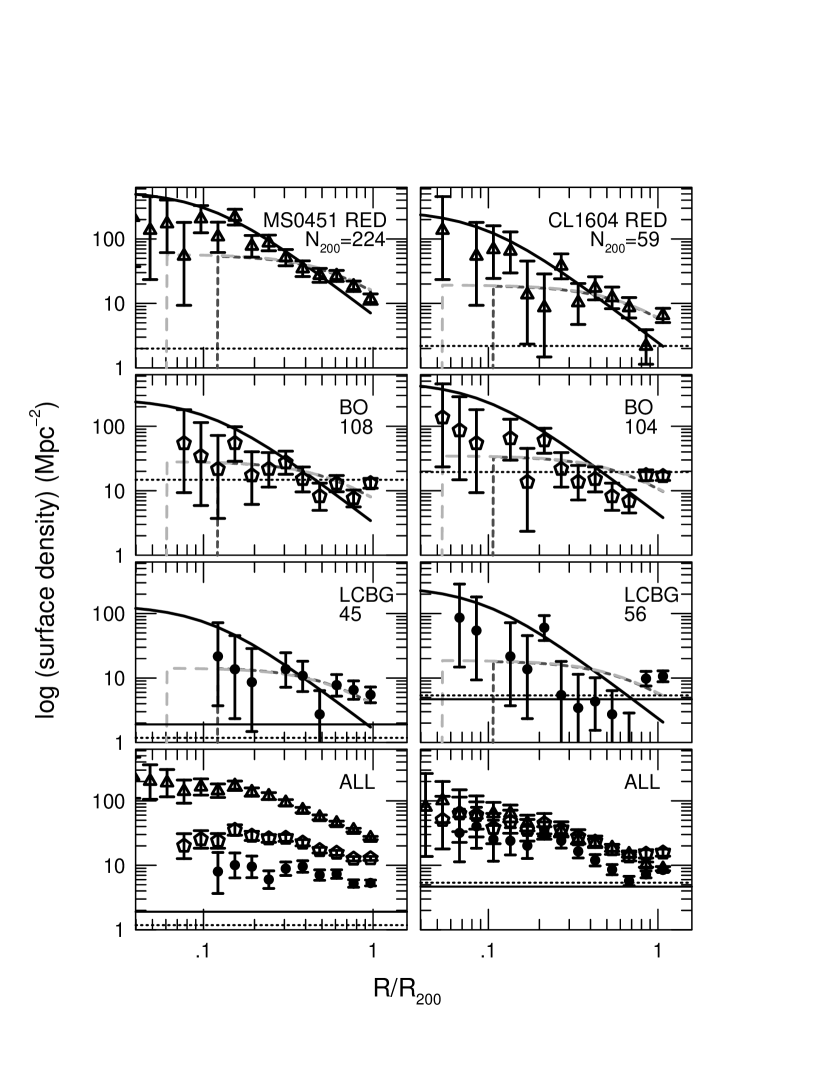
We plot the surface density of galaxies in Figure 2 as a function of radius from the cluster center (defined as the brightest cluster galaxy). The data extend to a radius where our completeness is still uniform in the WIYN images. Two basic results emerge. (1) All populations clearly show evidence of clustering. (2) LCBGs form a statistically significant population in both clusters: and of the total population at and M (for MS0451 and Cl1604, respectively), and and of the BO galaxies in each cluster. (Errors are likely non-Gaussian, and arise from cluster-membership uncertainties.) For comparison, we estimate LCBGs constitute approximately and of all field galaxies blue enough to be classified as “BO” at and 0.9.
We model the projected distribution of the LCBG, BO and red cluster populations with a King profile (King 1972) and two spherical-shell density profiles. The King radius is set to the scale radius of the X-ray profile for each cluster (Donahue et al. 2003, Lubin et al. 2004). Spherical-shell models are empty inside of the X-ray scale radius (“shell”) or half this value (“half-shell”), and then both decline as a King profile with a 1 Mpc core radius. The King model fits all of the populations well in a sense. The red population is only fit well by the King model; the BO populations are best fit by the half-shell model; and LCBGs in MS0451 are best fit by the shell model, whereas the Cl1604 LCBGs are best fit by the half-shell model. If LCBGs are distributed as a King profile, there is a probability we would detect LCBG in the inner 0.15 Mpc region of MS0451. Therefore, LCBGs do not appear to exist in central cluster regions – in agreement with Homeier et al. (2005) findings for star forming galaxies in Cl0152 (z=0.84).
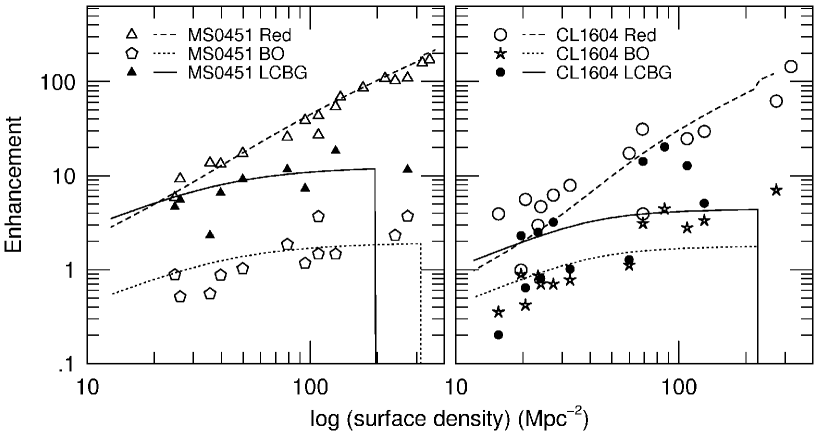
We compare the surface-density of cluster objects to the same objects in the field. Red and BO galaxy field densities are calculated from the luminosity function of the DEEP2 data (Faber et al. 2005). With our selection criteria, the field LCBG surface density derived from the P97 sample yields 1.2 and 5.44 at and , respectively, after applying corrections due to their selection effects. We also use foreground LCBGs in the Cl1604 field to estimate the field density of LCBGs at , and vice versa for MS0451, to find and at and for objects with . Field densities are calculated in the same redshift bin-size and manner as the cluster samples. We couch our comparison between the two objects in terms of “enhancement:” the surface-density ratio of cluster to field. The enhancement as a function of cluster-galaxy surface density (Figure 3) shows red galaxies behave qualitatively as expected according to the morphology-density relationship (Dressler et al. 1997). The BO galaxies show only a modest enhancement and trend with surface density. LCBGs display a larger enhancement, increasing with luminous (M) galaxy surface density, but dropping precipitously at surface densities above 150 Mpc-2.
5 Discussion
We find LCBGs in two intermediate redshift clusters compose a significant fraction of the BO populations despite the clusters’ different redshifts, environments (x-ray luminosities, and projected densities), and relative blue fractions. At lower redshift and greater “richness” (MS0451), there is clear segregation in the surface-densities of sub-populations with red:BO:LCBG = 26.6:12.9:5.4 Mpc-2 within R200. In Cl1604 the different populations have comparable densities (red:BO:LCBG =8.9:15.8:8.5 Mpc-2). At luminous-galaxy surface-densities of 100 Mpc-2, the enhancement of these different sub-populations relative to the field are a factor of 2-4 for BO galaxies, 8-20 for LCBGs, and 30-50 for red galaxies in both clusters. This is suggestive of LCBGs as progenitors of populations found preferentially in clusters today. Because LCBGs show significant enhancement variations between clusters and with surface-density, a secure interpretation of LCBGs as a progenitor population awaits better sampling of environment and redshift. An analysis of 10 clusters between is forthcoming. Here we suggest that since they appear to be physically small, if LCBGs fade, dEs and low-mass S0s would be one plausible remnant population.
Despite their similar spatial distribution, LCBGs are an extreme sub-component of the BO population in terms of their cluster enhancement, color, and surface-brightness. If LCBGs are on predominantly radial orbits, their cluster-shell enhancement indicates initial in-fall – a spectroscopically testable claim. In this scenario, their star-bursts are plausibly triggered through galaxy interactions in the cluster periphery, where densities are enhanced but interaction times still long, or via interactions with the intercluster medium (ICM). The former supposition is testable via angular correlation measurements of large samples. A correlation between the X-ray emission and position of the LCBGs would support an ICM-driven trigger for the star-bursts.
References
- (1)
- (2) Balogh, M. L., Navarro, J. F., & Morris, S. L. 2000, ApJ, 540, 113
- (3) Barton, E. J., & van Zee, L. 2001, ApJ, 550, L35
- (4) Bershady, M. A. 1995, AJ, 109, 87
- (5) Bershady, M. A., Lowenthal, J. D. and Koo, D. C. 1998, ApJ, 505, 50
- (6) Bershady, M. A., Jangren, A., & Conselice, C. J. 2000, AJ, 119, 2645
- (7) Bertin, E. & Arnouts, S. 1996, A&AS, 117, 393
- (8) Biviano, A., Katgert, P., Thomas, T., & Adami, C. 2002, A&A, 387, 8
- (9) Brunner, R. J., & Lubin, L. M. 2000, AJ, 120, 2851
- (10) Butcher, H. & Oemler, A. 1978, ApJ, 226, 559
- (11) Butcher, H. & Oemler, A. 1984, ApJ, 285, 426
- (12) Conselice, C. J., Gallagher, J. S., & Wyse, R. F. G. 2001, ApJ, 559, 791
- (13) Csabai, I., et al. 2003, AJ, 125, 580
- (14) de Lucia, G, et al. 2004, ApJ, 610, L77
- (15) de Propris, R., Stanford, S. A., Eisenhardt, P. R., & Dickinson, M. 2003, ApJ, 598, 20
- (16) Dressler, A. et al. 1997, ApJ, 490, 577
- (17) Donahue, M., Gaskin,J. A., Patel, S. K., Joy, M., Clowe, D., & Hughes, J. P. 2003, ApJ, 598, 190
- (18) Ellingson, E., Yee, H. K. C., Abraham, R. G., Morris, S. L., & Carlberg, R. G. 1998, ApJS, 116, 247
- (19) Ellingson, E., Lin, H., Yee, H. K. C., & Carlberg, R. G. 2001, ApJ, 547, 609
- (20) Faber, S. M., et al. 2005. astro-ph/0506044
- (21) Ferguson, H. C. & Binggeli, B. 1994, A&A Rev., 6, 67
- (22) Finn, R. A., Zaritsky, D., & McCarthy, D. W. 2004, ApJ, 604, 141
- (23) Gal, R. R., & Lubin,L. M. 2004, ApJ, 607, L1
- (24) Garland, C. A., Pisano, D. J., Williams, J. P., Guzmán, R., & Castander, F. J. 2004, ApJ,615, 689
- (25) Goto, T, et al. 2005, ApJ, 621, 188
- (26) Grebel, E. K., Gallagher, J. S., & Harbeck, D. 2003, AJ, 125, 1926
- (27) Graham, A. W., et al. 2005, astro-ph/0504287
- (28) Gunn, J. E. & Stryker, L. L. 1983, ApJS, 52, 121
- (29) Guzman, R., Gallego, J., Koo, D. C., Phillips, A. C., Lowenthal, J. D., Faber, S. M., Illingworth, G. D., & Vogt, N. P. 1997, ApJ, 489, 559
- (30) Hammer, F. , Gruel, N., Thuan, T. X., Flores, H., & Infante, L. 2001, ApJ, 550, 570
- (31) Homeier, N. L., et al. 2005, ApJ, 621, 651
- (32) King, I. R. 1972, ApJ, 174, L123
- (33) Kobulnicky, H. A. & Zaritsky, D. 1999, ApJ, 511, 118.
- (34) Kodama, T., Smail, I., Nakata, F., Okamura, S., & Bower, R. G. 2001, ApJ, 562, L9
- (35) Koo, D. C., Bershady, M. A., Wirth, G. D., Stanford, S. A., & Majewski, S. R. 1994, ApJ, 427, L9.
- (36) Koo, D. C., Guzman, R., Gallego, J., & Wirth, G. D. 1997, ApJ, 478, L49
- (37) Kron, R. G. 1995, in The Deep Universe, ed. B. Bingeli & R. Buser (New York: Springer), 233
- (38) Landolt, A. U. 1992, AJ, 104, 340
- (39) Lotz, J. M., Martin, C. L., & Ferguson, H. C. 2003, ApJ, 596, 143
- (40) Lubin, L. M., Mulchaey, J. S., & Postman, M. 2004, ApJ, 601, L9
- (41) Massey, P., Strobel, 1988, ApJ, 328, 315
- (42) Martin, C. L., Lotz, J., & Ferguson, H. C. 2000, ApJ, 543, 97
- (43) Oemler, A. J., Dressler, A., & Butcher, H. R. 1997, ApJ, 474, 561
- (44) Phillips, A. C., Guzman, R., Gallego, J., Koo, D. C., Lowenthal, J. D., Vogt, N. P., Faber, S. M., & Illingworth, G. D. 1997, ApJ, 489, 543 (P97)
- (45) Poggianti, B. M., et al. 2001, ApJ, 562, 689
- (46) Postman, M., Lubin, L. M., & Oke, J. B. 2001, AJ, 122, 1125
- (47) Rakos, K. D., & Schombert, J. M. 1995, ApJ, 439, 47
- (48) Tran, K. H., van Dokkum, P., Illingworth, G. D., Kelson, D., Gonzalez, A., & Franx, M. 2005, ApJ, 619, 134
- (49) Werk, J. K., Jangren, A., & Salzer, J. J. 2004, ApJ, 617, 100
- (50)
| Cluster | RA | DEC | z | aa is measured in the 0.3-3.5 keV and 0.5-2.0 keV bands, respectively, for MS0451 and Cl1604. | bb is the radius where the cluster density is 200 times the critical density (Finn et al. 2004). | ||
|---|---|---|---|---|---|---|---|
| J2000 | J2000 | (km s-1) | (erg s-1) | (Mpc) | (Mpc) | ||
| MS0451 | 04:54:10.8 | -03:00:56 | 0.538 | 1354 | 1.4 | 0.18 | 1.64 |
| Cl1604 | 16:04:18.2 | +43:04:38 | 0.90 | 982 | 8.6 | 0.14 | 1.48 |