The Sloan Lens ACS Survey. I. A Large Spectroscopically Selected Sample of Massive Early-Type Lens Galaxies11affiliation: Based on data from the Sloan Digital Sky Survey, the 6.5-m Walter Baade (Magellan-I) Telescope, the 8-m Gemini-North Telescope, and the Hubble Space Telescope. See full acknowledgement at end.
Abstract
The Sloan Lens ACS (SLACS) Survey is an efficient Hubble Space Telescope (HST) Snapshot imaging survey for new galaxy-scale strong gravitational lenses. The targeted lens candidates are selected spectroscopically from within the Sloan Digital Sky Survey (SDSS) database of galaxy spectra for having multiple nebular emission lines at a redshift significantly higher than that of the SDSS target galaxy. The SLACS survey is optimized to detect bright early-type lens galaxies with faint lensed sources, in order to increase the sample of known gravitational lenses suitable for detailed lensing, photometric, and dynamical modeling. In this paper, the first in a series on the current results of our HST Cycle–13 imaging survey, we present a catalog of 19 newly discovered gravitational lenses, along with 9 other observed candidate systems that are either possible lenses, non-lenses, or non-detections. The survey efficiency is thus %. We also present Gemini 8m and Magellan 6.5m integral-field spectroscopic data for 9 of the SLACS targets, which further support the lensing interpretation. A new method for the effective subtraction of foreground galaxy images to reveal faint background features is presented. We show that the SLACS lens galaxies have colors and ellipticities typical of the spectroscopic parent sample from which they are drawn (SDSS luminous red galaxies and quiescent main-sample galaxies), but are somewhat brighter and more centrally concentrated. Several explanations for the latter bias are suggested. The SLACS survey provides the first statistically significant and homogeneously selected sample of bright early-type lens galaxies, furnishing a powerful probe of the structure of early-type galaxies within the half-light radius. The high confirmation rate of lenses in the SLACS survey suggests consideration of spectroscopic lens discovery as an explicit science goal of future spectroscopic galaxy surveys.
Subject headings:
gravitational lensing — galaxies: elliptical and lenticular, cD — galaxies: evolution — galaxies: formation — galaxies: structure1. INTRODUCTION
In the currently favored cosmological scenario, the matter content of the universe is dominated by a cold and dark component of unknown particle species whose only significant interaction with the smaller baryonic matter fraction occurs through the gravitational force. This “cold dark matter” (CDM) picture is most strongly required by observations on the largest scales (Spergel et al., 2003; Tegmark et al., 2004; Percival et al., 2002). The CDM scenario holds that galaxies form within the potential wells of extended dark-matter halos which began their collapse while baryonic matter was still ionized (White & Rees, 1978; Blumenthal et al., 1984). This view is supported by direct evidence for dark matter in disk galaxies from the observation of rotational velocities that remain approximately constant out to radii at which the stellar galactic component makes a diminishing contribution (e.g. Rubin et al., 1980; van Albada & Sancisi, 1986).
Unlike disk galaxies, early-type galaxies (E and S0) are generally pressure supported and lack bright kinematic tracers at large radii such as HI. As such their kinematics are more difficult to measure and interpret in terms of mass density profiles. The density structure of early-type galaxies is nevertheless of great interest for numerous reasons. First, their structure is the “fossil record” of their formation and evolution processes (e.g. Wechsler et al., 2002; Zhao et al., 2003; Loeb & Peebles, 2003; Gao et al., 2004). Hierarchical CDM galaxy-formation theories hold that early-type galaxies are built through the merging of late-types (Kauffmann, White, & Guiderdoni, 1993; Baugh, Cole, & Frenk, 1996), which should have predictable consequences for the structure of the merger products. The most stringent test of these theories will require precise observational measurements of early-type mass profiles. For example, detailed measurement of the structure of high-surface-brightness early-type galaxies will enable quantitative tests of the CDM theory on scales where baryonic and radiative processes have significant effects upon the structure of the host dark-matter halo (e.g. through “adiabatic contraction”, e.g. Flores et al., 1993; Blumenthal et al., 1986; Mo et al., 1998; Gnedin et al., 2004), altering it significantly relative to the form expected to result from pure collisionless dark-matter collapse (e.g. Navarro et al., 1996; Moore et al., 1998). Second, early-type galaxies exhibit great regularity in their photometric, spectroscopic, and kinematic properties, as described, e.g., by the well-known Fundamental Plane (FP) relation between velocity dispersion, effective radius, and surface brightness (Djorgovski & Davis, 1987; Dressler et al., 1987). The “tilt” of the FP relative to the simple expectation of the virial theorem can be understood in terms of a dependence of galaxy structure and mass-to-light ratio on total galaxy mass (Bender et al., 1992; Ciotti et al., 1996; Bertin et al., 2002; Trujillo et al., 2004). However, further constraints on the mass structure of early-type galaxies are needed in order to distinguish between the various effects of differing stellar populations (the explanation given by, e.g., Gerhard et al. 2001), differing density profiles (“structural nonhomology” or “weak homology”), and differing dark-matter fractions (the explanation of, e.g., Padmanabhan et al. 2004) in giving rise to the FP.
Despite great progress, observational results remain uncertain because of the small number of individual galaxies suitable for study. Stellar-dynamical measurements of local early-type galaxies (e.g. Bertin et al., 1994; Franx et al., 1994; Gerhard et al., 2001; Cappellari et al., 2005), the statistics of early-type gravitational-lens galaxies (e.g. Kochanek, 1996; Chae, 2003; Rusin et al., 2003; Rusin & Kochanek, 2005), and combined lensing and dynamical measurements of the few systems amenable to such study (Koopmans & Treu, 2002, 2003; Treu & Koopmans, 2002, 2003, 2004, hereafter KT) generally argue for the presence of a significant amount of dark matter even on the scale of the half-light radius, leading to an approximately linear increase of enclosed mass with radius and thus to a flat equivalent rotation curve as in disk galaxies. However, in some cases the presence of dark matter is not required, and the observed kinematics can be reproduced with a constant mass-to-light ratio (e.g. Bertin et al., 1994; Romanowsky et al., 2003), corresponding to a declining rotation curve. Furthermore, Kochanek (2003) has pointed out an apparent conflict between isothermal mass profiles (i.e. flat rotation curves) and some gravitational-lens time delays under the assumption of 70 km s-1 Mpc-1. Due to this persistent uncertainty about the structure and diversity of early-type galaxies (see also Kochanek, 2004), it is important to collect precision data for a larger number of objects, possibly spanning a large range of redshifts, environments, and mass.
Strong gravitational lensing provides the most direct probe of mass in early-type galaxies: a measurement of the mass enclosed within the Einstein radius. When combined with a spatially resolved measurement of the line-of-sight velocity-dispersion profile and the surface brightness of the lens galaxy, this mass measurement can be used to constrain the luminous and dark-matter mass profiles simultaneously through the Jeans equation (e.g. KT). Unfortunately, only a handful of known strong lenses are amenable to this type of analysis, often because the back-ground source is a bright QSO whose images outshine the lens galaxy.
We have therefore initiated the Sloan Lens ACS (SLACS) Survey (see Bolton et al., 2005) to discover a much larger sample of new early-type strong gravitational lenses suitable for detailed photometric and dynamical study and thereby realize the full potential of gravitational lensing as a probe of early-type galaxy structure. SLACS uses the method described by Bolton et al. (2004, hereafter B04) to select candidate galaxy-scale gravitational lens systems from within the Sloan Digital Sky Survey (SDSS) spectroscopic database on the basis of multiple higher-redshift emission lines in the spectrum of lower-redshift target galaxies. For discussion of other spectroscopic lens surveys and lens discoveries based on the identification of anomalous emission lines, see Huchra et al. 1985; Warren et al. 1996, 1998, 1999; Willis 2000; Hall et al. 2000; Hewett et al. 2000; Johnston et al. 2003; Willis et al. 2005. The SDSS data also provide stellar velocity dispersion measurements for all SLACS lens candidates. The most promising candidates (see § 2.1) are observed through F435W and F814W using the Advanced Camera for Surveys (ACS) aboard the Hubble Space Telescope (HST). ACS images enable us to confirm bona fide lenses, measure detailed photometric and morphological parameters of the lensing galaxies, and obtain accurate astrometry and surface-brightness measurements of strongly lensed features with which to constrain gravitational-lens models. Finally, confirmed lenses from the program are being targeted for deep ground-based spectroscopy in order to obtain spatially resolved velocity-dispersion profiles of the lensing galaxies, which will provide more precise dynamical constraints on their mass structure.
This paper (Paper I) is the first in a series presenting the results of the current Cycle–13 HST imaging component of the SLACS Survey. This paper presents the catalog of new lenses confirmed by the SLACS HST-ACS Snapshot Survey and their properties as measured by SDSS, describes our methods of image processing and lens-galaxy image subtraction, and provides an analysis of the possible selection biases that bear upon whether or not our lenses are a representative sample of similar SDSS early-type galaxies. We also present ground-based integral-field spectroscopy of several SLACS systems which supports a strong-lensing interpretation of the observed features. Paper II presents photometric and morphological measurements of the SLACS lens sample from (HST) imaging and places the sample within the context of the FP, Paper III presents gravitational-lens and dynamical modeling results, and Paper IV focuses on the properties of the lensed source galaxies.
The outline of this paper is as follows: In § 2, the survey selection procedure and the available data of each system is described. In § 3, nineteen newly discovered lens systems and nine unconfirmed systems or non-detections are presented. In § 4, the statistics and possible selection effects of the sample are discussed. § 5 discusses some of the implications of the SLACS survey for future surveys and in § 6 conclusions are drawn and future work is discussed. Throughout this paper, we assume a cosmological model with , , and km s-1 Mpc-1 (with ).
2. THE SURVEY
| System Name | Plate-MJD-Fiber | () | (km s-1) | Sample | Lens | |||
|---|---|---|---|---|---|---|---|---|
| SDSS J003753.21094220.1 | 0655-52162-392 | 18.00,16.81,16.39 | 0.1954 | 0.6322 | LRG | Yes | ||
| SDSS J021652.54081345.3 | 0668-52162-428 | 19.07,17.46,16.90 | 0.3317 | 0.5235 | LRG | Yes | ||
| SDSS J073728.45321618.5 | 0541-51959-145 | 19.38,17.84,17.15 | 0.3223 | 0.5812 | LRG | Yes | ||
| SDSS J081931.92453444.8 | 0441-51868-108 | 18.63,17.51,17.07 | 0.1943 | 0.4462 | MAIN | ? | ||
| SDSS J091205.30002901.1 | 0472-51955-429 | 17.31,16.22,15.78 | 0.1642 | 0.3239 | LRG | Yes | ||
| SDSS J095320.42520543.7 | 0902-52409-577 | 18.57,17.61,17.22 | 0.1310 | 0.4670 | MAIN | ? | ||
| SDSS J095629.77510006.6 | 0902-52409-068 | 18.41,17.17,16.62 | 0.2405 | 0.4700 | LRG | Yes | ||
| SDSS J095944.07041017.0 | 0572-52289-495 | 18.52,17.48,17.02 | 0.1260 | 0.5350 | MAIN | Yes | ||
| SDSS J102551.31003517.4 | 0272-51941-151 | 17.07,16.03,15.57 | 0.1589 | 0.2764 | LRG | ? | ||
| SDSS J111739.60053413.9 | 0835-52326-571 | 18.72,17.56,17.12 | 0.2285 | 0.8232 | MAIN | ? | ||
| SDSS J120540.43491029.3 | 0969-52442-134 | 18.40,17.22,16.65 | 0.2150 | 0.4808 | MAIN | Yes | ||
| SDSS J125028.25052349.0 | 0847-52426-549 | 18.40,17.26,16.77 | 0.2318 | 0.7946 | MAIN | Yes | ||
| SDSS J125135.70020805.1 | 0337-51997-480 | 18.58,17.59,17.24 | 0.2243 | 0.7843 | MAIN | Yes | ||
| SDSS J125919.05613408.6 | 0783-52325-279 | 18.80,17.46,17.01 | 0.2333 | 0.4488 | LRG | ? | ||
| SDSS J133045.53014841.6 | 0910-52377-503 | 18.34,17.45,17.05 | 0.0808 | 0.7115 | MAIN | Yes | ||
| SDSS J140228.21632133.5 | 0605-52353-503 | 18.26,16.98,16.49 | 0.2046 | 0.4814 | LRG | Yes | ||
| SDSS J142015.85601914.8 | 0788-52338-605 | 16.39,15.56,15.17 | 0.0629 | 0.5350 | MAIN | Yes | ||
| SDSS J154731.22572000.0 | 0617-52072-561 | 17.94,16.84,16.39 | 0.1883 | 0.3955 | LRG | ? | ||
| SDSS J161843.10435327.4 | 0815-52374-337 | 18.78,17.60,17.09 | 0.1989 | 0.6656 | MAIN | Yes | ||
| SDSS J162746.44005357.5 | 0364-52000-084 | 18.54,17.29,16.89 | 0.2076 | 0.5241 | LRG | Yes | ||
| SDSS J163028.15452036.2 | 0626-52057-518 | 18.84,17.41,16.92 | 0.2479 | 0.7933 | LRG | Yes | ||
| SDSS J163602.61470729.5 | 0627-52144-464 | 18.92,17.68,17.18 | 0.2282 | 0.6745 | MAIN | ? | ||
| SDSS J170216.76332044.7 | 0973-52426-464 | 18.01,16.91,16.40 | 0.1784 | 0.4357 | LRG | ? | ||
| SDSS J171837.39642452.2 | 0352-51789-563 | 16.86,15.97,15.54 | 0.0899 | 0.7367 | MAIN | Yes | ||
| SDSS J230053.14002237.9 | 0677-52606-520 | 18.97,17.63,17.14 | 0.2285 | 0.4635 | LRG | Yes | ||
| SDSS J230321.72142217.9 | 0743-52262-304 | 17.58,16.39,15.96 | 0.1553 | 0.5170 | LRG | Yes | ||
| SDSS J232120.93093910.2 | 0645-52203-517 | 16.07,15.21,14.82 | 0.0819 | 0.5324 | MAIN | Yes | ||
| SDSS J234728.08000521.2 | 0684-52523-311 | 19.81,18.51,17.95 | 0.4168 | 0.7145 | LRG | ? |
Note. — System Name gives truncated J2000 RA and Dec in the format HHMMSS.ssDDMMSS.s. De Vaucouleurs model SDSS (AB) magnitudes have been de-reddened using dust maps from Schlegel, Finkbeiner, & Davis (1998), and have statistical errors of appproximately 0.01. De Vaucouleurs effective radii are quoted at the intermediate axis. Parent Sample column indicates whether candidate was selected from the SDSS luminous red galaxy sample or from the SDSS main galaxy sample (see § 2.1).
2.1. Candidate Selection
The method by which we select our lens candidates is essentially that described by B04. Briefly, we subtract best-fit PCA templates (a byproduct of the redshift pipeline) from the observed SDSS target-galaxy spectra. We require the SDSS continuum to be well-fit by the template, which effectively yields a parent sample of galaxies with well-behaved absorption-dominated spectra and very secure redshifts, which we denote (for “foreground”). The residual spectra are then scanned for nebular line emission at redshifts greater than . Spectra in which such emission is significantly detected for at least three separate common atomic transitions at a single background redshift () are taken as lens candidates for having emission at two different redshifts along the same line of sight as sampled by the 3-arcsec diameter SDSS spectroscopic fiber.
Taking , , and the measured stellar velocity dispersion from SDSS allows us to determine to first order the strong-lensing cross section for each system in the source plane – using a singular isothermal sphere (SIS) model – as , with the Einstein radius given by . In the image plane the region of multiple imaging is four times larger than the source-plane strong-lensing cross section, in the sense that all images within a radius of the potential center will show strongly-lensed counterimages. To maximize the number of strong lenses in our survey, we formed our Cycle–13 HST target list from the candidates with the highest predicted lensing cross section. Thus our HST target sample is velocity-dispersion selected to leading order, with an additional selection bias in favor of systems with larger angular-diameter distance ratios (a function of the redshifts and ). We take 20 of our targets from the list of lens candidates published in B04, which were selected from within the luminous red galaxy spectroscopic sample of the SDSS (LRG, Eisenstein et al., 2001). The LRG sample is defined by photometric selection cuts that very efficiently select massive early-type galaxies in the redshift range , as confirmed by SDSS spectroscopy. These galaxies are very homogeneous in their spectral, photometric, and morphological properties, and we place no further requirements on our LRG-sample lens candidates beyond their photometric selection as described in Eisenstein et al. (2001) and subsequent spectroscopic confirmation as galaxies with redshifts . The remaining 29 targets on our Snapshot list are selected with the same spectroscopic algorithm from within the MAIN galaxy sample of the SDSS (Strauss et al., 2002). The MAIN sample is much more heterogeneous, and we impose a quiescent, absorption-dominated spectral criterion by requiring our lens candidates to have rest-frame equivalent widths in H of 1.5 Å (with a few exceptions made in the interest of maximizing the total number discovered lenses in the program: see SDSSJ1251-0208 below.). Although most of the systems we target do indeed exhibit early-type morphology, the selection of SLACS lens candidates from within the LRG and MAIN galaxy samples of the SDSS is purely spectroscopic.
2.2. ACS Image Processing
Our ACS Snapshot observing strategy is discussed in Bolton et al. (2005), and consists of one 420s Wide-Field Channel (WFC) exposure through each of the two filters F435W and F814W. The SLACS lens candidates are selected to yield bright lenses with faint background sources. This facilitates the photometric, morphological, and kinematic study of the lens galaxy, but can also make the relatively faint lensed features difficult to detect and even more difficult to use in lens modeling. The key to success is effective subtraction of the image of the lens galaxy by fitting a smooth model to the image data of the candidate lens galaxy (e.g. Peng et al., 2002; Simard, 1998). Given the extremely regular isophotal structure of most early-type galaxies, this is a reasonable proposition. The most common parameterized model for early-type brightness distributions is the generalized de Vaucouleurs or Sérsic law (Sersic, 1968; Ciotti, 1991). We first attempted to use elliptical Sérsic model-fitting and subtraction in our analysis, but generally found that the global systematic residuals of the fit were large compared to the surface-brightness levels of the lensed features that we hope to use to constrain gravitational-lens models. Significant galaxy-core residuals are especially pronounced in the Sérsic-subtracted F814W data. The shortcomings of the Sérsic model led us to implement a more generalized galaxy-model fitting procedure involving a b-spline fit to the radial profile with a low-order multipole dependence to fit the angular structure, which we describe in Appendix A.
3. NEW LENSES AND OTHER OBSERVED SYSTEMS
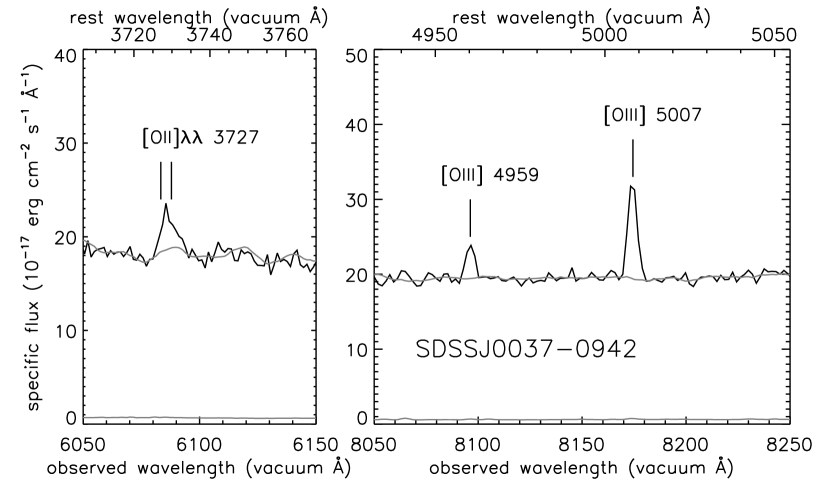
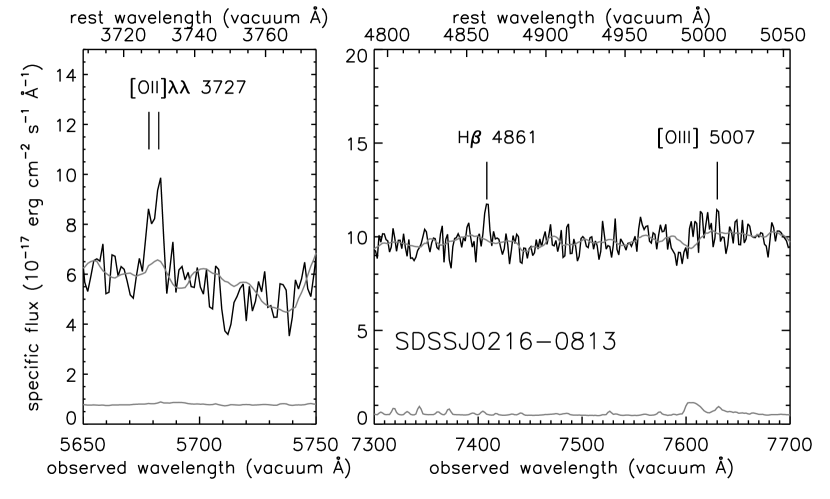
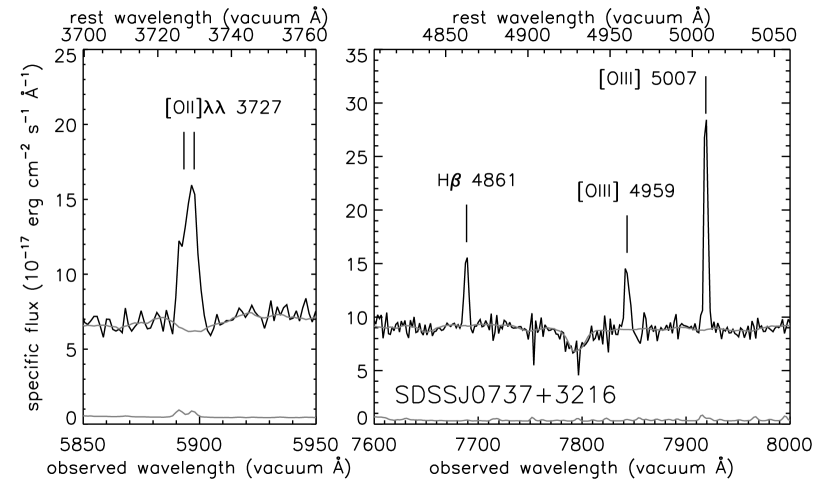
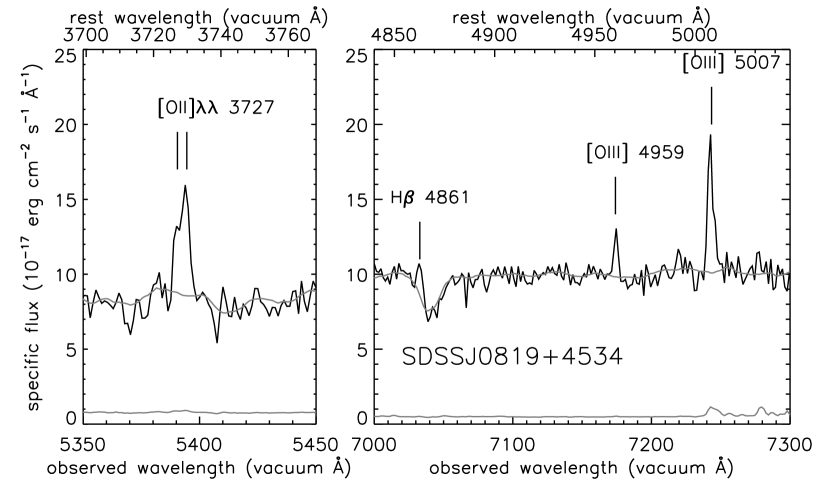
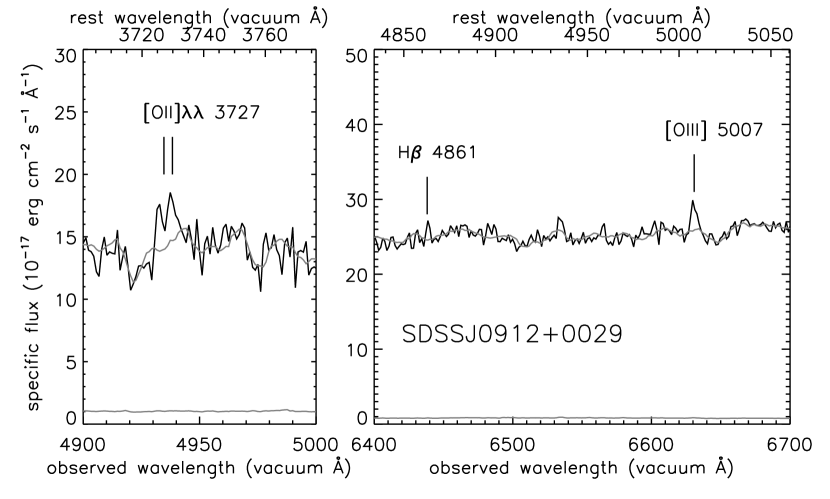
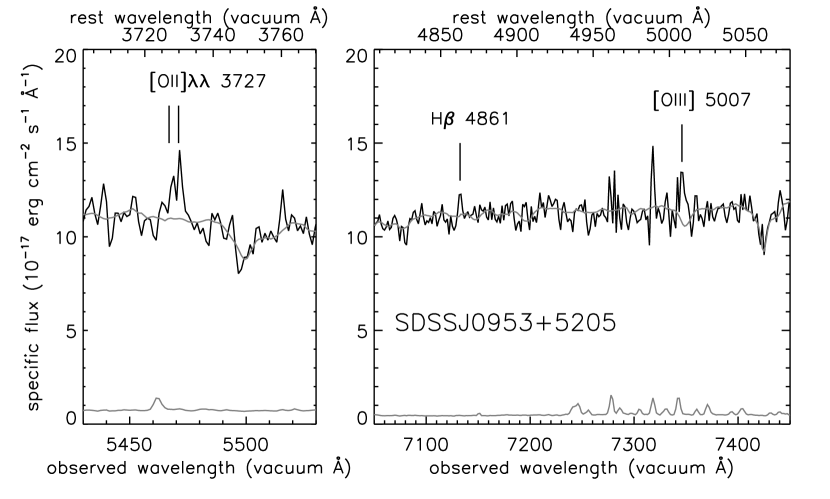
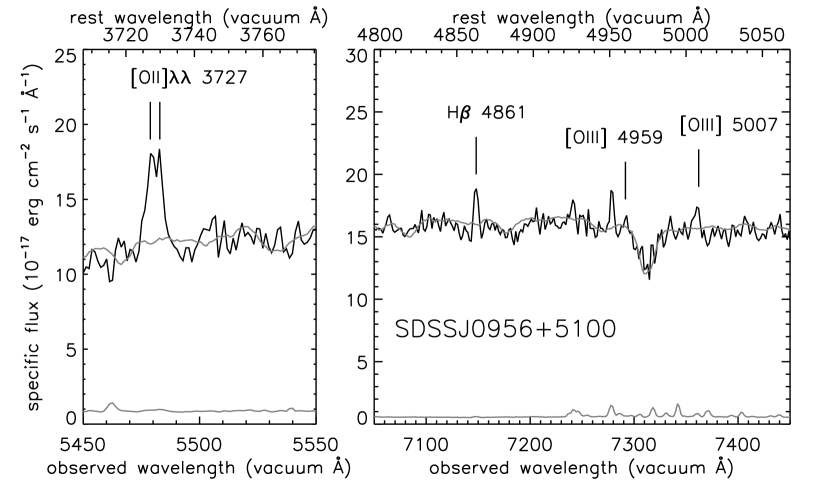
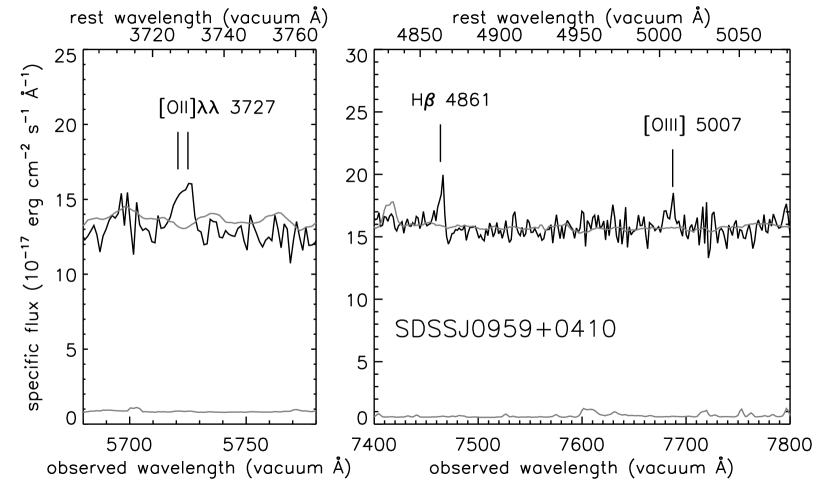
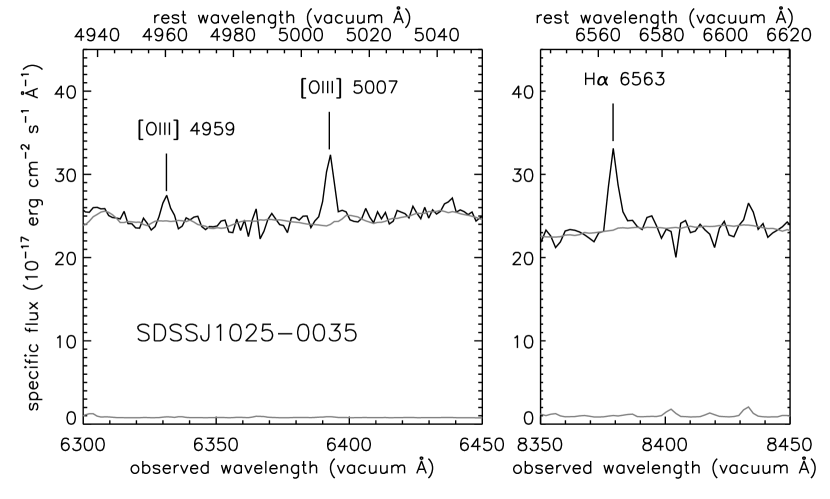
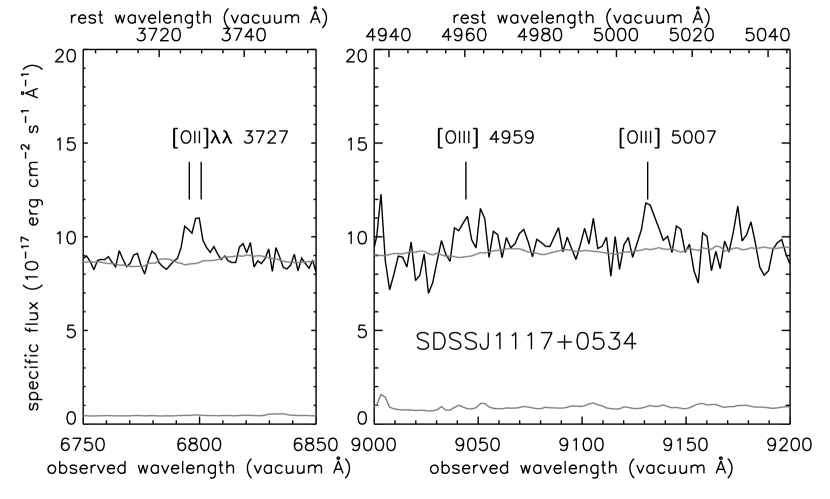
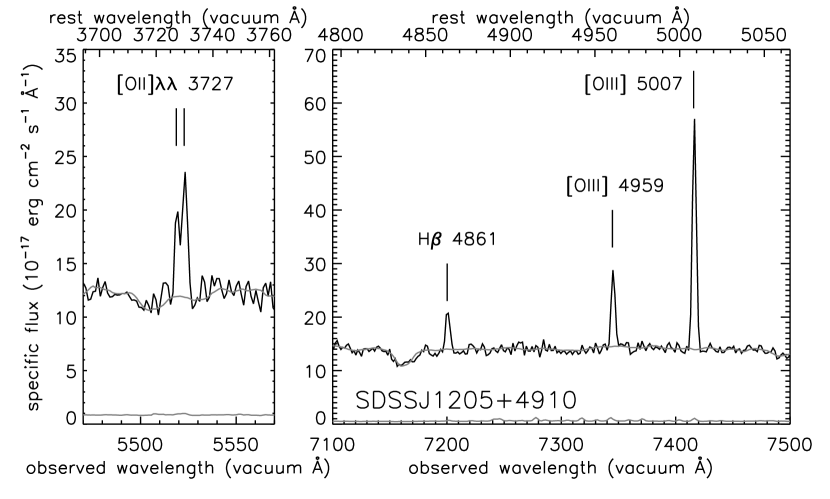
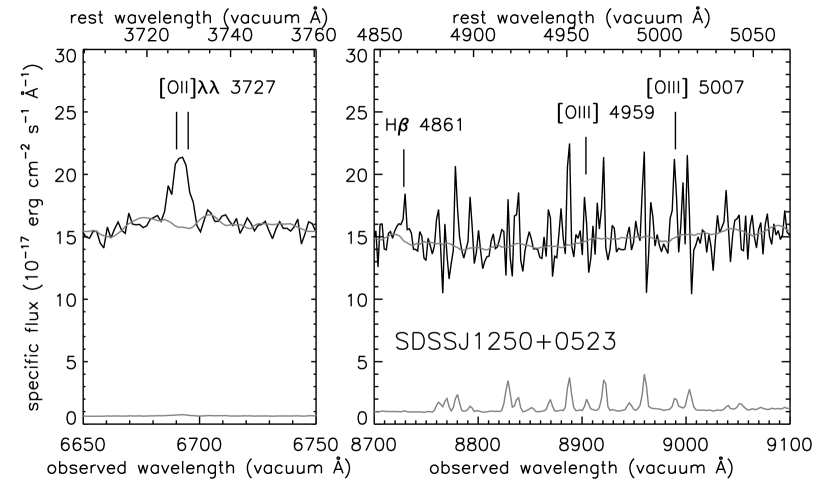
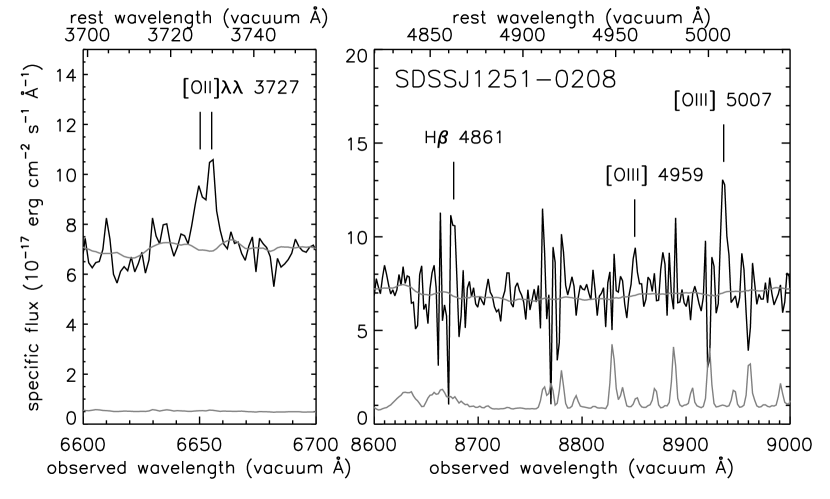
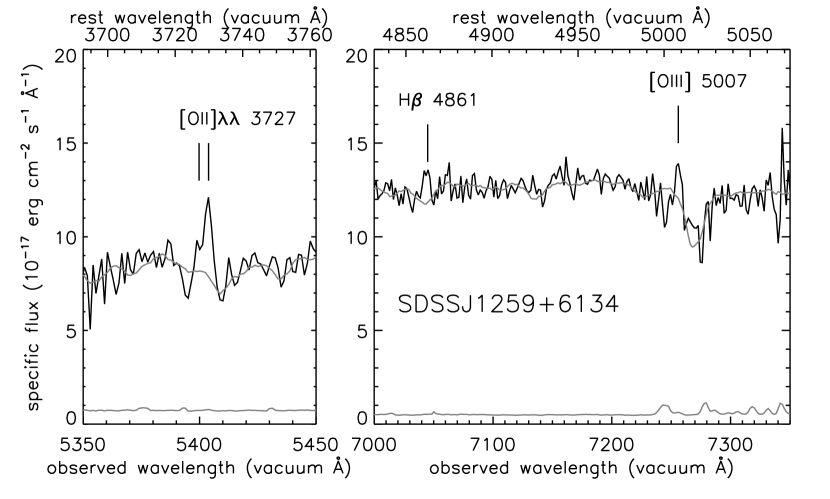
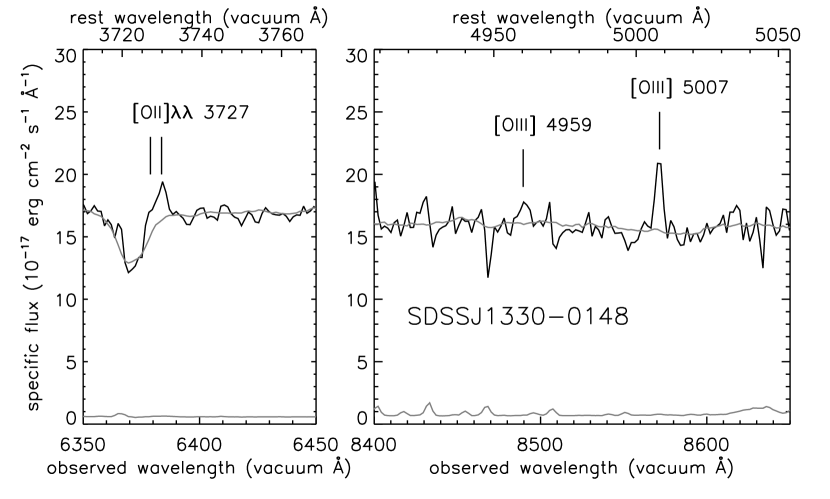
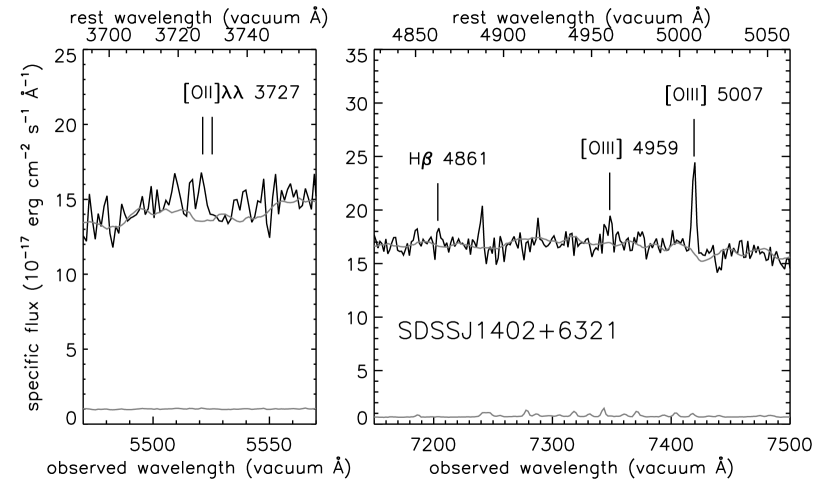
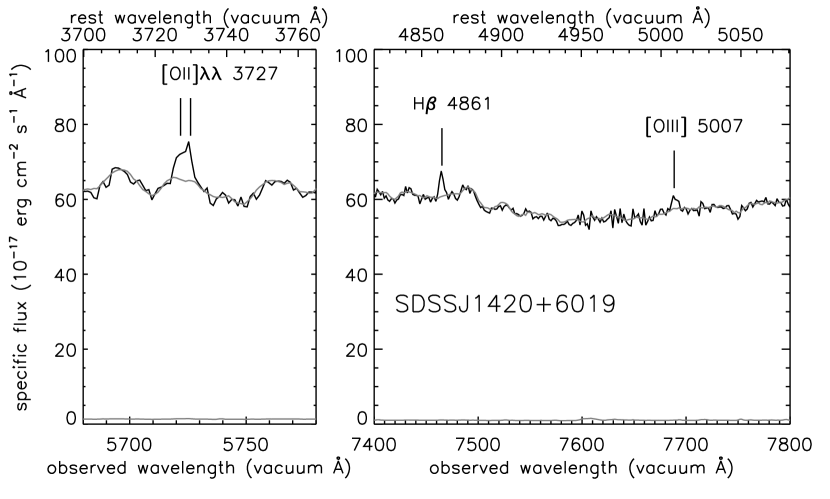
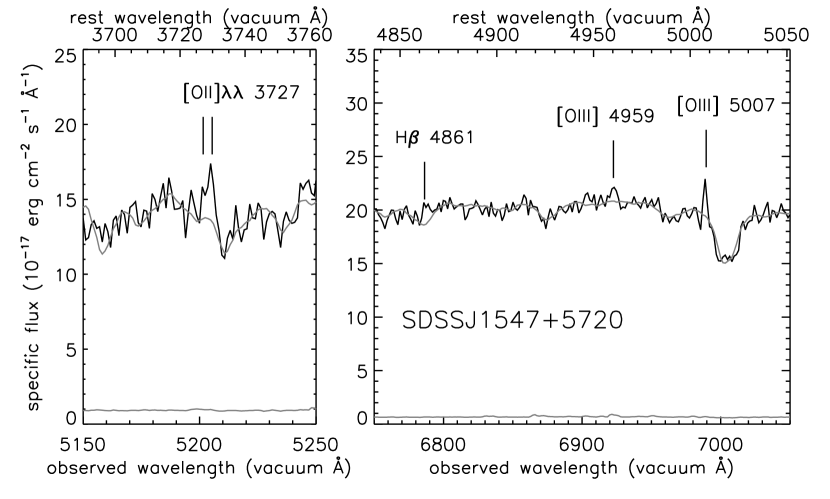
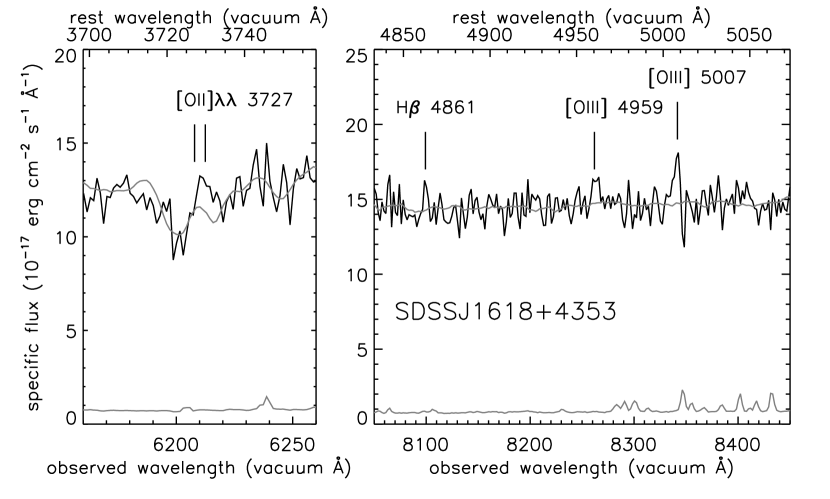
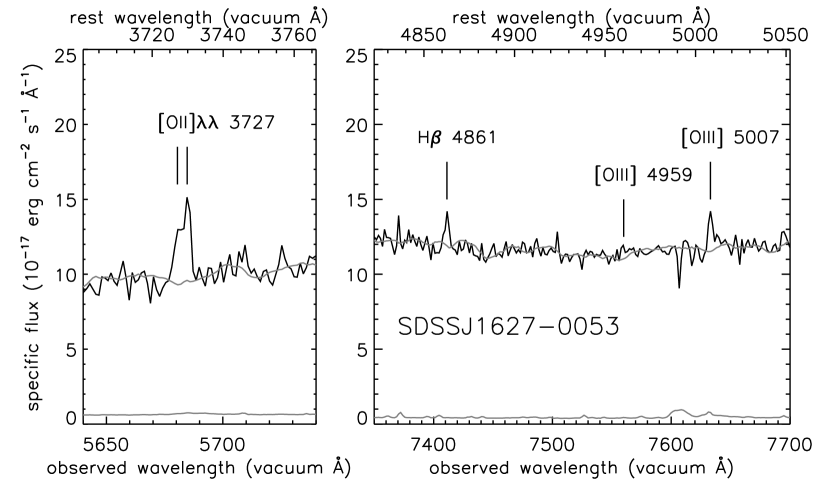
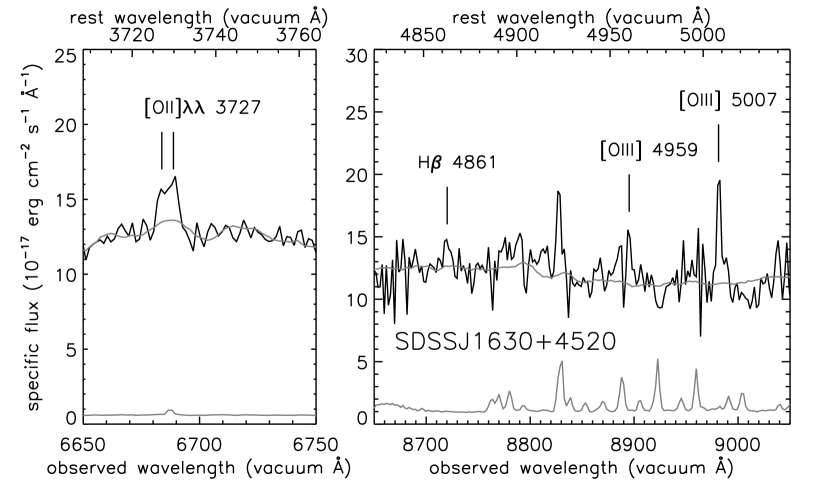
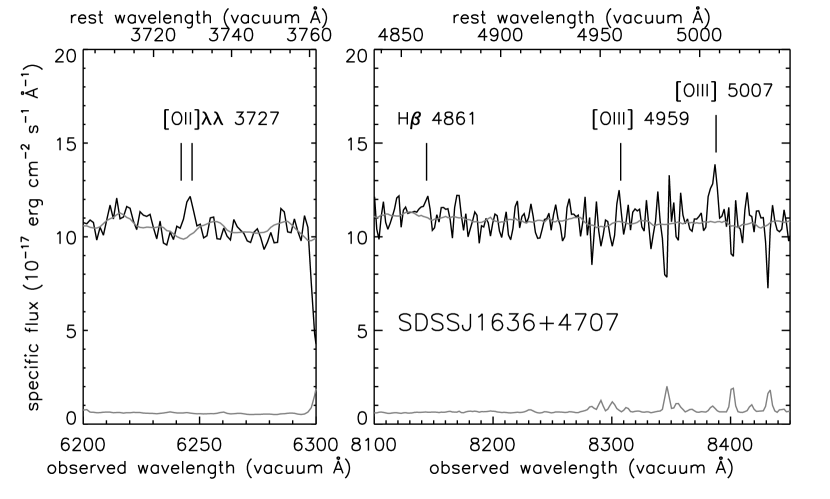
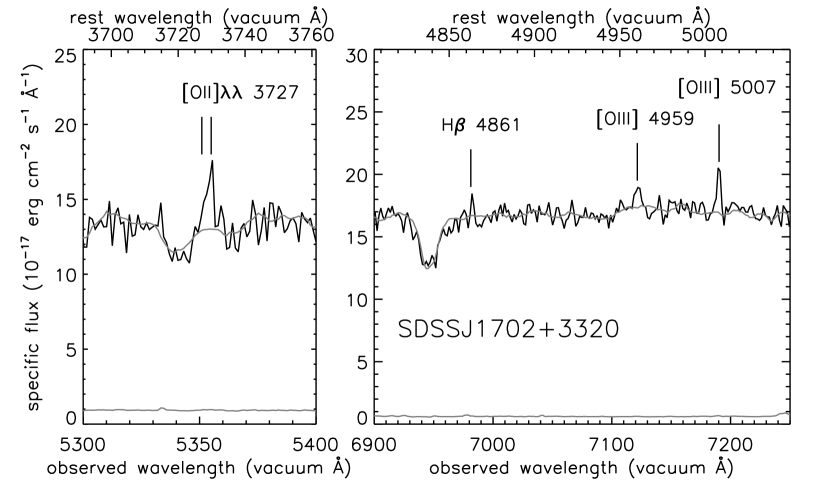
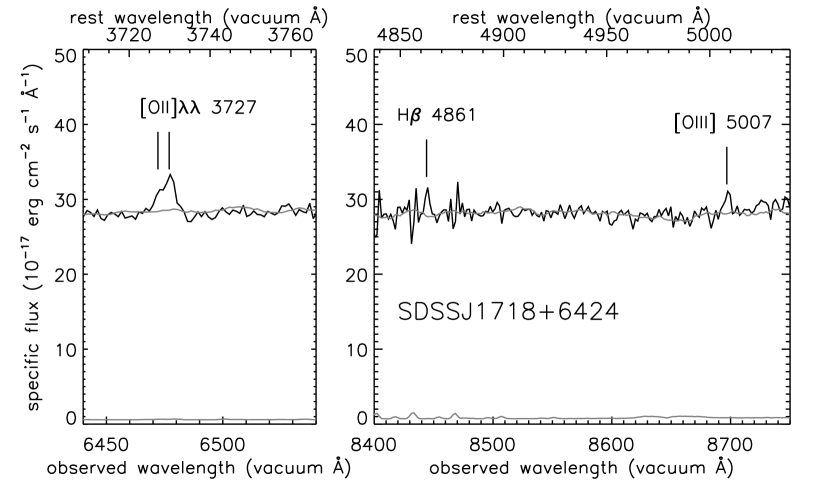
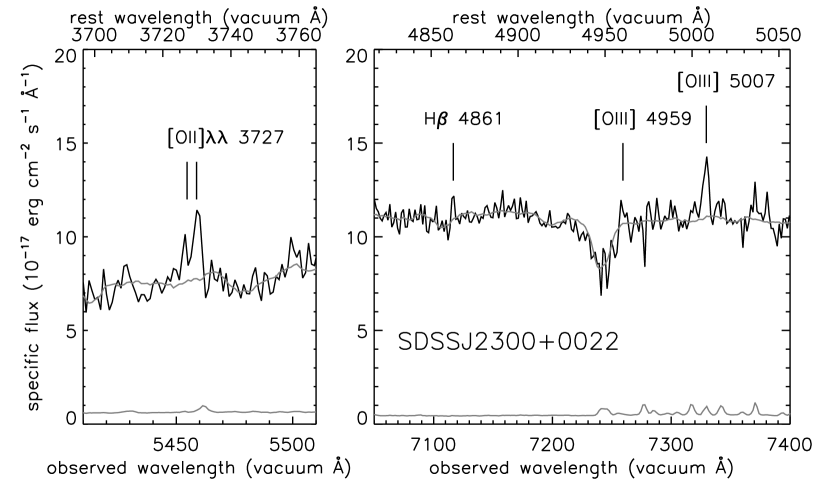
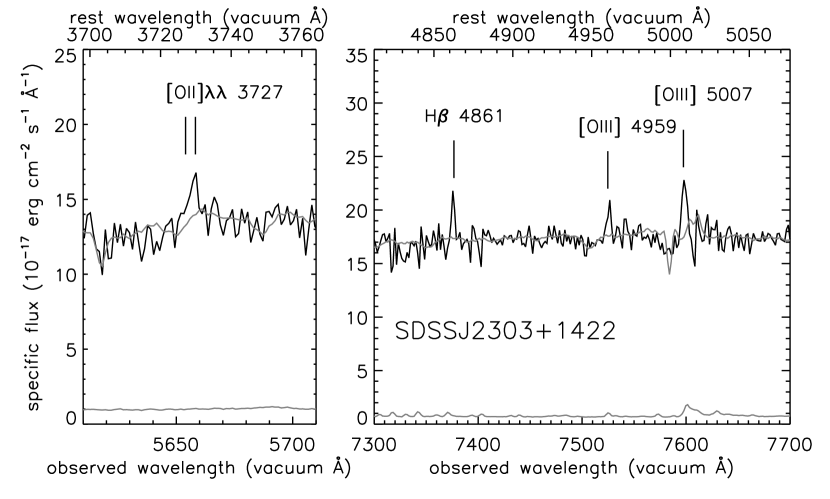
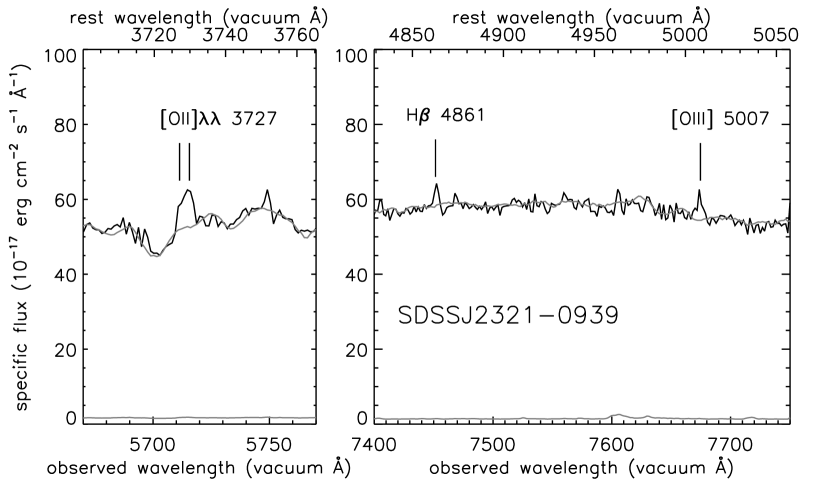
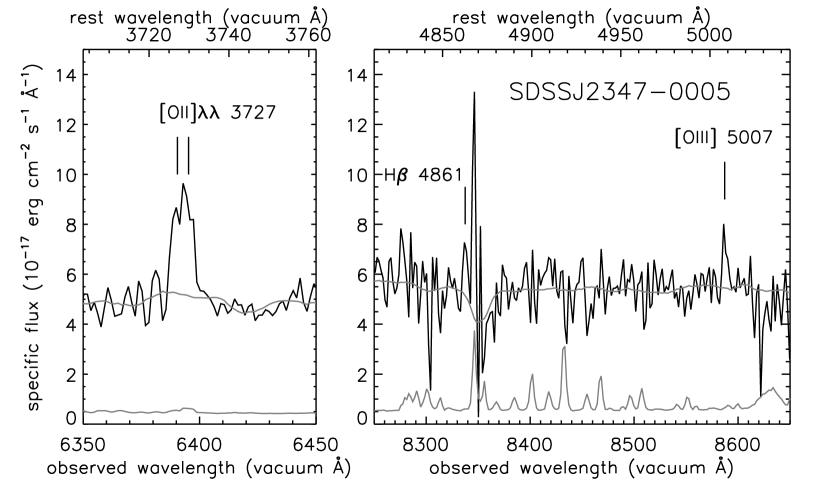
Here we present the catalog of 28 candidate lens systems111The Cycle–13 program is still ongoing and another 11 systems have been observed, with 9 more being scheduled. observed by the SLACS survey through 2005 March 22. Photometric and spectroscopic parameters for the sample as measured by SDSS are given in Table 1. Figure 1 presents the SDSS discovery spectra of all targeted systems, focused on the background-redshift line emission. For definiteness, we enumerate the several possible explanations for any one of our spectroscopically selected lens candidates as follows: (1) a multiply imaged background galaxy (“strong lens”), (2) a singly imaged though possibly magnified background galaxy (a “non-lens” in our classification), (3) a multiple-image system corresponding to a projection of multiple singly imaged sources with similar colors, and (4) spurious noise features in the SDSS spectrum. Given the adopted significance threshold for selection and the careful treatment of the noise properties of SDSS spectra (B04), we expect (4) to be an unlikely explanation, though it merits consideration in the case of any lower signal-to-noise candidates that do not produce detections in follow-up observations. Systems falling into category (3) could in principle be mistaken for bona fide strong lenses, but can be expected to have ill-fitting lens models, since real lenses occupy only a small subspace of all conceivable image configurations. For simplicity, this paper only categorizes ACS-observed systems into “strong lenses” on one hand and “everything else” on the other, with “everything else” including systems for which a definitive explanation cannot be made based on the data in hand (i.e. ACS non-detections).
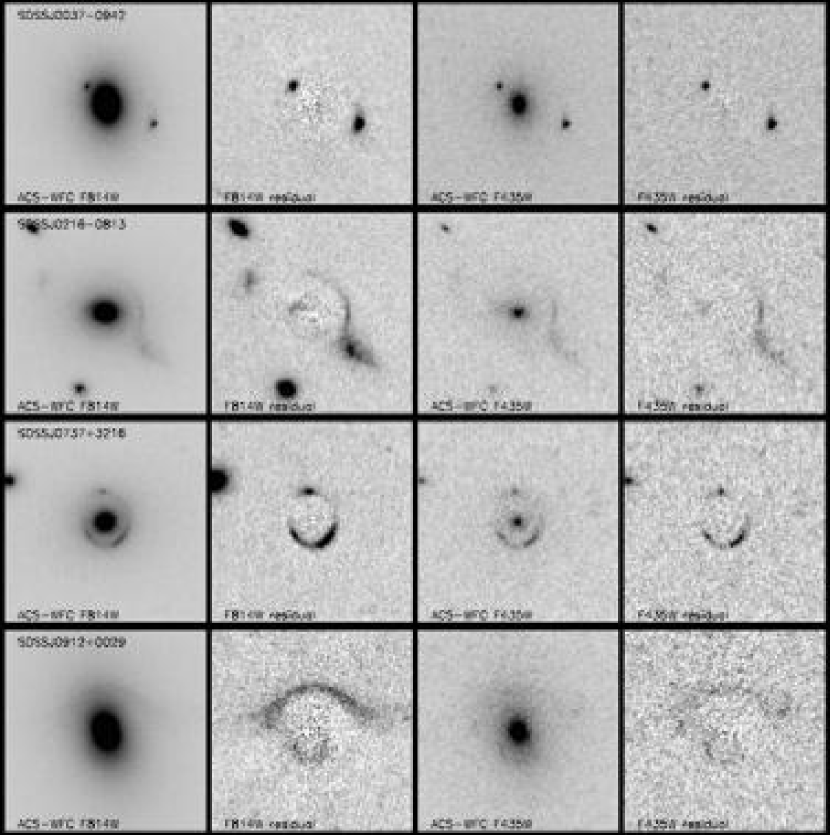
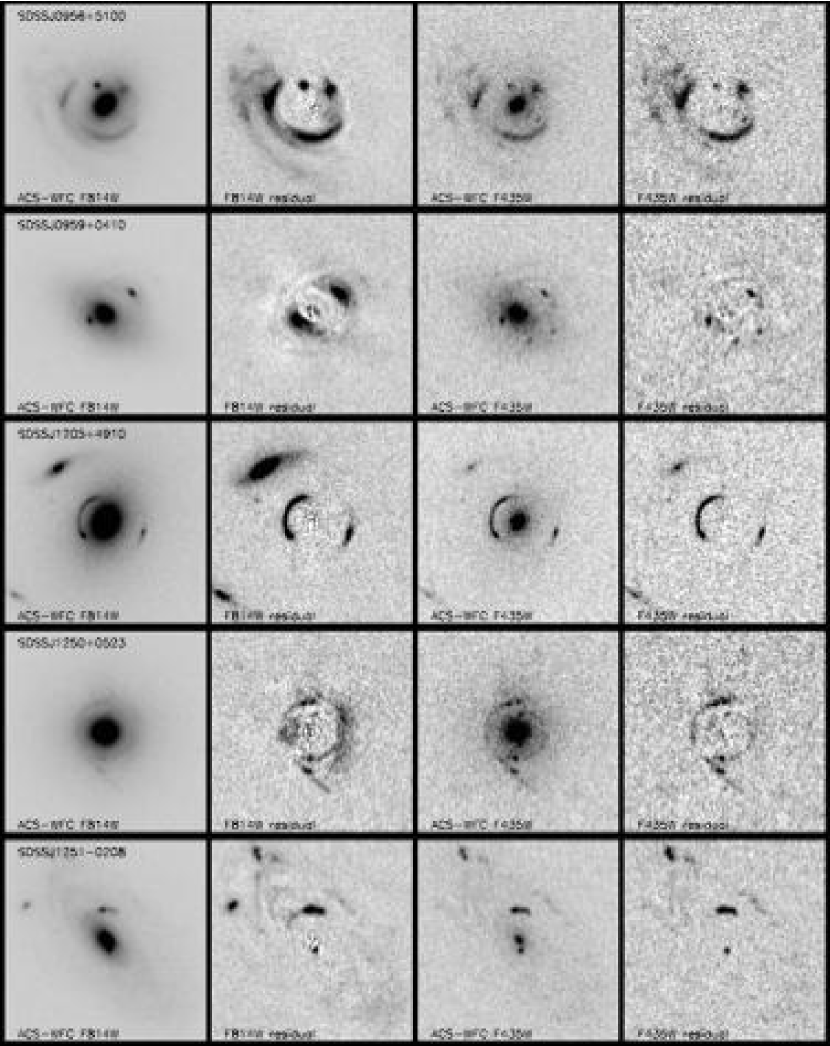
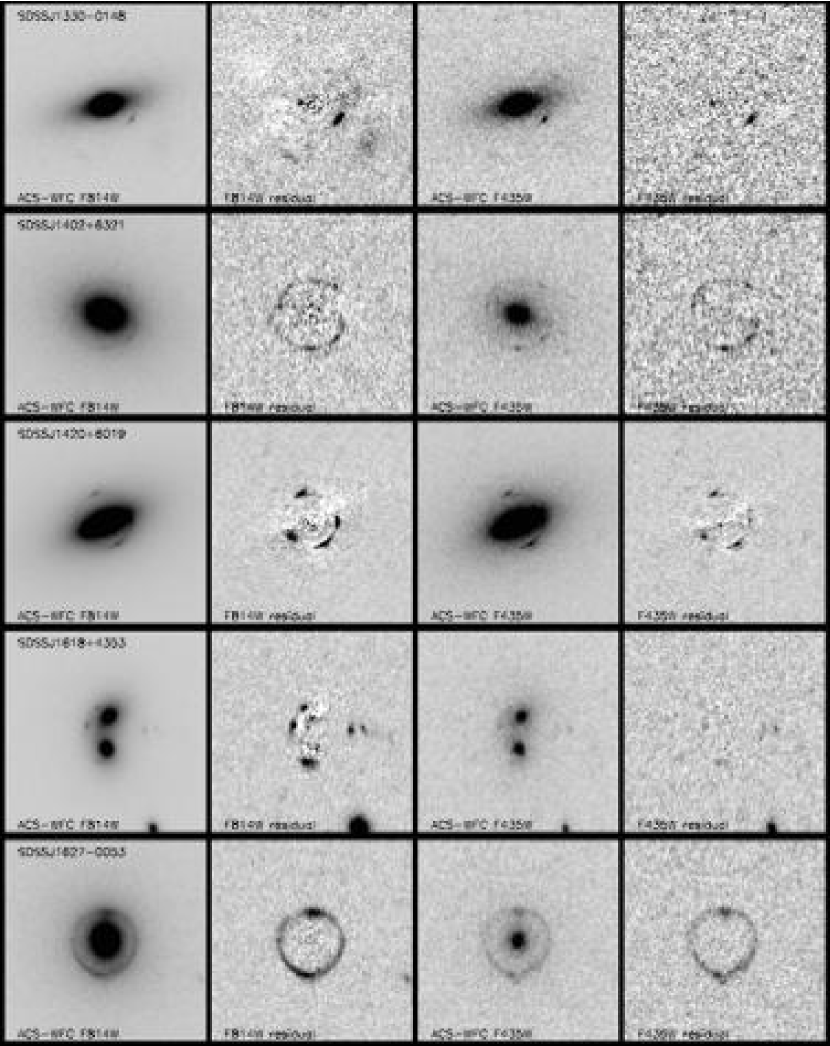
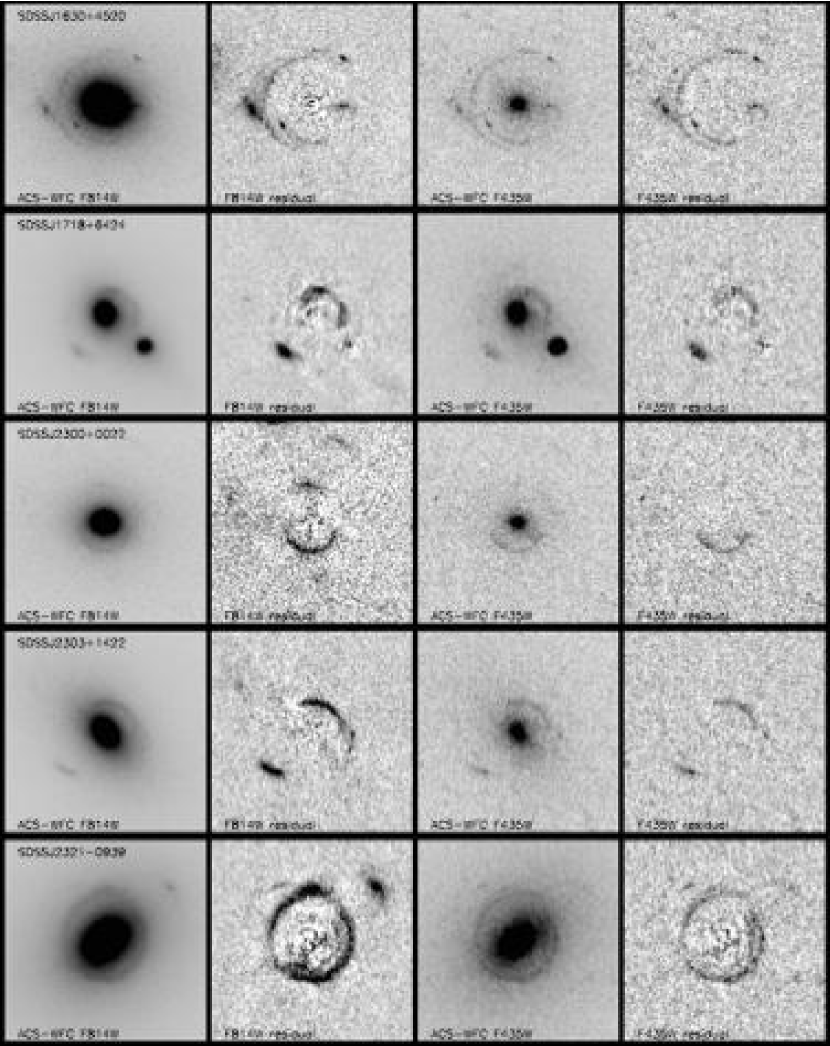
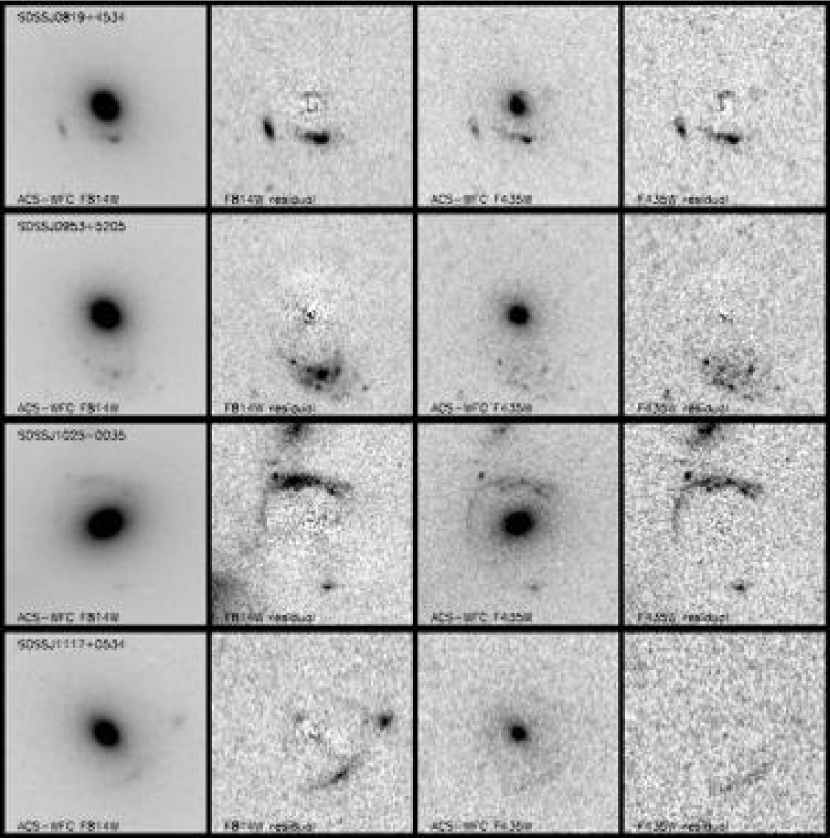
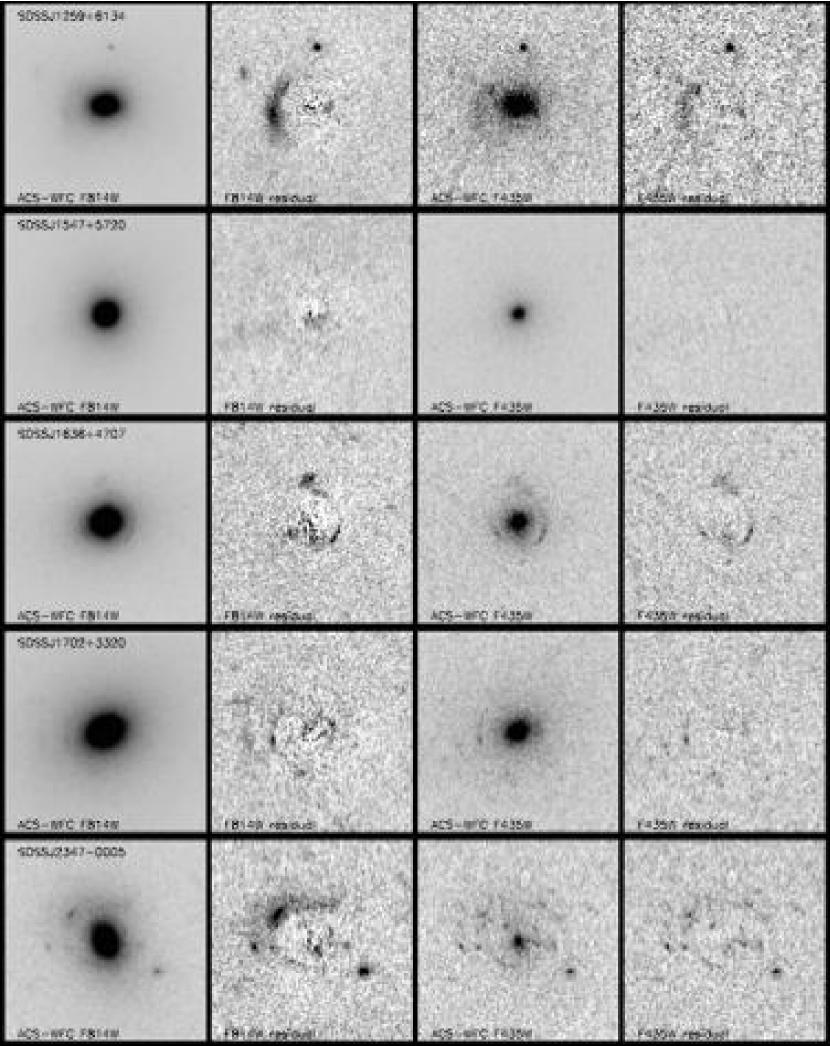
To determine the incidence of strong lensing, we examine the F814W and F435W residual images formed by subtracting smooth models of the foreground galaxy constructed as described in Appendix A. If the residual image of a target shows multiple images with similar colors that can be reproduced by a simple lens model with the potential center fixed at the optical center of the foreground galaxy we classify the system as a strong gravitational lens. The lens models for these systems are presented in Paper III, but we summarize the lens-modeling process here. The procedure is based on the method of Warren & Dye (2003), with an implementation as described in Treu & Koopmans (2004) and Koopmans (2005). We parametrize the lens galaxy as a singular isothermal ellipsoid (SIE, Kormann et al., 1994), with three free parameters corresponding to lens strength (i.e. Einstein radius), ellipticity, and major-axis position angle. The source-plane brightness distribution of the candidate lensed galaxy is represented on a pixel grid. We determine the best-fit lens parameters and source-plane pixel brightnesses by minimizing with respect to the galaxy-subtracted -band image-plane data, while also imposing a brightness-dependent regularization on the source-plane distribution to suppress curvature. Unsuccessful strong-lens models are characterized by an inability to map putative multiply-imaged features to a single region of the source plane for any set of SIE model parameters. SDSSJ1025 is an example of a system with an apparent arc and counterimage which nonetheless cannot be reproduced by an SIE lens model, and is thus not classified as a strong lens. ACS data for target galaxies classified as lenses are shown in Figure 2. We note again that all target systems have line emission in their SDSS spectra at a redshift higher than that of the foreground galaxy, and thus the lensing interpretation does not rest on imaging data alone.
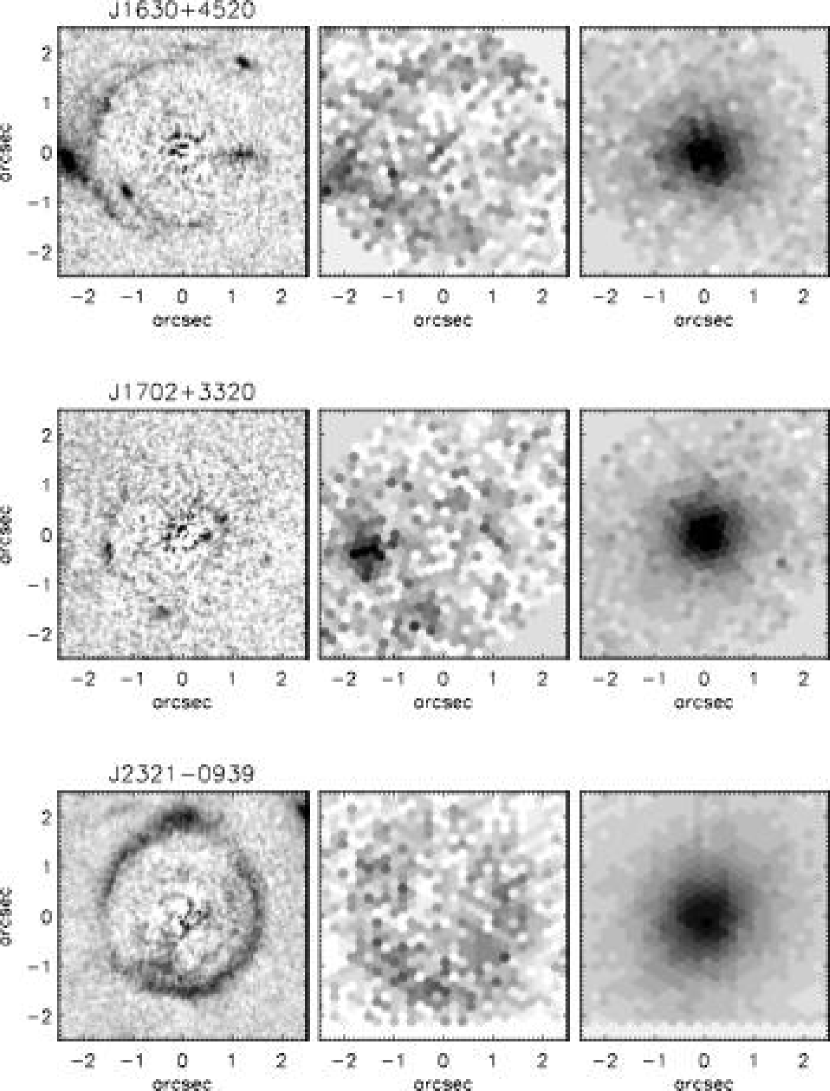
Figure 3 presents all systems other than those that we classify solidly as lenses. This figure encompasses systems that may indeed be strong lenses as well as systems that appear to be definite nonlenses. We note that a significant number of systems that we consider possible but not definite lenses show a faint candidate counterimage near the center of the foreground galaxy opposite a more prominent image at larger radius. If these features were all due to simple residual error in the foreground galaxy subtraction, this configuration would not be expected. The features could conceivably be explained by the prominent image “pulling” the foreground-galaxy model to the side, leading to an under-subtraction of the foreground-galaxy flux near the center on the opposite side. We believe this explanation is unlikely since we have taken care to mask neighboring images when fitting the foreground-galaxy model (Appendix A), and we do not see any corresponding over-subtraction on the near side of the core. The most asymmetric double lenses will in general have faint counterimages at small angular offset from the lens center and will be the most difficult lenses to confirm, although their status as lenses or non-lenses can have a significant impact on statistical inferences based on the lens sample. Integral-field spectroscopy provides the best chance to associate background-redshift line emission with these faint putative counterimages near the lens center and thereby confirm or reject a strong-lensing hypothesis.
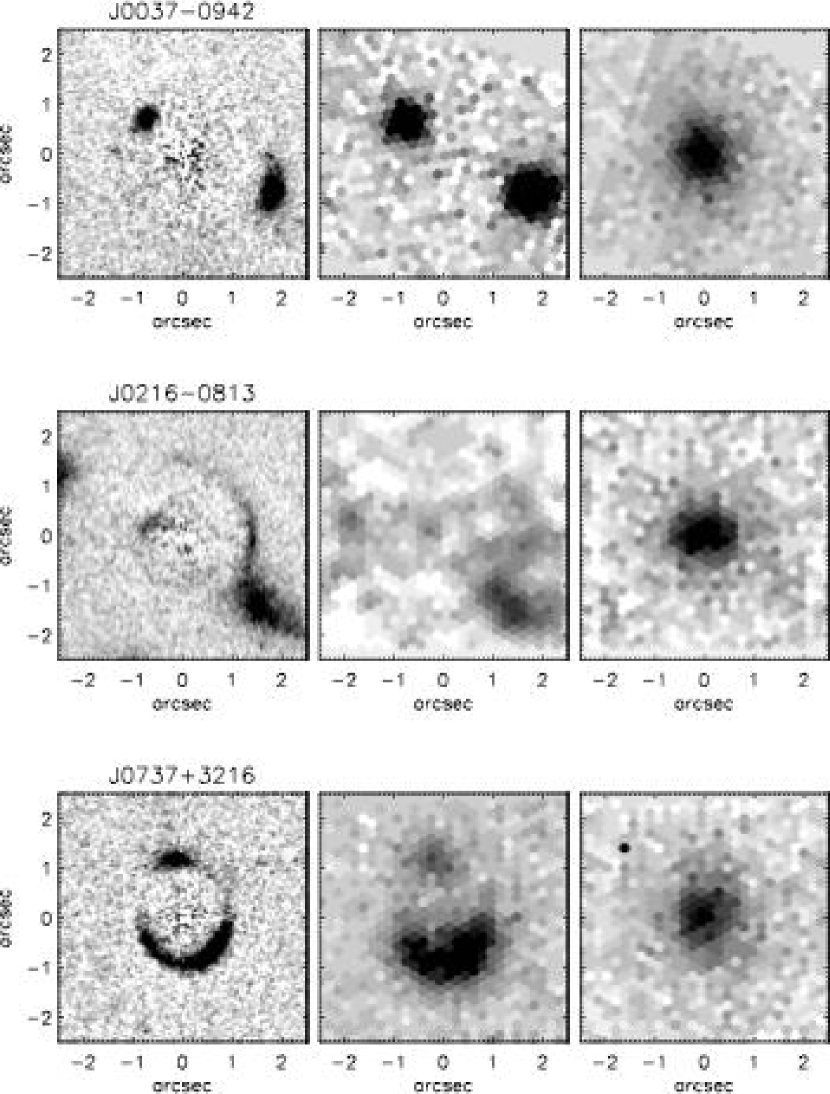
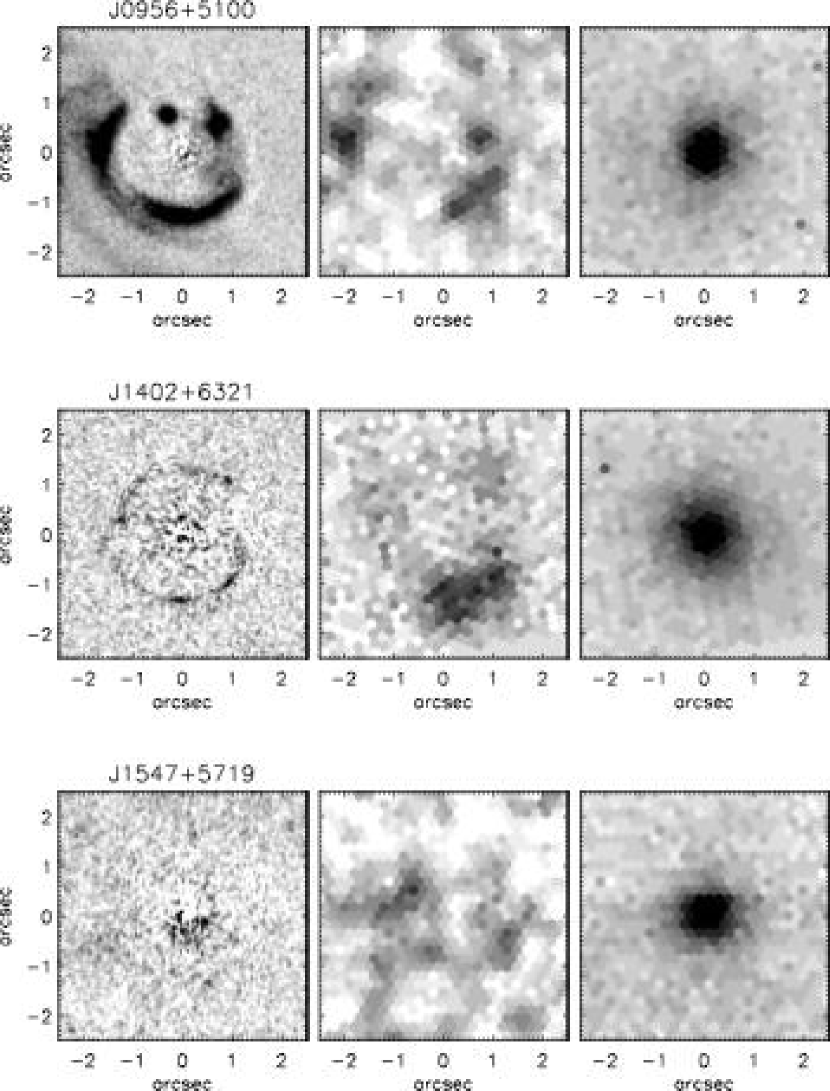
Many of the lens galaxies shown in Figure 2 show such striking features in their residual images that their interpretation as strong lenses is effectively certain when considered in combination with their SDSS spectroscopic detection and gravitational-lens models (Paper III). For putative lenses with less dramatic morphology, further evidence as to their status may be obtained with integral-field spectroscopy, which can confirm or deny the spatial coincidence between the high-redshift line emission and the candidate lensed features seen with HST. For several of our SLACS target galaxies, we have obtained spatially resolved spectroscopy with the integral-field units (IFUs) of the Inamori Magellan Areal Camera and Spectrograph (IMACS, Bigelow & Dressler, 2003; Schmoll et al., 2004) on the 6.5m Walter Baade (Magellan I) telescope at Las Campanas Observatory and the 8m Gemini-North Multi-Object Spectrograph (GMOS-N, Hook et al., 2003; Murray et al., 2003) at Mauna Kea; we present these data in Figure 4. In all cases, the IFU emission-line images are coincident with the ACS residual-image morphology, supporting the strong-lensing interpretation.
We note here that the background sources in our lens systems are generally faint galaxies with irregular morphology. As evidenced by the emission-line flux by which they are originally detected, they should also be regarded as starforming. The absence of significant broadening of the Balmer emission lines at the km s-1 resolution of the SDSS further suggests that they do not host quasars. For a recent observational study of the likely source population of emission-line galaxies, see Drozdovsky et al. (2005).
4. STATISTICS AND SELECTION EFFECTS
The statistics of strong gravitational lensing are the subject of a great body of literature (e.g. Turner et al., 1984; Fukugita & Turner, 1991; Kochanek, 1996; Chae et al., 2002), most of it dealing with the lensing of quasars by galaxies. The rigorous statistics of the SLACS survey, though involving similar considerations, would be sufficiently distinct to require their own detailed treatment: our original sample is formed from potential lensing objects rather than from potentially lensed sources, and we must consider the effects of an extended source image and finite fiber sampling. We defer a full lens-statistical analysis of the SLACS survey to a future paper. Here we address the selection effects of the SLACS survey in terms of the robust statistics of the distribution of lens-galaxy observables.
As discussed above, the SLACS target selection involves an explicit velocity-dispersion and redshift selection. This should not in itself present any complication in the comparison of our lenses to other galaxies with similar velocity dispersions and redshifts. After controlling for this selection, we may ask whether our lenses are a representative sample of the populations from which they have been drawn: luminous red galaxies and quiescent main-sample galaxies from the SDSS. If so, their relation to early-type galaxies selected by other means is simply determined by the SDSS LRG and MAIN sample target selection function (Eisenstein et al., 2001; Strauss et al., 2002). The question can be framed between two alternatives: do we select simply for spectral superposition caused by a chance foreground-background coincidence, or is there some significant bias by which galaxies with certain properties are more likely to be selected as lens candidates based on their SDSS spectra? To test this possibility we exploit the parent sample of SDSS galaxies (Early Data Release through Data Release 3). For each lens we construct a control sample of SDSS galaxies with the same redshift and velocity dispersion (within the uncertainties)—quantities for which we explicitly select—and test whether the lens galaxy is typical of galaxies in the control sample in terms of its magnitude, color, effective radius, and isophotal ellipticity—quantities for which we do not explicitly select. Although this is not a definitive test of the representative nature of our lenses (it will not uncover any “hidden variable” bias), it is straightforward, robust, and informative. By forming control samples at the redshift of the lenses, we avoid the necessity of applying evolution- and -corrections to the broadband magnitudes. We may perform our comparison sensibly for galaxies with velocity dispersions well-measured by SDSS. We exclude the lens SDSSJ12510208 from the analysis, both because its spectral signal-to-noise ratio is too low for a confident velocity-dispersion measurement and because its H equivalent width exceeds our quiescent threshold. (In fact, it is a bulge-dominated spiral-galaxy lens). The double-lens galaxies SDSSJ16184353 and SDSSJ17186424 are also excluded, as is the lens SDSSJ12054910, which has significant flux from a neighboring galaxy within the SDSS spectroscopic fiber. This leaves a well-defined sample of 15 single early-type lenses. The comparison sample for each lens consists of unique galaxies from the SDSS database with redshifts within of the lens redshift, velocity dispersions within km s-1 (approximately the median velocity-dispersion error of the sample) of the lens galaxy, and median signal-to-noise per spectral pixel greater than 8. For LRG-sample targets, we also require the comparison sample to pass the photometric LRG cuts, and for the MAIN-sample lenses, we require a rest-frame Å. We make a luminosity-distance correction to the broadband magnitudes and an angular-diameter-distance correction to the effective radii within the redshift slice to place all galaxies closer to the exact redshift of the lens. The resulting individual comparison samples have as few as 17 and as many as 1793 galaxies, with a mean of 451 and a median of 337 control galaxies per lens galaxy.
We would like to answer the question of whether our lenses have observables (luminosities, colors, effective radii, and ellipticities) consistent with having been drawn from the distribution of those observables seen in the control samples. Since we only have one lens at each redshift, a straightforward Kolmogorov-Smirnov (K-S) test of the lens sample against the control samples is not possible: even under the null hypothesis, each individual lens has a different parent distribution. We may however put all these parent distributions on common footing by using the fact that the K-S test is invariant under a monotonic rescaling of the variable under consideration. Specifically, for each individual lens’s control sample, there exists a transformation of the observable of interest that converts the control distribution into a uniform distribution between the minimum and maximum values. The correspondingly transformed lens observable is simply equal to the normalized rank (between 0 and 1) of the lens quantity within the cumulative distribution of the control sample in that quantity. Thus we may perform a one-dimensional K-S test of the distribution of lens-observable ranks against a uniform distribution over the interval 0 to 1. This test is in some sense like a rank-correlation test within the K-S formalism: does ranking as a lens correlate with ranking in luminosity, color, size, or ellipticity?
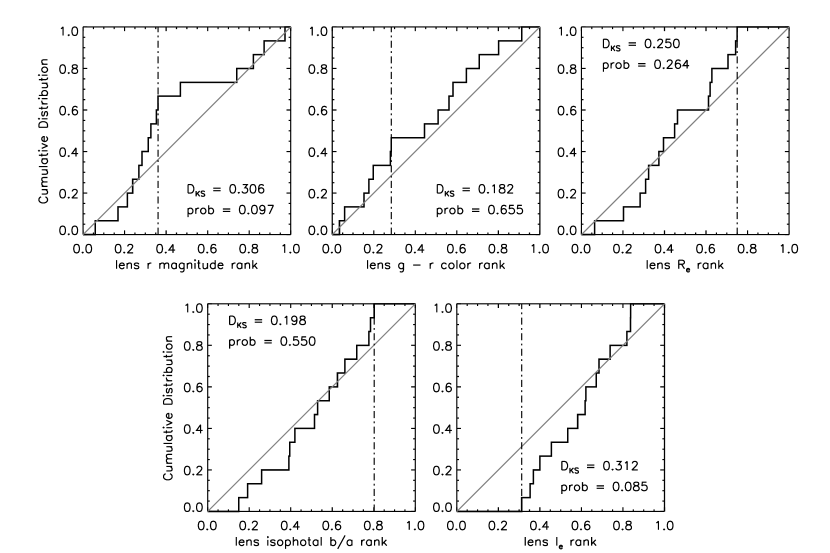
Figure 5 shows the cumulative distributions of lens rankings in (magnitude), (color), (effective radius), (isophotal axis ratio), and (-band effective surface brightness: ) within their control samples. From these distributions we compute the statistic , equal to the maximum difference between the cumulative rank distribution and the null-hypothesis distribution. Since the parent distribution under the null hypothesis is known exactly by construction (uniform probability for any rank between 0 and 1), and since the total number of control galaxies is much larger than the number of lenses, we compute the significance of for a distribution of 15 values against a known parent distribution (e.g. Press et al., 1992). (The statistical significance of an outlying lens will be limited by a smaller control sample in that its rank is at least and at most , where is the number of galaxies in its control sample.) The resulting probabilities of the lens sample having been drawn at random from the control-sample distributions in , , , , and are 0.097, 0.655, 0.264, 0.550, and 0.085 respectively. In terms of color and axis ratio, the SLACS lenses seem to be a representative sample of the parent distribution of SDSS galaxies. However, the distribution of SLACS galaxies in brightness and effective radius (and hence in surface brightness) is somewhat significantly skewed towards brighter and more centrally concentrated systems.
This trend is in the same sense as that of the FP: at fixed velocity dispersion, brighter galaxies have smaller effective radii. Paper II shows that the SLACS lenses fall on the local FP corrected for stellar evolution, and further examines the degree of lens bias towards higher effective surface brightness in the context of the FP. Although the statistical significance is not great, the trend is at first glance suggestive of the effect that more centrally condensed objects are more efficient gravitational lenses (e.g. Li & Ostriker, 2002), to the extent that stellar mass constitutes the dominant lensing component. A larger sample of similarly selected lenses will allow us to test this selection effect with greater statistical significance. Possible interpretations of this finding—as discussed in detail in Papers II and III—include observational selection effects due to the finite size of the SDSS fiber which may bias our survey towards the highest surface brightness lens galaxies. In Paper III we will see that, within the context of powerlaw mass models, the SLACS lens sample shows great homogeneity in the slope of the total mass density profile () and no significant correlation between and . This uniform degree of mass concetration within the lens sample itself argues somewhat against a lens-selection bias due to mass concentration, but this argument is limited by the lack of an equally direct probe of the mass distribution in the non-lens control sample.
5. DISCUSSION AND IMPLICATIONS FOR FUTURE SURVEYS
The large number of new strong lenses confirmed by the SLACS Survey demonstrates the technical feasibility of carrying out spectroscopic surveys for strong gravitational lenses, and suggests that similar gravitational lens surveys should be considered as explicit goals of future large-scale spectroscopic surveys. The SLACS results are particularly notable when one considers that this type of lens survey was never one of the science or design goals of the SDSS, and the survey is thus a testament to the performance of the SDSS telescope and spectrograph, and to the optimal quality of the SDSS spectroscopic data pipeline. With the clarity of hindsight, we may identify those particular features of the SDSS that were beneficial to the spectroscopic lens survey project and those that could conceivably be improved in any future survey to increase the yield of spectroscopically selected strong lenses suitable for specified science goals.
The large parent sample of galaxies observed is a clear advantage afforded by the SDSS for this project or any other rare object survey. Empirically, we have found that spectroscopic lenses and lens candidates appear with a frequency on the order of one in a thousand in the SDSS: starting with early-type galaxies is therefore one key to success. At the same time, the large number of highly magnified galaxies that we have found close to the spectroscopic detection limit (note the generally low emission-line signal-to-noise ratio in the discovery spectra of Figure 1) suggests that we may only be seeing the tip of the iceberg. We conclude that (1) a spectroscopic lens survey will always be at an advantage if it can “piggy back” on a more broadly conceived spectroscopic survey that does not have lenses as its sole scientific goal, and (2) future spectroscopic surveys that go significantly deeper than the SDSS should, all other factors being equal, discover a significantly larger fraction of gravitational lenses.
One might suspect that a significant factor for SLACS survey is the large (3–arcsec diameter) aperture of the SDSS spectroscopic fibers. Certainly a larger fiber will always collect more photons, but for lenses with image splittings of (i.e. Einstein radii) such as we have presented here, a 3–arcsec fiber could afford an advantage over smaller fibers disproportionate to its larger aperture due to the concentration of lensed flux away from the center of the fiber. We can test the importance of this aperture-size effect by simulating observations with varying fiber apertures. We assume an Einstein radius of (an approximate median value from Paper III) and an exponential-disk background galaxy with a disk scale length of . We compute lensed images for a range of source-galaxy impact parameters using a singular isothermal sphere lens model. We then smear the images with seeing (the median SDSS spectroscopic seeing for our targets) and integrate over the 3–arcsec diameter SDSS fiber. If we reduce the fiber aperture to 2–arcsec in diameter, we find that the flux collected from the lensed galaxy is reduced to a fraction of –, depending on impact parameter. This is essentially the factor of corresponding to the diminished aperture size. Thus for lenses of the angular size typical of SLACS lenses, the advantage of a large fiber is just the simple advantage of a large aperture due to the smearing effects of seeing; a smaller fiber would not have lost a disproportionate amount of line flux due to lensing geometry. However, for lenses with larger image splittings (which would occur for higher redshift sources behind the same foreground galaxies), a small fiber would likely be a qualitative disadvantage to a spectroscopic lens survey. Because a fiber-diameter much greater than 3 arcsec would probably increase spurious non-lensed interlopers, we conclude that the SDSS fiber-size represents a very good compromise, when searching for massive early-type lens galaxies at these redshifts.
For two principal reasons, our spectroscopic survey owes much success to having targeted lens candidates with background redshifts confirmed by multiple emission lines. First, the incidence of false-positive spectroscopic detections and emission-line mis-identifications is negligible. Second, to fixed line-flux limits, intermediate-redshift emission from [O ii] 3727, [O iii] 5007, and the hydrogen Balmer series is more common than Lyman- emission at high redshift (Hippelein et al., 2003; Maier et al., 2003), and thus we see an abundance of oxygen/Balmer lenses. However, for optical surveys, this survey strategy limits the background redshifts to , beyond which H and [O iii] 5007 move out of the observable band. There is a definite incentive to discover significant numbers of lenses with higher lens and source redshifts, both to probe evolution in the lens population and to observe lensed images at larger physical radii within the lens galaxy in order to obtain greater leverage on dark-matter halos. Therefore in designing future surveys to discover gravitationally lensed emission-line galaxies at higher redshift, two obvious considerations are increased survey depth to detect a fainter population, and increased spectroscopic resolution beyond the resolution of the SDSS in order to split the [O ii] 3727 doublet and resolve the characteristic asymmetric profile of Lyman- emission (thus permitting more secure single-line redshifts).
One of the greatest uncertainties at the outset of the SLACS survey was simply the fraction of strong lenses within the candidate list. One can attempt to calculate the lensing probabilities of the candidates given , , , assuming a model for the SDSS spectroscopic observations, and assuming a luminosity function (LF) and size/shape for the background emission-line galaxies, as was done in Bolton et al. (2004), but the ingredients are all uncertain. To put it simply, we did not know beforehand whether or not the majority of our targets would owe their high-redshift line emission to the PSF-smeared wings of bright unlensed galaxies at large impact parameter rather than to Einstein-ring images of faint galaxies closely aligned with the SDSS target galaxy. The high ratios of lenses to non-lenses and of quads/rings to doubles that we see are suggestive of a large magnification bias in our selection, with highly magnified faint lensed galaxies detected with greater frequency than less magnified lensed galaxies or unlensed projections. Future work will quantify the extent of any such magnification bias, and will derive statistical constraints on the lens and source populations based on the incidence of lensing within the survey.
6. CONCLUSIONS AND FUTURE WORK
The HST Cycle–13 SLACS Survey222HST program #10174; PI: Koopmans. has produced a catalog of 19 previously unknown early-type strong gravitational lens galaxies. The % fraction of genuine lenses within the the first 28 candidates observed shows that the survey strategy—spectroscopic candidate selection from within the SDSS, followed by HST-ACS Snapshot observations of the systems with the largest estimated lensing cross sections—is an efficient means for the discovery of new gravitational lenses; similar lens surveys should be considered as an explicit goal of future spectroscopic surveys. By targeting galaxies with the highest estimated lensing cross sections, the Cycle–13 SLACS survey has effectively selected high-mass lensing galaxies (strong lensing cross section is simply proportional to lens mass within the Einstein radius). The natural selection of lenses in other surveys is also weighted by lensing cross section, and thus strong lenses are typically massive galaxies. During HST Cycle–14, we will extend our survey to galaxies of lower mass in order to use strong lensing and stellar dynamics to measure the mass dependence of early-type galaxy structure and mass-to-light ratio333HST program #10587; PI: Bolton; 118 Snapshot targets.. These galaxies will have a lower lensing cross section and hence should have a lower lensing rate, although magnification bias may skew the distribution of candidates in favor of lenses over non-lenses. The final combined lens sample will be a unique resource for the detailed measurement of the mass profile of early type galaxies within the effective radius.
The SLACS sample represents the largest single catalog of uniformly selected early-type gravitational lens galaxies assembled to date. The lensed images provide an aperture mass constraint within a typical scale of . The SLACS lens galaxies are all brighter than their lensed background galaxies by many magnitudes, and are thus ideally suited to detailed photometric measurement as with the current ACS data. They are also excellent candidates for spatially resolved spectroscopy to constrain dynamical galaxy models in combination with the mass constraints from strong lensing. In fact, nearly all of the SLACS galaxies already have well-measured luminosity-weighted velocity dispersions inside the 3–arcsec SDSS fiber (see Table 1), and thus we have already nearly tripled the number of known gravitational lenses with known stellar velocity dispersions. Paper III will present the constraints on the logarithmic slope of the total radial density profile (luminous plus dark matter) that can be obtained by combining lens models with the aperture-integrated SDSS velocity dispersions. We may derive tighter constraints and a significant decomposition into luminous and dark components by obtaining spatially resolved line-of-sight velocity dispersion measurements within the lens galaxies (see KT).
An analysis of the distribution of SLACS lens-galaxy photometric and structural parameters within control samples from the SDSS database shows that the SLACS lenses are typical of their SDSS parent sample with regard to color and ellipticity. The location of SLACS lens galaxies within the FP is the subject of Paper II. However, the SLACS lens galaxies exhibit a somewhat significant bias towards brighter and higher surface-brightness galaxies at fixed redshift and velocity dispersion (§ 4; see also paper II). The significance of this bias can be confirmed with a larger sample of similarly selected lenses, which we plan to obtain with the continuation of our ACS survey during HST Cycle–14.
Appendix A B-SPLINE GALAXY MODEL SUBTRACTION
The b-spline technique is a well-known method for fitting a piecewise-defined polynomial of arbitrary order to the dependence of a series of data values upon an independent variable (e.g. de Boor, 1977). The coefficients of the polynomial change at breakpoints in the independent-variable domain, whose spacing may be chosen to allow more or less freedom depending upon the level of detail to be fit. A b-spline of order (where by convention is piecewise constant, is linear, is quadratic, is cubic, and so on) has continuous derivatives to order across the breakpoints. For our galaxy modeling we use b-splines of order , which have continuous 0th, 1st, and 2nd derivatives. The coefficients of the b-spline are determined by fitting to the data in a least-squares sense, given the breakpoint spacing and derivative-continuity conditions. A b-spline model may be reinterpreted in terms of a number of localized basis functions within the domain whose shapes are set by the order of the b-spline and by the breakpoint spacing and whose amplitudes are determined by the fit to the data. The fit itself is entirely linear, and the localized influence of each basis function within the domain implies that only a banded-diagonal matrix need be inverted in the solution for the coefficients.
The radial b-spline technique for galaxy images permits smooth fitting of arbitrary radial brightness profiles. Since we do not have multiple dithered exposures to combine, we perform our b-spline galaxy-model fitting in the native ACS pixel coordinates of the images. We account for the distortion in the ACS by using the solution provided in the image headers to compute relative tangent-plane RA and Dec values for all pixels in the image, which are taken as the independent variables for the fit. We fit for surface brightness as a function of position using cosmic-ray-masked flat-fielded images (i.e. calibrated by the CALACS software pipeline444 (see http://www.stsci.edu/hst/acs/) to measure surface brightness rather than counts-per-pixel), so our fits are not biased by slight variations in pixel area across the images. The one non-linear step in our b-spline galaxy-model fitting is the determination of the center of the lensing galaxy; we describe our centering method further below. The model-fitting procedure is carried out using the adopted center for the lens galaxy within a suitable subsection of the ACS field (typically ), along with an error image, a mask specifying cosmic-ray and other zero-weight pixels, and a mask corresponding to stars, neighboring galaxies, and any apparent background-galaxy features. The cosmic-ray masks are initially generated by the LACOSMIC software (van Dokkum, 2001) and adjusted manually over the image subsection surrounding the lens; the neighboring-object masks are created manually. For each pixel in the sub-image, the radial offset from the galaxy center (in arcseconds) and the azimuthal angle relative to a fixed position angle are computed. A set of breakpoints in is chosen for the fit, typically every – in the central to , with increased spacing further out. (We note again that the ACS pixel scale is 005 per pixel.) For the case of complete Einstein rings, breakpoints at the ring radius can be removed to allow smoother interpolation of the lens-galaxy model over the ring region. A multipole angular dependence is incorporated into the fit as follows. If the purely one-dimensional b-spline fit is represented as
| (A1) |
where the are the localized basis functions that are only non-zero over a small range of breakpoints and the are their amplitudes, then the two-dimensional fit is represented by
| (A2) |
The number of multipole orders to be fit is chosen individually for each galaxy, with (monopole) and (quadrupole) always present and higher-order terms added if necessitated by systematic angular structure in the residual images. With the occasional exception of an (dipole) term to capture slightly disturbed morphologies or mild mis-centering in the central regions, only even multipole orders are used. This form of angular dependence is ideal for fitting early-type galaxies: the fit remains linear, the global symmetries seen in early-type galaxies are naturally reflected in the low-order terms, and effects such as isophotal twists, varying ellipticity with radius, and diskiness/boxyness can be captured with minimal effort (with only the last of these effects requiring multipole orders beyond the quadrupole). We note also that the monopole term can automatically include a fit to the sky background.
Following the completion of the initial b-spline model-fitting step (which for our , 240240-pixel images generally takes 2–3 seconds on a 2.53GHz Pentium 4 Linux PC), we examine the residual (datamodel) image for faint features not associated with the smooth galaxy model and not initially masked, and perform a second fit with an updated mask, also adding multipole orders as needed. Since at this stage we are principally concerned with generating high-quality residual images and not with the measurement of lens-galaxy parameters, we fit directly to the images without convolving the b-spline model with the HST point-spread function. As an example, we describe the fit to the sky-subtracted image of the E3 lens galaxy SDSSJ09120029 to give the F814 residual image shown in Figure 2, which uses breakpoints spaced every in and multipole terms of order 0, 2, and 4 (monopole, quadrupole, and octopole). The ratio of the amplitudes (defined as ) to the amplitudes rises from in the center to at the effective radius (about ), and the ratio of the to the amplitudes rises from to over the same range. Some of this increase in angular structure with radius is due to our fitting directly to the PSF-blurred data.
The centering necessary for the b-spline galaxy fit is accomplished by first fitting with respect to a best-guess center with monopole, dipole, and quadrupole terms. This fit is then evaluated in a ring and used to determine a flux centroid, which is adopted as a new best-guess center for another iteration of the same procedure. Within a few iterations this process—which amounts to minimizing the dipole term—converges to a position that we adopt as the constrained center for the final model fit.
Appendix B NOTES ON INDIVIDUAL SYSTEMS
B.1. Lenses
SDSSJ02160813: A faint but definite counterimage is seen to the NE in both bands in this system, opposite the more obvious extended arc.
SDSSJ09120029: This system shows a faint extended counter-arc to the S in the F814W band, opposite the more prominent Northern arc. Both images are only marginally detected in the band.
SDSSJ09565100: This system includes a small round red companion to the N of the lens galaxy, not to be confused with the prominent lensed images.
SDSSJ12510208: This galaxy has extended spiral structure in addition to the lensing bulge.
SDSSJ13300148: This system is judged to be a lens on the basis of the compact counterimage detected at high significance in both bands.
SDSSJ14026321: This lens, with faint quadruple images, was the first system observed by the SLACS survey and is the subject of Bolton et al. (2005).
SDSSJ16184353: The angular resolution of HST reveals this system to be a pair of foreground galaxies. The pair lenses a compact background source into a 31 quad configuration. The extra compact image to the west of the counterimage is more blue in color than the lensed images and thus does not pertain to the lensed configuration.
SDSSJ17186424: A second nearby galaxy contributes significantly to the lensing potential in this system.
B.2. Other Systems
SDSSJ11170534, SDSSJ12596134: The imaging depth is not great enough to unambiguously show whether the putative lensed features appear in both bands, but the general geometry is plausibly similar to J0912+0029, which has an extremely solid gravitational lens model (Paper III).
SDSSJ16364707: The curvature of the arcs is suggestive of ring geometry, and the knot-counterknot features along the North-South axis may be images of each other. Deeper observations would reveal whether or not this system is a real Einstein ring, but it is not certain from the current data.
SDSSJ17023320: Both F435W and F814W data show possible counter-image features with plausible relative orientations and separations at low signal-to-noise.
References
- Baugh et al. (1996) Baugh, C. M., Cole, S., & Frenk, C. S. 1996, MNRAS, 283, 1361
- Bender et al. (1992) Bender, R., Burstein, D., & Faber, S. M. 1992, ApJ, 399, 462
- Bertin et al. (2002) Bertin, G., Ciotti, L., & Del Principe, M. 2002, A&A, 386, 149
- Bertin et al. (1994) Bertin, G., et al. 1994, A&A, 292, 381
- Bigelow & Dressler (2003) Bigelow, B. C., & Dressler, A. M. 2003, in Instrument Design and Performance for Optical/Infrared Ground-based Telescopes. Edited by Iye, Masanori; Moorwood, Alan F. M. Proceedings of the SPIE, Volume 4841, pp. 1727-1738 (2003)., 1727–1738
- Blumenthal et al. (1986) Blumenthal, G. R., Faber, S. M., Flores, R., & Primack, J. R. 1986, ApJ, 301, 27
- Blumenthal et al. (1984) Blumenthal, G. R., Faber, S. M., Primack, J. R., & Rees, M. J. 1984, Nature, 311, 517
- Bolton et al. (2005) Bolton, A. S., Burles, S., Koopmans, L. V. E., Treu , T., & Moustakas, L. A. 2005, ApJ, 624, L21
- Bolton et al. (2004) Bolton, A. S., Burles, S., Schlegel, D. J., Eisenstein, D. J., & Brinkmann, J. 2004, AJ, 127, 1860
- Cappellari et al. (2005) Cappellari, M., et al. 2005, MNRAS, submitted (astro-ph/0505042)
- Chae (2003) Chae, K. 2003, MNRAS, 346, 746
- Chae et al. (2002) Chae, K.-H., et al. 2002, Physical Review Letters, 89, 151301
- Ciotti (1991) Ciotti, L. 1991, A&A, 249, 99
- Ciotti et al. (1996) Ciotti, L., Lanzoni, B., & Renzini, A. 1996, MNRAS, 282, 1
- de Boor (1977) de Boor, C. 1977, SIAM Journal on Numerical Analysis, 14, 441
- Djorgovski & Davis (1987) Djorgovski, S., & Davis, M. 1987, ApJ, 313, 59
- Dressler et al. (1987) Dressler, A., Lynden-Bell, D., Burstein, D., Davies, R. L., Faber, S. M., Terlevich, R., & Wegner, G. 1987, ApJ, 313, 42
- Drozdovsky et al. (2005) Drozdovsky, I., et al. 2005, AJ, in press (astro-ph/0503592)
- Eisenstein et al. (2001) Eisenstein, D. J., et al. 2001, AJ, 122, 2267
- Flores et al. (1993) Flores, R., Primack, J. R., Blumenthal, G. R., & Faber, S. M. 1993, ApJ, 412, 443
- Franx et al. (1994) Franx, M., van Gorkom, J. H., & de Zeeuw, T. 1994, ApJ, 436, 642
- Fukugita & Turner (1991) Fukugita, M., & Turner, E. L. 1991, MNRAS, 253, 99
- Gao et al. (2004) Gao, L., Loeb, A., Peebles, P. J. E., White, S. D. M., & Jenkins, A. 2004, ApJ, 614, 17
- Gerhard et al. (2001) Gerhard, O., Kronawitter, A., Saglia, R. P., & Bender, R. 2001, AJ, 121, 1936
- Gnedin et al. (2004) Gnedin, O. Y., Kravtsov, A. V., Klypin, A. A., & Nagai, D. 2004, ApJ, 616, 16
- Hall et al. (2000) Hall, P. B., et al. 2000, AJ, 120, 1660
- Hewett et al. (2000) Hewett, P. C., Warren, S. J., Willis, J. P., Bland-Hawthorn, J., & Lewis, G. F. 2000, in ASP Conf. Ser. 195: Imaging the Universe in Three Dimensions, 94
- Hippelein et al. (2003) Hippelein, H., Maier, C., Meisenheimer, K., Wolf, C., Fried, J. W., von Kuhlmann, B., Kümmel, M., Phleps, S., & Röser, H.-J. 2003, A&A, 402, 65
- Hook et al. (2003) Hook, I., et al. 2003, in Instrument Design and Performance for Optical/Infrared Ground-based Telescopes. Edited by Iye, Masanori; Moorwood, Alan F. M. Proceedings of the SPIE, Volume 4841, pp. 1645-1656 (2003)., 1645–1656
- Huchra et al. (1985) Huchra, J., Gorenstein, M., Kent, S., Shapiro, I., Smith, G., Horine, E., & Perley, R. 1985, AJ, 90, 691
- Johnston et al. (2003) Johnston, D. E., et al. 2003, AJ, 126, 2281
- Kauffmann et al. (1993) Kauffmann, G., White, S. D. M., & Guiderdoni, B. 1993, MNRAS, 264, 201
- Kochanek (1996) Kochanek, C. S. 1996, ApJ, 466, 638
- Kochanek (2003) —. 2003, ApJ, 583, 49
- Kochanek (2004) Kochanek, C. S. 2004, in The Impact of Gravitational Lensing on Cosmology (IAU 225), Y. Mellier and G. Meylan, eds. (astro-ph/0412089)
- Koopmans (2005) Koopmans, L. V. E. 2005, MNRAS, in press (astro-ph/0501324)
- Koopmans & Treu (2002) Koopmans, L. V. E., & Treu, T. 2002, ApJ, 568, L5
- Koopmans & Treu (2003) —. 2003, ApJ, 583, 606
- Kormann et al. (1994) Kormann, R., Schneider, P., & Bartelmann, M. 1994, A&A, 284, 285
- Li & Ostriker (2002) Li, L., & Ostriker, J. P. 2002, ApJ, 566, 652
- Loeb & Peebles (2003) Loeb, A., & Peebles, P. J. E. 2003, ApJ, 589, 29
- Maier et al. (2003) Maier, C., Meisenheimer, K., Thommes, E., Hippelein, H., Röser, H. J., Fried, J., von Kuhlmann, B., Phleps, S., & Wolf, C. 2003, A&A, 402, 79
- Mo et al. (1998) Mo, H. J., Mao, S., & White, S. D. M. 1998, MNRAS, 295, 319
- Moore et al. (1998) Moore, B., Governato, F., Quinn, T., Stadel, J., & Lake, G. 1998, ApJ, 499, L5
- Murray et al. (2003) Murray, G. J., et al. 2003, in Instrument Design and Performance for Optical/Infrared Ground-based Telescopes. Edited by Iye, Masanori; Moorwood, Alan F. M. Proceedings of the SPIE, Volume 4841, pp. 1750-1759 (2003)., 1750–1759
- Navarro et al. (1996) Navarro, J. F., Frenk, C. S., & White, S. D. M. 1996, ApJ, 462, 563
- Padmanabhan et al. (2004) Padmanabhan, N., et al. 2004, New Astronomy, 9, 329
- Peng et al. (2002) Peng, C. Y., Ho, L. C., Impey, C. D., & Rix, H. 2002, AJ, 124, 266
- Percival et al. (2002) Percival, W. J., et al. 2002, MNRAS, 337, 1068
- Press et al. (1992) Press, W. H., Teukolsky, S. A., Vetterling, W. T., & Flannery, B. P. 1992, Numerical recipes in FORTRAN. The art of scientific computing (Cambridge: University Press, —c1992, 2nd ed.)
- Romanowsky et al. (2003) Romanowsky, A. J., Douglas, N. G., Arnaboldi, M., Kuijken, K., Merrifield, M. R., Napolitano, N. R., Capaccioli, M., & Freeman, K. C. 2003, Science, 301, 1696
- Rubin et al. (1980) Rubin, V. C., Thonnard, N., & Ford, W. K. 1980, ApJ, 238, 471
- Rusin & Kochanek (2005) Rusin, D., & Kochanek, C. S. 2005, ApJ, 623, 666
- Rusin et al. (2003) Rusin, D., Kochanek, C. S., & Keeton, C. R. 2003, ApJ, 595, 29
- Schlegel et al. (1998) Schlegel, D. J., Finkbeiner, D. P., & Davis, M. 1998, ApJ, 500, 525
- Schmoll et al. (2004) Schmoll, J., Dodsworth, G. N., Content, R., & Allington-Smith, J. R. 2004, in UV and Gamma-Ray Space Telescope Systems. Edited by Hasinger, Günther; Turner, Martin J. L. Proceedings of the SPIE, Volume 5492, pp. 624-633 (2004)., 624–633
- Sersic (1968) Sersic, J. L. 1968, Atlas de galaxias australes (Cordoba, Argentina: Observatorio Astronomico, 1968)
- Simard (1998) Simard, L. 1998, in ASP Conf. Ser. 145: Astronomical Data Analysis Software and Systems VII, 108
- Spergel et al. (2003) Spergel, D. N., et al. 2003, ApJS, 148, 175
- Strauss et al. (2002) Strauss, M. A., et al. 2002, AJ, 124, 1810
- Tegmark et al. (2004) Tegmark, M., et al. 2004, Phys. Rev. D, 69, 10350
- Treu & Koopmans (2002) Treu, T., & Koopmans, L. V. E. 2002, ApJ, 575, 87
- Treu & Koopmans (2003) —. 2003, MNRAS, 343, L29
- Treu & Koopmans (2004) —. 2004, ApJ, 611, 739
- Trujillo et al. (2004) Trujillo, I., Burkert, A., & Bell, E. F. 2004, ApJ, 600, L39
- Turner et al. (1984) Turner, E. L., Ostriker, J. P., & Gott, J. R. 1984, ApJ, 284, 1
- van Albada & Sancisi (1986) van Albada, T. S., & Sancisi, R. 1986, Royal Society of London Philosophical Transactions Series A, 320, 447
- van Dokkum (2001) van Dokkum, P. G. 2001, PASP, 113, 1420
- Warren & Dye (2003) Warren, S. J., & Dye, S. 2003, ApJ, 590, 673
- Warren et al. (1996) Warren, S. J., Hewett, P. C., Lewis, G. F., Moller, P., Iovino, A., & Shaver, P. A. 1996, MNRAS, 278, 139
- Warren et al. (1998) Warren, S. J., Iovino, A., Hewett, P. C., & Shaver, P. A. 1998, MNRAS, 299, 1215
- Warren et al. (1999) Warren, S. J., Lewis, G. F., Hewett, P. C., Møller, P., Shaver, P., & Iovino, A. 1999, A&A, 343, L35
- Wechsler et al. (2002) Wechsler, R. H., Bullock, J. S., Primack, J. R., Kravtsov, A. V., & Dekel, A. 2002, ApJ, 568, 52
- White & Rees (1978) White, S. D. M., & Rees, M. J. 1978, MNRAS, 183, 341
- Willis (2000) Willis, J. P. 2000, The Observatory, 120, 427
- Willis et al. (2005) Willis, J. P., Hewett, P. C., & Warren, S. J. 2005, MNRAS, in press (astro-ph/0508430)
- Zhao et al. (2003) Zhao, D. H., Mo, H. J., Jing, Y. P., & Börner, G. 2003, MNRAS, 339, 12