Searching for Sharp Surface Brightness Discontinuities: a Systematic Study of Cold Fronts in Galaxy Clusters
Abstract
We perform a systematic search of cold fronts in a sample of 62 clusters observed with XMM-Newton with redshift ranging from 0.01 to 0.3. We detect one or more cold fronts in 21 (34%) of our objects. A large fraction (87.5%) of nearby clusters host a cold front while only 20% of the distant clusters, mostly merging clusters, do so. The absence of sharp surface brightness discontinuites in distant cool cores is most likely a consequence of the insufficent spatial resolution of our images. Some nearby cool core clusters show a dislocation between the surface brightness and the pressure peak. This implies that the cool central gas is displaced from the bottom of the gravitational potential well and likely sloshing.
keywords:
cold fronts; clusters of galaxies; X-rays1 Introduction
The high spatial resolution of the Chandra X-ray telescope has led to the discovery of several phenomena within galaxy clusters. In particular, Chandra observations revealed the existence of very sharp discontinuities in the X-ray surface brightness of several clusters. The drop in the X-ray surface brightness is accompanied by a jump of similar magnitude in the gas temperature, so that the pressure does not change drastically across the front. This feature has been named “cold front” (Vikhlinin, Markevitch & Murray, 2001).
Cold fronts have been initially observed in merging clusters. The prototype cold fronts are hosted in A2142 (Markevitch et al., 2000), A3667 (Vikhlinin, Markevitch & Murray, 2001) and 1E0657-56 (Markevitch et al., 2002). In these clusters, the cold front delineates the edge of the cool core of the merging substructures which have survived the merger and is rapidly moving throughout the shock-heated ambient gas (Markevitch et al., 2000).
Cold fronts have been detected also in the core of some relaxed clusters (e.g. A1795: Markevitch, Vikhlinin & Mazzotta, 2001; RX J1720.1+2638: Mazzotta et al, 2001; A496: Dupke & White III, 2003; 2A 0335+096: Mazzotta, Edge & Markevitch, 2003). The presence of cold fronts in cool cores provides evidence of gas motions and possiblly of departures from hydrostatic equilibrium. Cold fronts represent a unique tool of investigation of the internal dynamics of clusters, especially in the regrettable absence of instrumentation capable of a direct detection of gas motions. To study and characterize cold fronts, we built a sample of 62 clusters observed with XMM-Newton and carried out a systematic search for surface brightness and temperature discontinuities. We studied the occurrence of cold fronts in different redshift ranges and for different types of clusters (merging and cool cores). Particular attention has been devoted to cold fronts in relaxed clusters.
2 The data sample
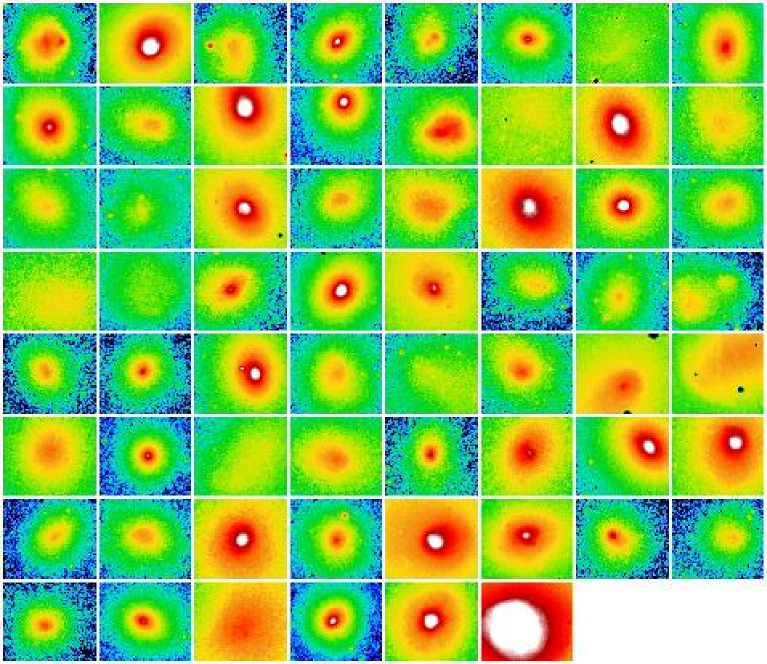
We have performed a systematic search and characterization of cold fronts from a large sample of clusters observed with XMM-Newton. The large collecting area of the EPIC telescope onboard the XMM-Newton satellite allows a detailed inspection of the spectral properties of the galaxy clusters, which are important to study the dynamics of the core. Namely, we have selected a sample of 62 clusters of galaxies. The sample includes two different subsamples. The first comprises roughly 20 nearby bright clusters with redshifts in the range . The second subsample comprises all the clusters available in the XMM-Newton public archive up to March 2005, having redshifts in the range (Leccardi et al., 2005; in preparation).
The sample (see Fig. 1) includes a wide variety of clusters, both merging and cool cores. It is worth noting that we did not fix an objective selection parameter to build our sample. However, the criteria used for the selection of the clusters are not related to the existence of the cold fronts. Hence, no bias is a priori present in our sample as far as cold fronts occurrence is concerned and for our purposes this sample is sufficiently representative of the cluster population up to redshift 0.3.
3 Searching for cold fronts.
To find cold fronts and to study their properties, we need accurate surface brightness and temperature maps and profiles. Profiles should be determined in different directions for each cluster. For clusters with good statistics, we have used the algorithm developed by the Milano group to build the maps. The procedure consists in binning the cluster images, using the adaptive binning algorithm developed by Cappellari & Copin (2003) and based on the Voronoi tessellation technique. The temperature () and the surface brightness () values in each bin are determined through a broad band fitting method (Rossetti et al., 2005; in preparation). Errors are determined for both and in each bin.
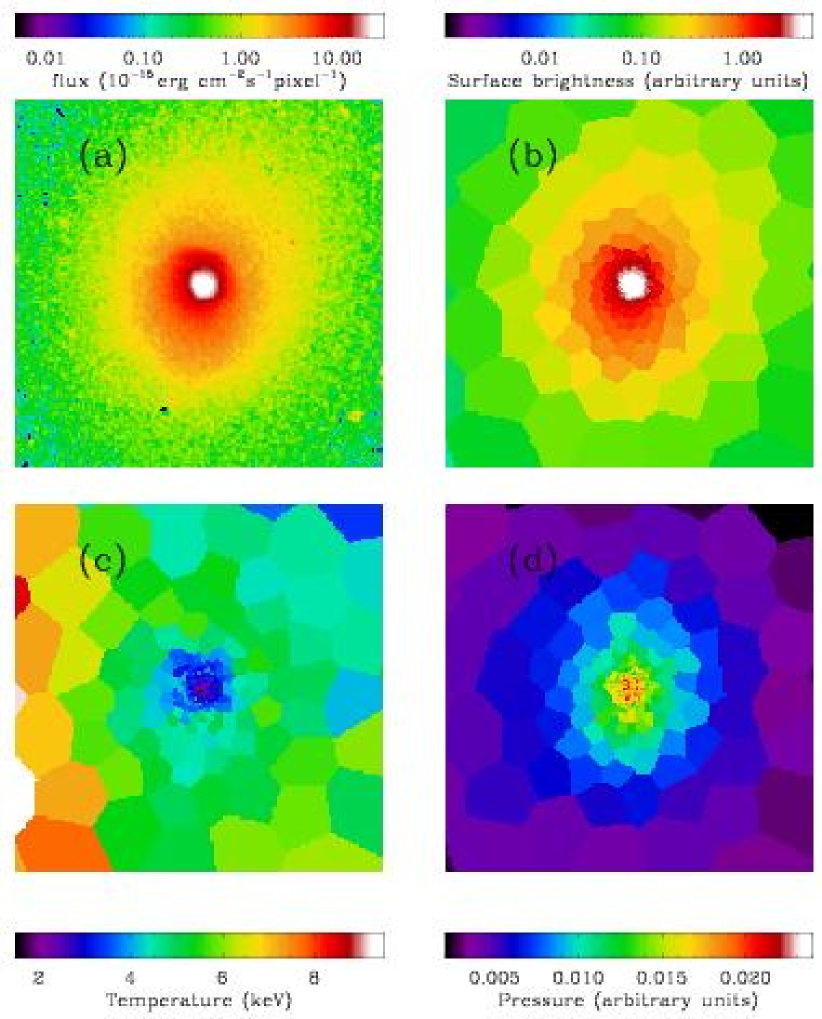
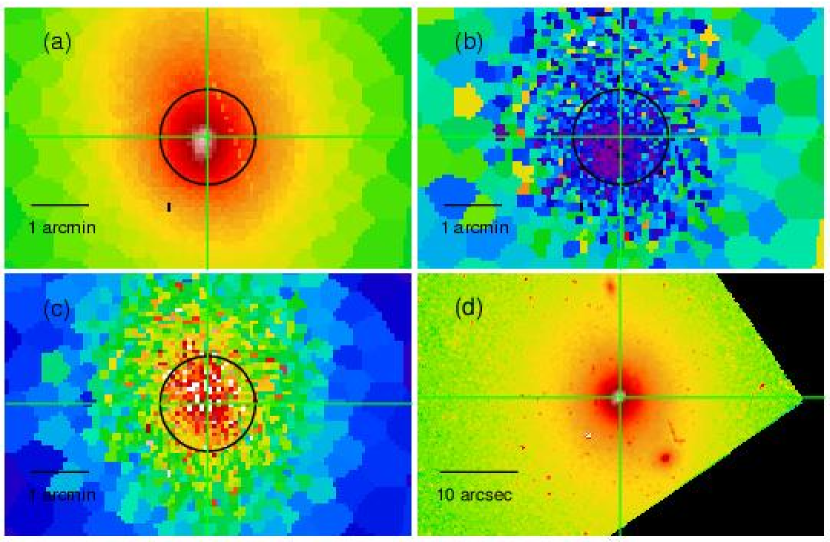
As an example, in Fig. 2 we show the maps obtained applying our procedure to the XMM-Newton observation of the galaxy cluster A496. In Fig. 2(a) and (b), we report respectively the EPIC (MOS + PN) surface brightness image and the surface brightness map derived using our procedure. In Fig. 2(c), the A496 temperature map is shown; the central cool core is clearly visible. The quality of the A496 observation is quite good, so the derived maps are very accurate and the surface brightness map is very similar to the surface brightness image.

Once the surface brightness and the temperature have been obtained, other thermodynamic quantities (pressure and entropy) can be derived. Although a deprojection procedure should be applied to derive these quantities, we work in the approximation that the surface brightness is , where is the electronic density. The (pseudo)-pressure and the (pseudo)-entropy are correspondingly derived through the projected quantities and . The (pseudo)-pressure map for A496 is reported in Fig. 2(d). A cold front at roughly 90 arcsec from the peak in the N-NW sector (roughly ) is clearly observed in the surface brightness and temperature maps. The and (see Fig. 3) profiles in this sector show that the surface brightness has a sharp discontinuity (approximatively by a factor of 2-3) and that the temperature across the edge varies by a factor of 1.5. Correspondingly the pressure does not show an abrupt drop and there is approximate pressure equilibrium across the front.
Another cluster with high statistics is Centaurus. The surface brightness and the temperature profiles (in Fig. 4 (a) and (b) respectively) of the NE sector () show that Centaurus hosts a cold front at arcsec from the peak. The surface brightness drops by a factor of 4-5 and the temperature rises by almost a factor of 3. Also in this case the pressure is almost constant across the front.

For clusters having poor statistics the adaptive binning procedure does not allow us to produce detailed maps. Hence, for these clusters the broad band fitting method has been applied to manually selected macro regions. Regions are built in such a way as to follow the cold front feature so that the temperature profile across the cold front can be determined. This is the case of A1300, where a discontinuity in the surface brightness (see Fig. 5a) is detected at arcsec from the peak (in the W-NW direction). The temperature profile (Fig. 5b) is not as detailed as in the previous cases, nevertheless there is an indication of a temperature rise.

4 Occurrence of Cold Fronts in galaxy clusters
The systematic analysis of the surface brightness of the clusters of our sample brought to the detection of cold fronts in 21 objects (and probably also in other 4 clusters where the presence of a cold front is not clear and needs some further investigation). This corresponds to a percentage of 34% (40% if the uncertain cases are also accounted) in the redshift range [0.01-0.3]. It is interesting to study also the frequency of cold fronts in different redshift ranges. Our analysis shows that if we progressively reduce the sample, excluding gradually the more distant clusters, the fraction of clusters having a cold front increases. In particular, in the subsample of the nearby clusters (with redshift in the [0.01-0.04] range), 87.5% of our objects exhibit one or more cold fronts. Considering that projection effects can hide a non-negligible fraction of cold fronts, such frequency implies that probably all the nearby clusters host one or more cold fronts. This result is in agreement with Markevitch, Vikhlinin & Forman (2002) who analyzed a sample of 37 relaxed nearby clusters observed with Chandra and find that roughly 70% of the nearby cool core clusters of their sample host a cold front (Markevitch, Vikhlinin & Forman, 2002).
While cold fronts are a common feature in nearby clusters, either merging or cool cores, for distant clusters their frequency is different for different types of clusters. For clusters with redshift larger than 0.1, cold fronts are mostly detected in merging clusters, while only few cool core clusters exhibit one. Since cold fronts in cool cores are in general quite near to the peak and less prominent than in merging clusters, it is likely that the resolution of XMM-Newton is not enough to detect sharp discontinuities for this class of clusters at high redshifts.
5 The cold fronts in relaxed galaxy clusters
Our sample includes a large number of nearby relaxed clusters and we have already shown that most of them host a cold front. The presence of a cold front in the center of cool core clusters is a clear indication that the ICM in these objects is not completely static. Several Chandra observations of clusters have revealed that relaxed clusters often have disturbed cores with complex morphological structure. Two major pictures have been proposed for cold fronts in cool core clusters. Markevitch, Vikhlinin & Forman (2002) proposed that the central cool gas is sloshing in the underlying gravitational potential well. In this scenario, the cold front is the boundary between the displaced cooler gas and the ambient hot gas. The gas could have been displaced by some AGN central activity or as a consequence of some past minor merging process (Markevitch, Vikhlinin & Forman, 2002; Markevitch, Vikhlinin & Mazzotta, 2001).
An alternative picture has been recently proposed by Tittley & Henriksen (2005). Using numerical simulations, the authors show how the oscillations of the dark matter (and correspondingly of the gravitational potential well) can produce cold fronts. In this scenario, it is the potential well that is oscillating and not the gas within it; the gas and the dark matter are oscillating together, since dark matter movement induces gas motions. The resulting compression of the isodensity contours along the oscillations generates the cold front feature.
A detailed analysis of cold fronts in relaxed clusters can help us improve our understanding of the nature of the phenomenon. We selected from our sample some cool core clusters. For most of them, the derived temperature and (pseudo)-pressure maps are detailed and allow a good inspection of the cool core physics.
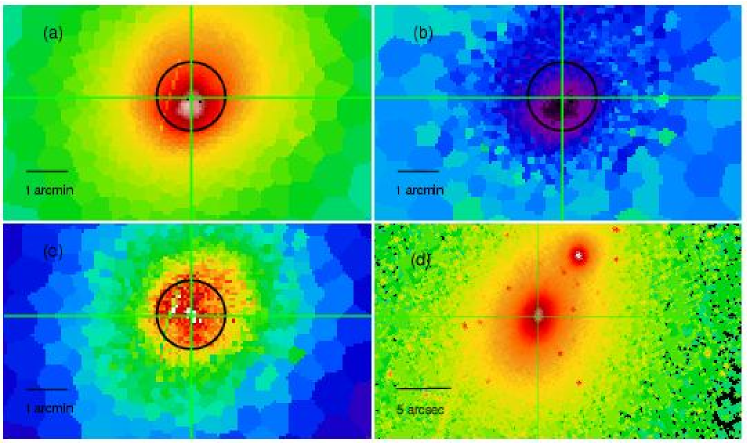
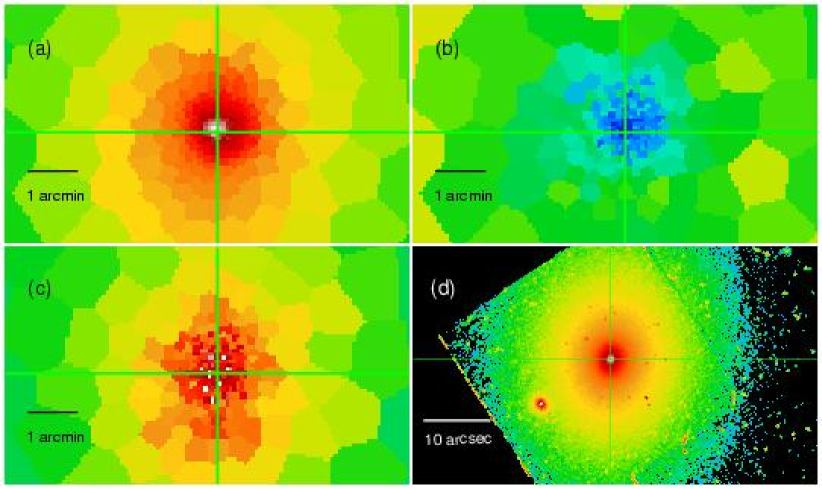
2A 0335+096 is a cool core cluster with a cold front in the S-SW sector arcsec from the peak (see also Mazzotta, Edge & Markevitch, 2003). In Fig. 6 we show the maps obtained applying our algorithm to the XMM-Newton data for 2A 0335+096. In Fig. 6(a) and (b), we show respectively the surface brightness and the temperature maps for the central region of the cluster. In Fig. 6(c) the (pseudo)-pressure is reported. Finally, in Fig. 6(d) the optical image of the central cD galaxy observed with HST is shown. This last image has been repeatedly zoomed in, for a better view of the galaxy, while the scales of the three images derived from XMM-Newton observation match each other. The crosshair is centered on the cD galaxy. The circle is an approximation of an isophote of the pressure image. The peak of the pressure perfectly matches the cD galaxy position, while the surface brightness peak and the temperature minimum are significatively displaced in the direction of the cold front (S-SW direction). The same analysis has been applied also to a Chandra observation of 2A 0335+096. The corresponding maps are reported in Fig. 7. The panels are as in Fig. 6. The displacement between the surface brightness and the pressure (or the cD galaxy) peak is even more evident here.
The mismatch between pressure and surface brightness can help improve our understanding of cold fronts. Both the gas pressure and the cD trace the gravitational potential of the cluster, while the surface brightness describes the X–ray emitting gas. The dislocation of the surface brightness peak in the direction of the cold front, indicates that the thermal gas is not at the bottom of the gravitational potential well, in agreement with a the sloshing scenario proposed by Markevitch, Vikhlinin & Forman (2002).
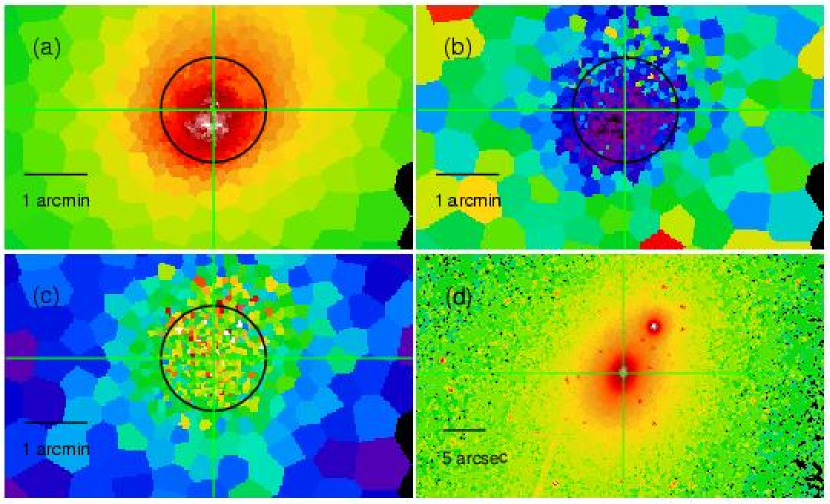
A1795 (see Fig. 8) shows a similar mismatch. This cluster has a cold front in the southern sector arcsec from the peak. Markevitch, Vikhlinin & Mazzotta (2001) propose that the sloshing gas is now at the maximum displacement from the peak with a zero velocity. The displacement from the bottom of the potential well is visible in Fig. 8 although it is less evident than in 2A 0335+096 maps. As for 2A 0335+096, the position of the cD (in the HST image) and the pressure peak match each other, while the surface brightness peak is displaced towards the southern direction.
A different picture emerges from the analysis of the cluster A496 (see maps in Fig. 9). As already outlined in § 3, A496 is a cool core cluster and exhibits a cold front in the N-NW direction. Fig. 9 shows (at the available resolution kpc) no displacement between the surface brightness and the pressure (or the cD position). This is compatible with a Tittley-Henriksen picture where the dark matter and the ICM oscillate together. However, the Markevitch et al. picture is not ruled out: the oscillating gas may be observed just while passing in the center of the potential well.
At the present time, the analysis of these three clusters leaves room for both the scenarios described above. A systematic analysis of the temperature, pressure and metal maps for all the cool core clusters of the sample is needed to address the nature of this class of cold fronts.
6 Summary
In the absence of instrumentation capable of detecting gas motions, cold fronts are our primary tool to study the internal dynamics of the ICM. We have selected a large sample including 62 galaxy clusters observed with XMM-Newton, having a redshift in the [0.01-0.3] range. The systematic search of surface brightness discontinuities has brought to the detection of cold fronts in 21 (34%) clusters of galaxies. Almost all the nearby clusters (either merging and cool cores) host a cold front while, as far as distant clusters are concerned, cold fronts are mostly detected in merging clusters and only few relaxed clusters host one. Probably, cold fronts are not detected in distant relaxed clusters because of the insufficient resolution of our observations.
Through the analysis of the surface brightness, temperature, (pseudo)-pressure maps for some cool core clusters we have outlined a method which can help us improve our understanding of this phenomenon. In some clusters, (e.g. 2A0335, A1795), the surface brightness peak (which describes the X–ray emitting gas) is displaced from the pressure (and the central cD) peak which traces the gravitational potential well. This is an indication that the thermal gas is displaced from the bottom of the potential well and probably is sloshing (see Markevitch, Vikhlinin & Forman, 2002). On the contrary, in A496 all the peaks (surface brightness, pressure and cD galaxy) match each other. This behavior favors the scenario proposed by Tittley & Henriksen (2005) where the dark matter itself (carrying the gravitational potential and the gas) is oscillating. This is also compatible with the Markevitch, Vikhlinin & Forman (2002) picture as the oscillating gas may be observed just while passing in the center of the potential well.
A systematic study of the dislocation of the surface brightness peak for all the relaxed clusters of our sample will help us address this issue.
References
- Cappellari & Copin (2003) Cappellari M. & Copin Y. 2003, MNRAS, 342, 345
- Dupke & White III (2003) Dupke R. & White III R.E., 2003, ApJ, 583, L13
- Leccardi et al. (2005; in preparation) Leccardi A., et al. 2005, in preparation
- Markevitch et al. (2000) Marchevitch M., et al. 2000, ApJ, 541, 542
- Markevitch, Vikhlinin & Mazzotta (2001) Markevitch M., Vikhlinin A. & Mazzotta P. 2001, ApJ, 562, L153
- Markevitch et al. (2002) Markevitch M., Gonzalez A.H., David L., Vikhlinin A., Murray S., Forman W.R., Jones C. & Tucker W. 2002, ApJ, 555, 205
- Markevitch, Vikhlinin & Forman (2002) Markevitch M., Vikhlinin A. & Forman W.R. 2002, Matter and energy in clusters of galaxies, ASP Conference Series, Vol. X, Eds. S. Bowyer & C.-Y. Hwang, astro-ph/0208208
- Mazzotta et al (2001) Mazzotta P., Markevitch M., Vikhlinin A., Forman W.R., David L.P. & VanSpeybroeck L. 2001, ApJ, 555, 205
- Mazzotta, Edge & Markevitch (2003) Mazzotta P., Edge A.C., Markevitch M. 2003, ApJ, 596, 190
- Rossetti et al. (2005; in preparation) Rossetti M., Ghizzardi S., Molendi S. & Finoguenov A. 2005, in preparation
- Tittley & Henriksen (2005) Tittley E.R. & Henriksen M. 2005, ApJ, 618, 227
- Vikhlinin, Markevitch & Murray (2001) Vikhlinin A., Markevitch M. & Murray S.S. 2001, ApJ, 551, 160