The LMC H ii region N 214C and its peculiar nebular blob ††thanks: Based on observations obtained at the European Southern Observatory, La Silla, Chile; Program 69.C-0286(A) and 69.C-0286(B)., ††thanks: Tables 2 and 3 are only available in electronic form at the CDS via anonymous ftp to cdsarc.u-strasbg.fr (130.79.128.5) or via http://cdsweb.u-strasbg.fr/cgi-bin/qcat?J/A+A/
We study the Large Magellanic Cloud H ii region N 214C
using imaging and spectroscopy obtained at the ESO New Technology Telescope.
On the basis of the highest resolution images so far obtained of the
OB association LH 110,
we show that the main exciting source of the H ii region, Sk , is in fact
a tight cluster of massive stars consisting of at least 6 components
in an area 4′′ wide. Spectroscopic observations allow us to
revise the spectral type of the main component (# 17) to
O2 V ((f*)) + OB, a very rare, hot type. We also classify several
other stars associated with N 214C and study the extinction and
excitation characteristics of the H ii region.
Moreover, we obtain BVR photometry and astrometry of
2365 stars and from the corresponding color-magnitude diagram study the
stellar content of N 214C and the surrounding LH 110. Furthermore,
we discover a striking compact blob of ionized gas in the outer northern
part of N 214C. A spherical structure of 5′′ in radius
( 1.3 pc), it is split into two lobes by absorbing dust
running diametrically through its center. We discuss
the possible nature of this object.
Key Words.:
Stars: early-type – Interstellar Medium: individual objects: LHA 120-N 214C (LMC), – Galaxies: Magellanic CloudsFrederic.Meynadier@obspm.fr
1 Introduction
Among the Large Magellanic Cloud (LMC) H ii regions catalogued by
Henize (1956), N 214 is one of the southernmost, lying
below the bar, at a distance of 135′ ( 2.1 kpc in
projection) from the famous 30 Doradus (assuming a distance modulus
of 18.6 mag (Groenewegen & Oudmaijer, 2000)).
N 214 appears as an elongated structure,
15′ 4′ ( 220 pc 60 pc), composed of at
least 8 nebular components (A to H), most of them very dim. This gas
complex is a noteworthy region of ongoing star formation, as
suggested by the detection of molecular emission toward components
N 214C and N 214DE (Israel et al., 1993; Heikkila et al., 1998). The latter molecular
cloud is of particular interest since it is larger, more intense, and
moreover contains several molecular species (HCN, HCO+, CS,
etc.) tracing high-density regions (Chin et al., 1997). In fact the H i
column density toward N 214 is one of the largest in the whole LMC
(Israel, 1997). N 214 also harbors the OB association LH 110 (Lucke & Hodge, 1970),
a study of which was presented by Oey (1996).
Few works have been devoted to the H ii regions constituting N 214
and its associated stellar populations. The present paper deals with
the brightest component N 214C, also called NGC 2103 or
DEM L 293
(Davies et al., 1976). We use optical imaging and spectroscopy in order to
study the H ii region as well as its associated stars. N 214C is quite
attractive since it hosts Sk , a very hot and massive star previously
classified O3 V((f*)) (Walborn et al., 2002), which our present work
shows to be even earlier. The most massive stars being
particularly rare, and since we do not know yet how they form, N 214C
provides an excellent opportunity for studying the formation site of
such a star, including its related stellar populations.
2 Observations and data reduction
2.1 Sub-arcsecond imaging and photometry
N 214C was observed on 28 September 2002 using the
ESO New Technology Telescope (NTT) equipped with the active optics and
the SUperb Seeing Imager (SuSI2). The detector was made up of two CCD
chips, identified as ESO #45 and #46. The two resulting frames were
automatically combined in a single FITS file, whereas the space
between the two chips was “filled” with some overscan columns so that
the respective geometry of the two chips was approximatively
preserved. The gap between the chips corresponds to 100 real CCD
pixels, or 8′′. The file format was 4288 4096
pixels, and the measured pixel size 0′′.085 on the sky. Each
chip of the mosaic covered a field of 5′.5 2′.7. See the
ESO manual SuSI2 for more technical information
(LSO-MAN-ESO-40100-0002/1.9).
Nebular imaging was carried out using the narrow band filters centered
on the emission lines H (ESO #884), H (#881), and
[O iii] (#882) with basic exposures of 300 sec; for the first two
filters 2 exposures and in the latter case 4 exposures were obtained.
The image quality was quite good during the night, as represented
by a seeing of 0′′.5–0′′.8.
Photometry was performed in the BVR Bessell system using the filters
ESO #811 (), #812 (), and #813 (). We were
particularly careful to keep most of the brightest stars in the field
under the detector’s saturation level in order to get high quality
Point Spread Functions (PSF). This led us to adopt unit
exposure times of 60 sec for and and 30 sec for
respectively. The exposures for each filter were repeated 4 times
using ditherings of 5′′ –10′′ for bad pixel rejection.
Seven standard stars, belonging to two Landolt
photometric groups (SA 92 and T Phe) were observed at four different
airmasses. This led to the determination of the photometry coefficients
and zero-points using the photcal package under
iraf. Those coefficients are in good agreement with the
indicative values which are displayed on the SuSI2 web page.
The offset between standard stars’ wide-aperture photometry and field
stars’ PSF-fitting photometry was calculated as follows: starting from
one of the flat-fielded frames, we subtracted all stars except
the ones used for determining the PSF with the
daophot.substar procedure, using our preliminary DAOPHOT
photometry and the corresponding PSF. This leads to a frame with only
a few bright, isolated stars plus residues from the subtraction. We then
performed both aperture and PSF-fitting photometry on those stars,
using the same aperture we used for standard stars. Finally, we
compared the results and eliminated deviant measurements (occasional bad
PSF subtraction and strongly variable nebular background). This results in
aperture corrections of 0.02, 0.04 and 0.03 mag in , and
respectively.
During the photometry process, some slight discrepancies between the
intensity of the frames were found: this effect was considered to be
the consequence of episodic variations of sky transparency by 7% at
most. In order
not to introduce a systematic underestimation of the star magnitudes
when averaging the frames, we decided to perform photometry
on each individual frame with daophot.
Then, for each star, we computed the
magnitude differences from one frame to another, and deduced the mean
magnitude shift between each frame. Choosing the brightest ones as the
reference for each filter, we multiplied the three others by the appropriate
correction factor (, with
being the (negative) mean difference of magnitude between the brightest
frame and the current frame) and performed another run of
photometry. By cross-correlating the positions of the sources in the
various photometry files, we obtained the mean magnitude (average
of the 4 magnitudes) and a decent estimator of the uncertainty on this
magnitude (difference between maximum and minimum magnitudes, the
sample being too small for to be significant). The
mean uncertainties, much larger and probably more meaningful than the
daophot internal errors, are reported in Table 1.
Finally, the process yielded the photometry of 2321 stars in all
three filters (online Table LABEL:tab:photometrie).
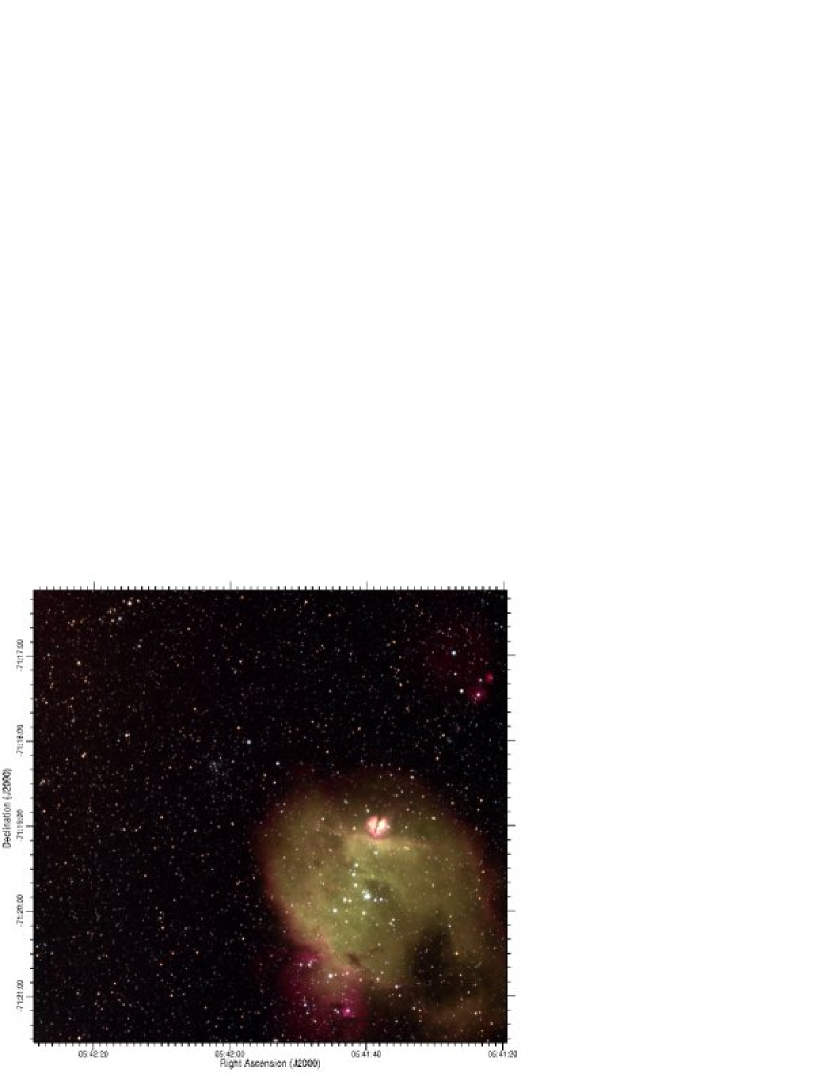
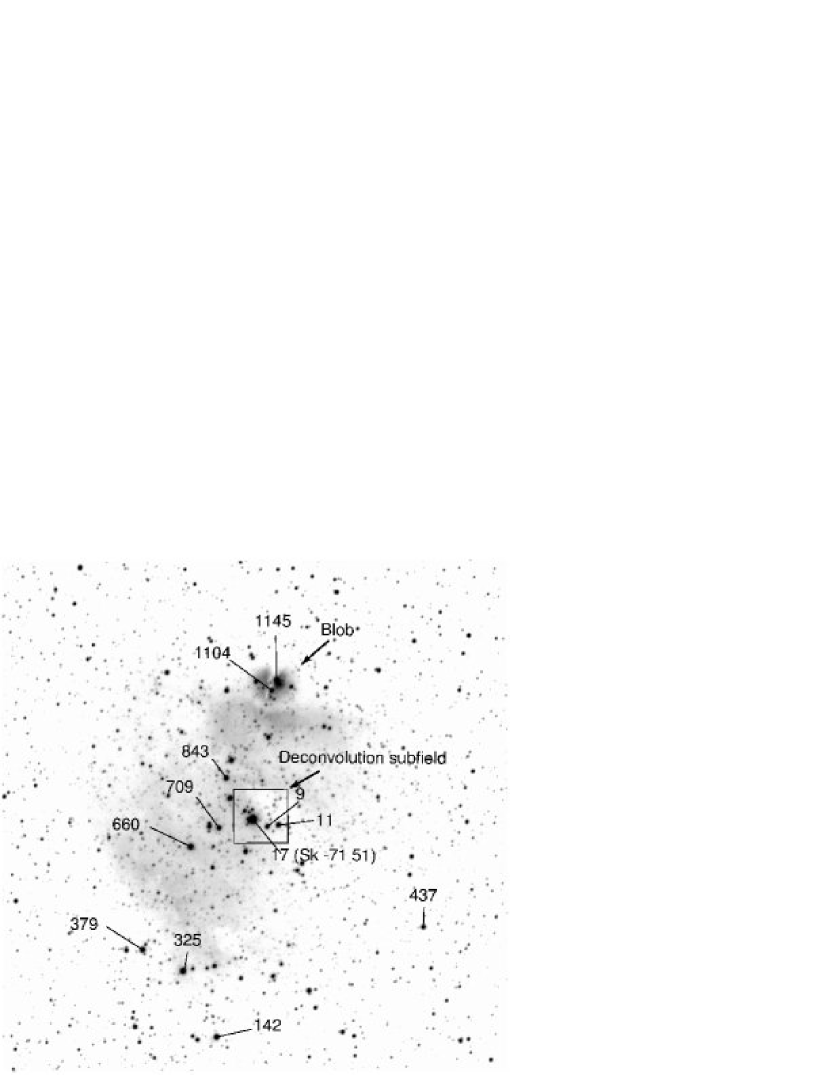
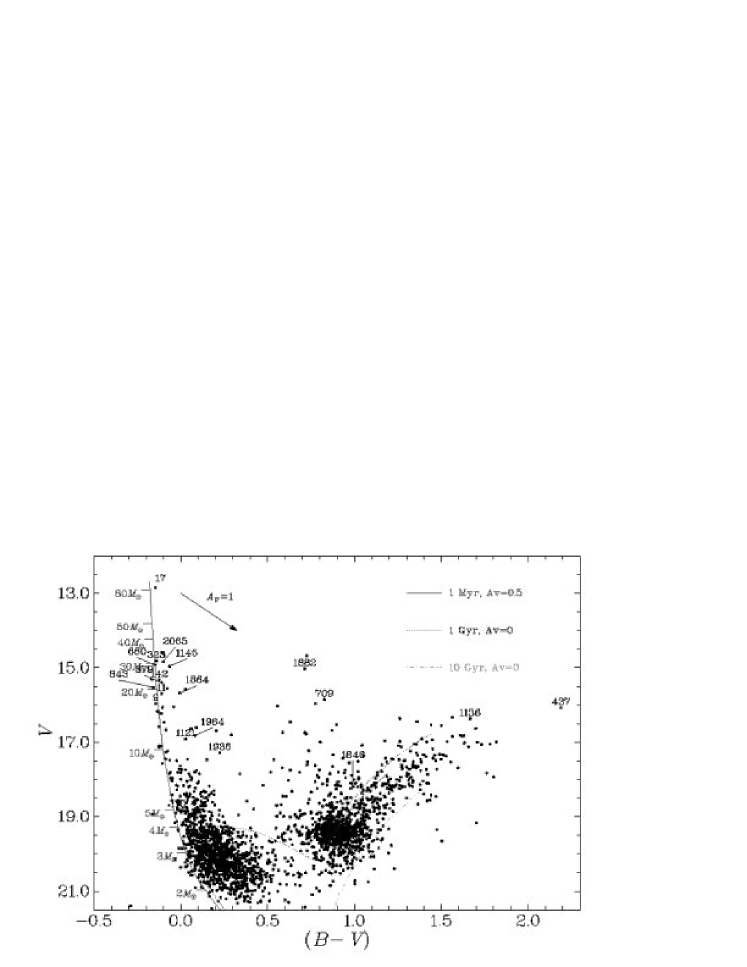
A composite, six-color image of the whole N 214C field is displayed in Fig. 1, while Fig. 2 shows a subfield in , where the most conspicuous stars are labelled. The corresponding color-magnitude diagram is displayed in Fig. 3, and discussed in Sect. 5.
| mag | B | V | R |
|---|---|---|---|
| 14 | 0.007 | 0.014 | 0.018 |
| 15 | 0.012 | 0.016 | 0.021 |
| 16 | 0.014 | 0.016 | 0.022 |
| 17 | 0.019 | 0.025 | 0.030 |
| 18 | 0.029 | 0.031 | 0.040 |
| 19 | 0.044 | 0.047 | 0.066 |
| 20 | 0.078 | 0.082 | 0.107 |
| 21 | 0.149 | 0.144 | 0.222 |
2.2 Image restoration
Sk -71 51 , the most prominent star of the field, lies in a
crowded area. In order to obtain reliable photometry for this star,
we performed a deconvolution on a subfield centered on the star.
We used the MCS deconvolution
algorithm, originally proposed by Magain et al. (1998).
The strength of this code is that it takes the
finite resolution of CCDs into account and ensures that the Shannon
sampling theorem is not violated during the deconvolution
process: in particular the final PSF is chosen so that it remains
well sampled by the pixels (fwhm 2 pixels).
This allows accurate photometry and
astrometry with minimum deconvolution artefacts
for any blended sources, provided that the PSF of the
original image is adequately oversampled and that the S/N ratio of the
sources to be deconvolved remains high enough.
We had successfully used this algorithm, in its original
implementation, for one of our previous works (Heydari-Malayeri et al., 2003). The
present work makes use of an improved version of the MCS algorithm,
allowing simultaneous PSF determination and photometry in dense
stellar fields (Magain et al., 2005).
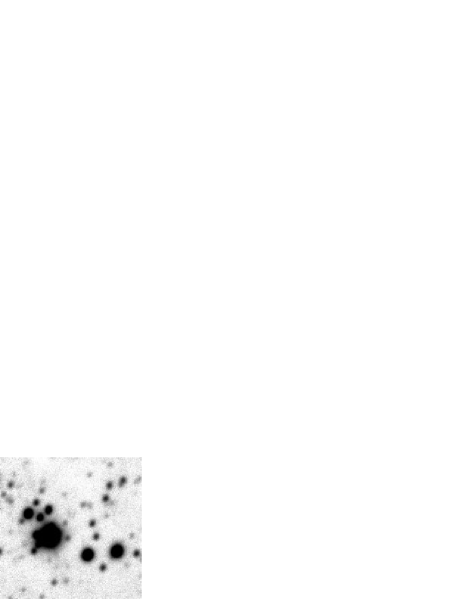
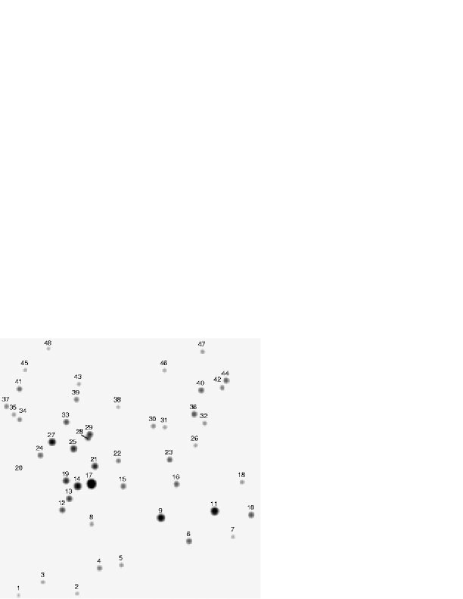
The original data are a set of 12 frames, 2562 pixels each (21′′.8 2 on the sky) extracted from the , and individual flat-fielded frames described earlier. Unfortunately 2 of the 4 frames were found to be problematic: one because of a meteoric trace close to faint sources, and the other because of saturation of a few pixels. We conservatively chose not to consider those two frames for deconvolution, which reduces the set to: 4 frames, 2 frames, and 4 frames. After subtraction of the nebular background using sextractor (Bertin & Arnouts, 1996), the 10 frames have been processed simultaneously: the astrometry was assumed to be identical on each frame, with a small relative shift. Finally the output consists of 10 photometry values and a pair of coordinates for each source: the mean value in each filter is computed afterwards, the spread of values giving an estimate of the uncertainty on instrumental magnitudes with this method. As a result, the subfield is resolved into 48 stars, labelled from 1 to 48 (Fig. 4), the photometry of 44 among them is given in online Table LABEL:tab:deconvolution.
2.3 Spectroscopy
The EMMI spectrograph attached to the ESO NTT telescope was used on 28
and 30 September 2002 to obtain several long slit spectra of the
stars. The grating was # 12 centered on 4350 Å (BLMRD mode)
and the detector was a Tektronix CCD TK1034 with 10242 pixels of
size 24 m. The covered wavelength range was 3810–4740 Å
and the dispersion 38 Å mm-1, giving fwhm
resolutions of
pixels or Å for a 1′′.0 slit. At each position
we first took a short 5 min exposure followed by one or two longer 15
min exposures. The instrument response was derived from
observations of the calibration stars LTT 7379, LTT 6248, and LTT 7987.
The seeing conditions were very good, varying
between 0′′.4 and 0′′.5.
The identification of the stars along the
slits was based on monitor sketches drawn during the observations.
However, in order to avoid ambiguous identifications more especially
in crowded regions, we also worked out a small IRAF task,
using the position angle information in the FITS headers.
First, each spectrum
was integrated along the dispersion axis, the result being stored into
a two-pixel wide strip, which is close to the actual size of the slit.
Then, the position angle and the pixel-arcsec correspondence were used
to calculate the rotation matrix for the World Coordinate System (WCS).
This allowed creation of a slit chart, an - calibrated
two-dimensional image containing accurate slit orientations.
Displaying simultaneously the slit chart beside the SuSI images and
using the WCS correlations it was possible to accurately check the
identity of the star in the slit.
EMMI was also used to obtain nebular spectra with grating
# 8 (4550-6650 Å) in the REMD mode. The detector was CCD # 63,
MIT/LL, 2048 4096 pixels of 15m2 each.
A number of spectra were obtained with the slit set in
east-west and north-south orientations using a basic exposure time
of 300 sec repeated several times. These spectra were used to calibrate
the line ratio maps H/H and [O iii]/H which are
based on imaging (See Sect. 3.2 and 3.3).
The stellar spectra were extracted using the specres iraf task (Lucy & Walsh, 2003), part of the stecf iraf package (http://www.stecf.org/software/stecf-iraf/). This procedure uses an iterative technique involving Lucy-Richardson restoration to avoid contamination from the inhomogeneous nebular background.
3 Results
3.1 General morphology
N 214C is the most prominent H emission nebula of the OB association
LH 110 (Fig. 1). It extends over
3′.5 ( 52 pc) along the north-south direction while
its mean size along east-west is less than 2′.5 (38 pc),
becoming narrower in its southern part.
The bulk of stars making up LH 110 is visible in Fig. 1,
and in particular a tight cluster can be seen around
05:42:02, 71:18:20.
At the center of the nebula lies Sk , the region’s brightest and
hottest star (Walborn et al., 2002). At a distance of
15′′ north of Sk runs a long arc of
shocked gas with a curvature pointing to the star. There are a
dozen less bright stars scattered across the nebula and mainly around
Sk . The green color in the composite image (Fig. 1)
covering the bulk of the H ii region comes from the high excitation
forbidden line [O iii] 5007.
Moreover, several fine, filamentary structures and fine
absorption pillars and features are visible. The eastern or more
particularly the south-eastern boundaries
of the H ii region exhibit a rim structure, evoking a cavity filled
with ionized gas. There is however a nebular extension toward
the south-east
where three relatively bright stars are present
(# 325, # 379, # 142) and the emission is mostly due to H.
We also see a relatively large loop of
ionized gas which protrudes from the north-west and bends to join
the main body of the nebula at its southern part.
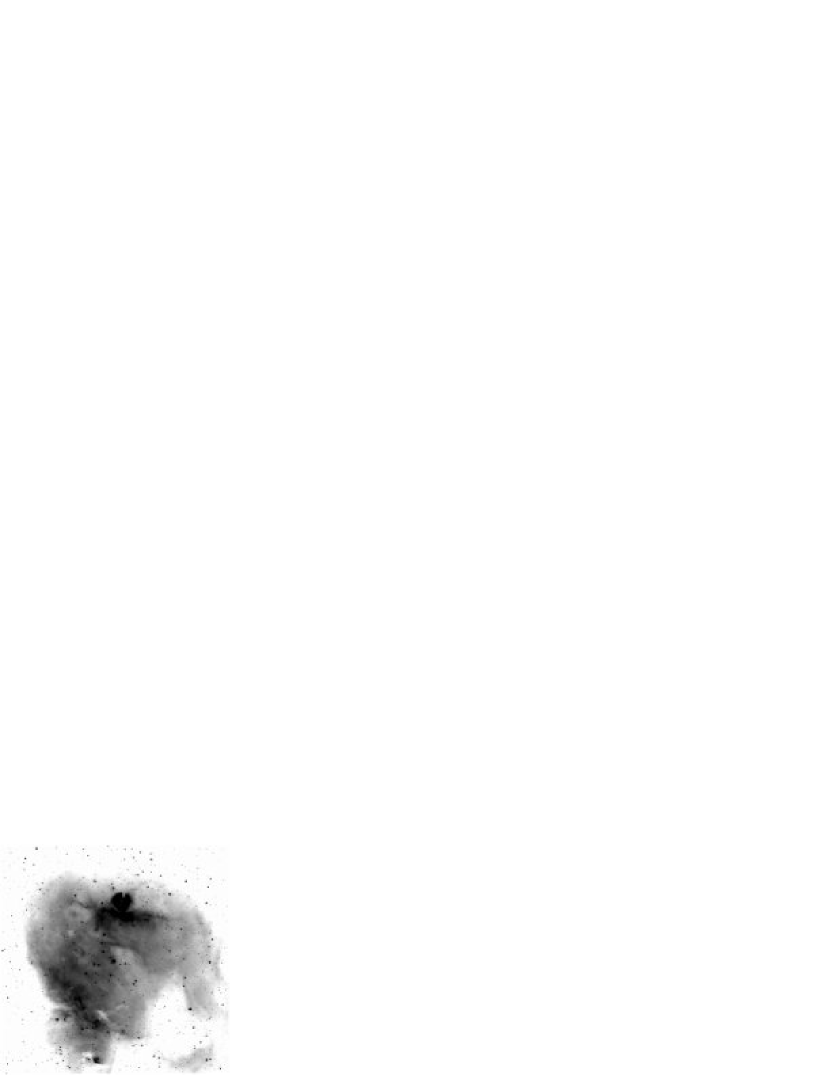
An H image with much deeper cut Fig. 5 shows
a remarkable symmetry of the nebular structures with respect to
Sk as far as the bright ridges to the north
and south are concerned. The H ii region appears to
be “breaking out”, i.e. encountering lower densities, to the
east and west. There may be dense clouds north and south.
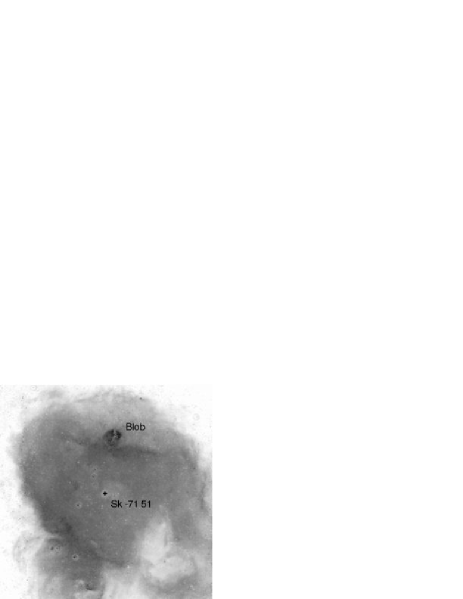
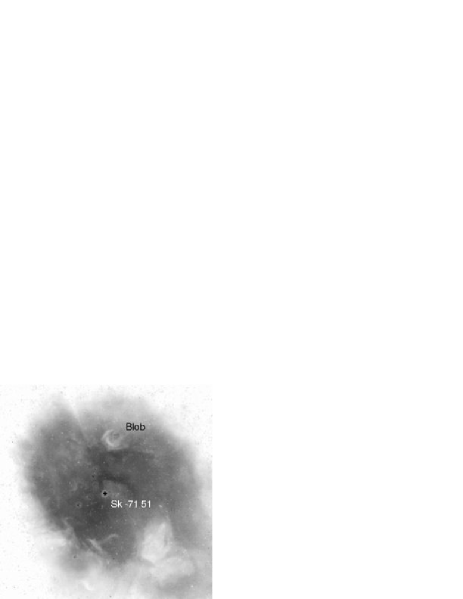
A remarkable feature of N 214C is the presence of a globular blob of
ionized gas at 60′′ ( 15 pc in projection) north of Sk
to which attention was drawn by Walborn et al. (2002). It appears
as a sphere of radius 5′′ ( 1.3 pc) split into two
lobes by a dust lane which runs
along an almost north-south direction (Fig. 6).
The absorption lane
is 1′′ wide in its southern part and
becomes larger
toward the north, reaching a width of 3′′.5 ( 0.9 pc). The
western lobe has a bright emission peak not only in the Balmer
H and H recombination lines, but also in the higher excitation
[O iii] 5007 line. Several stars are seen toward the face of the
H ii blob, the brightest one (# 1145) appears to lie 2′′.4
( 0.6 pc) north of the peak zone at the border of the dark lane.
We see another conspicuous star (# 1104) at 3′′.9 ( 1 pc)
south of the emission peak. And there is also a faint star (# 1132)
lying apparently toward the center of the blob.
More generally, the blob seems to be
placed on a ridge of ionized gas. The ridge follows the structure of
the blob implying a possible interaction, and runs on both sides
of the blob over 80′′ on the sky, corresponding to
20 pc in projection.
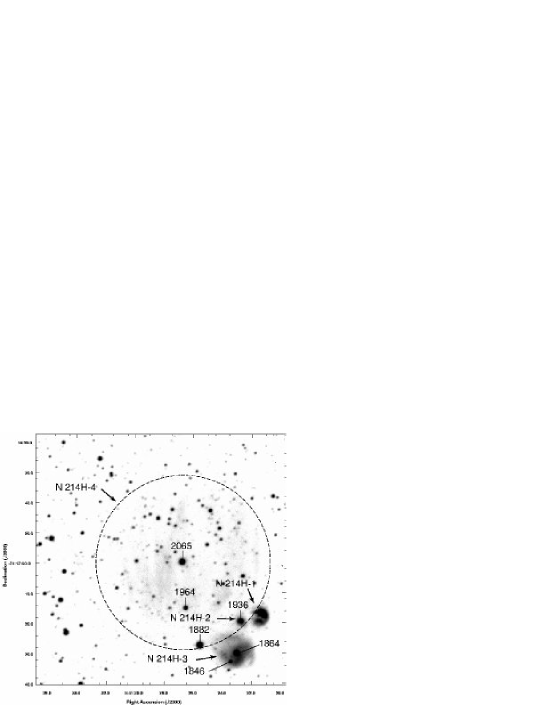
The observations also resolve the LHA 120-N 214H component which lies north-west of N 214C at a distance of 130′′ ( 33 pc) from the blob (Fig. 7). We show that N 214H consists in fact of four unknown, compact H ii regions hosting exciting stars and a diffuse nebula surrounding star # 2065. Tentatively, we call these anonymous nebulae N 214H-1, 2, 3, and 4. N 214H-1 has a structure identical to that of the blob, in miniature!

3.2 Extinction
Fig. 8 displays the extinction map of the N 214C region
obtained from the Balmer decrement H /H ratio.
The most extincted part of the nebula is
the absorption lane where the ratio reaches a value of
10 corresponding to 3.5 mag. It should be underlined
that this estimate is likely a lower limit because the H /H
ratio samples outer zones. Moreover, the Balmer ratio is not a good
extinction indicator in this particular case since the exciting star
lies above the lane between the blob and the observer. Outside the lane,
the ratio is on average
5.5 ( = 1.8 mag) and even reaches 6.2 ( = 2.2 mag)
toward the bright peak of the western lobe. The ridge on which
the blob apparently lies also has a relatively high ratio reaching sometimes
4.7 ( = 1.4 mag).
Another notable reddened area is the south-eastern border of N 214C
where the ratio fluctuates around 4 ( = 0.9 mag) and reaches
as high as 4.3 ( = 1.1 mag). The ratio is significantly
smaller and almost uniform toward other areas of the H ii region and
attains a value of 3 ( = 0.1 mag) in the area surrounding
the hot star Sk . The external loop structure also has a remarkable
reddening, in average 3.5, corresponding to = 0.6 mag.
Note that previous extinction estimates toward
N 214C obtained through 4′.9 apertures yield the following global,
smoothed results: A(H) = 0.15 mag, A(H -radio) = 0.34
mag, A(1500 Å-FIR) = 1.10 mag, and
A(1900 Å-FIR) = 0.66 mag (Caplan & Deharveng, 1985, 1986; Bell et al., 2002).
3.3 Excitation
The [O iii] (5007 Å)/H ratio (Fig. 8)
has a uniform value of about 5
over an extended area centered on Sk . In particular, the narrow nebular
arc situated north of Sk can be distinguished by its slightly
higher value of 5.5. The ridge on which the blob seems to lie has
a ratio between 4 and 5.
Regarding the ionized blob, the western lobe has a higher [O iii]/H ratio attaining a value of 5.3 at most toward the bright emission area. This higher excitation zone is centered on star # 1145 but cut by the dust lane. The eastern lobe has a smaller mean value of 3.5 and rises to 3.8 toward the north-eastern part of the lobe.
3.4 Multiplicity of Sk –71
Although it was known that Sk is not a single
star but a compact cluster (Garmany & Walborn, 1987), its
attributed luminosity was based on low-resolution
observations obtained using a 61 cm telescope
with an aperture 18′′ in size (Isserstedt, 1975).
Apart from the fact that Sk is a tight cluster, the presence of
a relatively bright star (# 9), detached from the main cluster but
possibly present in the aperture, leads to an overstimation of the
magnitude.
The result of the image restoration by deconvolution, as explained in Sect. 2.2, for a 2562 pixels field, corresponding to 21′′.82 on the sky, centered on Sk , is presented in Fig. 4 and listed in Table LABEL:tab:deconvolution which also gives the astrometry and photometry of the stars. The tight core of the Sk cluster, covering a 4 ′′ area, is made up of at least 6 components, stars # 17, 14, 21, 19, 13, and 12. The brightest component, # 17 with , , and mag, is separated by 1′′ from the second brightest star, # 14 with , , and mag. Interestingly, the and magnitudes for star #17 agree well with Oey (1996)’s results. We notice that the present higher resolution data reduce the brightness of Sk by 0.14 mag with respect to (Isserstedt, 1975): , , mag.
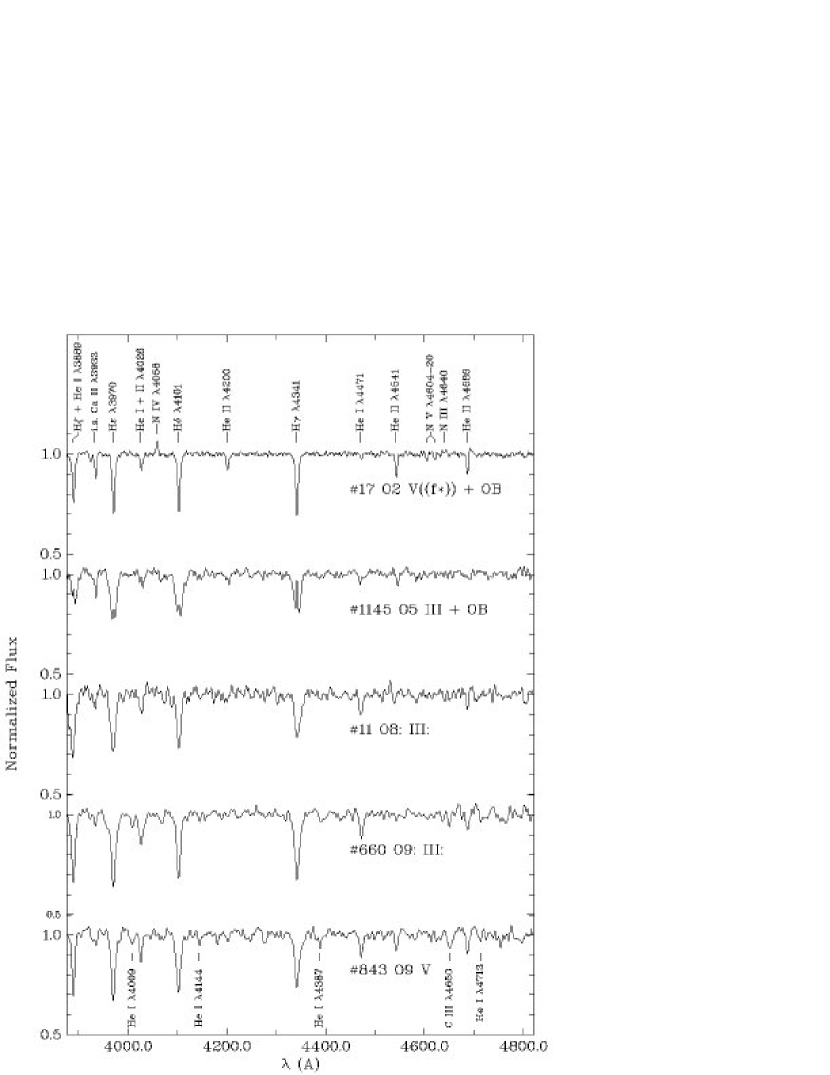
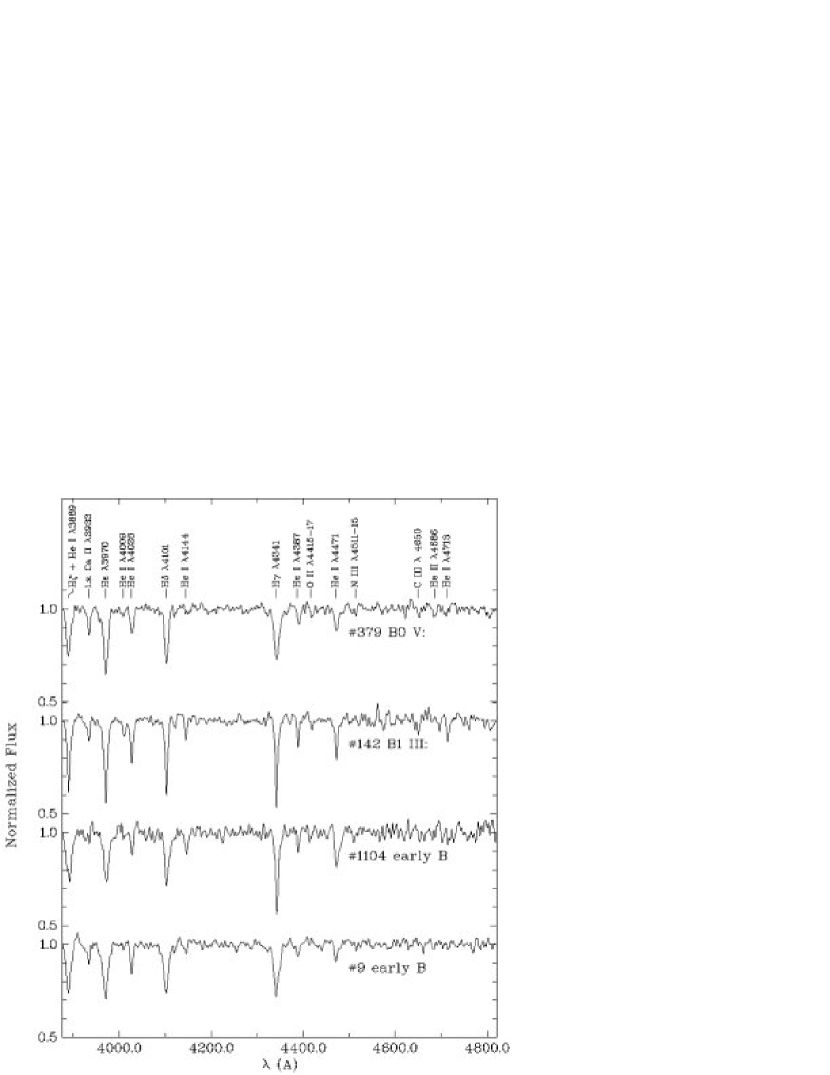
3.5 Spectral types
The stars for which the spectroscopy was obtained are indicated in Fig. 2, while the spectrograms are displayed in Figs. 9 and 10. The spectral classification was performed without knowledge of the stellar identifications or locations, with reference to the criteria and atlas of Walborn & Fitzpatrick (1990). The results are summarized in Table LABEL:tab:classification which also gives the corresponding photometric and astrometric information. In the following some details of the two most interesting cases are given.
3.5.1 Star Sk
Star #17 is the brightest component of the Sk cluster
(Table LABEL:tab:deconvolution).
The spectral classification of Sk has changed several
times as a function of the quality of the spectra used. Initially it
was classified as an early type dwarf, O4 V (Conti et al., 1986), but
subsequently was revised to an earlier giant O3 III(f*)
(Garmany & Walborn, 1987). More recently,
Sk was classified as O3 V((f*)) by Walborn et al. (2002).
The present higher S/N ratio spectra indicate an even earlier
main sequence star of type O2 V((f*)) due to a large
N iv ( 4058)/N iii ( 4640) ratio. Note also the
presence of He ii 4686 P Cyg profile.
The presence of the He i 4471 line suggests an OB companion;
it is quite possible that the He i line arises in the close resolved
companions, similarly to the case of LH10-3209
(Walborn et al., 1999). However, contamination by
unresolved close components can not be excluded.
Assuming an intrinsic color of = –0.32 mag for early O type
stars (Walborn et al., 2002) and a distance modulus of 18.6 mag, the
absolute magnitude of star # 17 is MV = –6.28.
3.5.2 Star # 1145
Of spectral type O5 III + OB, this is the brightest star
(, mag) apparently
associated with the blob. The doubled line profiles in its spectrogram
suggest a spectroscopic binary with
v 530 km s-1.
The companion dominates at He i 4471 but the primary at
He i + ii 4026.
| Star | Spectral type | Notes | ||||||
|---|---|---|---|---|---|---|---|---|
| (J2000) | (J2000) | (mag) | (mag) | (mag) | ||||
| 9 | 05:41:38.48 | –71:19:59.1 | 15.96 | –0.14 | –0.07 | early B | ||
| 11 | 05:41:37.60 | –71:19:58.6 | 15.70 | –0.11 | –0.06 | O8: III: | ||
| 17 | 05:41:39.62 | –71:19:56.4 | 12.85 | –0.15 | –0.06 | O2 V((f*)) + OB | Main component of Sk | |
| 142 | 05:41:42.54 | –71:21:19.4 | 15.32 | –0.12 | –0.03 | B1 III: | ||
| 325 | 05:41:45.19 | -71:20:54.2 | 14.81 | -0.14 | -0.03 | |||
| 379 | 05:41:48.37 | –71:20:46.1 | 15.40 | –0.11 | –0.03 | B0 V: | ||
| 437 | 05:41:26.14 | -71:20:37.8 | 16.07 | 2.19 | 1.22 | |||
| 660 | 05:41:44.53 | –71:20:06.8 | 14.92 | –0.15 | –0.03 | O9: III: | ||
| 709 | 05:41:42.29 | –71:19:59.7 | 15.85 | 0.83 | 0.55 | late-type | ||
| 843 | 05:41:41.70 | –71:19:40.6 | 15.53 | –0.16 | –0.04 | O9 V | ||
| 1104 | 05:41:59.18 | –71:19:20.4 | 20.01 | 0.37 | 0.18 | early B | Associated with the Blob | |
| 1121 | 05:41:36.51 | -71:19:05.8 | 16.91 | 0.03 | 0.12 | Seen toward the western lobe | ||
| 1132 | 05:41:38.16 | -71:19:04.3 | 19.41 | 0.05 | 0.12 | Seen toward the center of the Blob | ||
| 1136 | 05:41:39.30 | -71:19:03.9 | 16.37 | 1.66 | 0.98 | Seen toward the eastern lobe | ||
| 1145 | 05:41:37.68 | –71:19:03.2 | 14.96 | –0.06 | 0.04 | O5 III + OB | Associated with the Blob | |
| 1846 | 05:41:23.32 | -71:17:32.8 | 18.19 | 0.99 | 0.56 | Associated with N 214H-3 | ||
| 1864 | 05:41:22.89 | -71:17:29.8 | 15.68 | -0.00 | 0.01 | Associated with N 214H-3 | ||
| 1882 | 05:41:25.43 | -71:17:27.2 | 15.03 | 0.71 | 0.41 | See Fig. 7 | ||
| 1936 | 05:41:22.58 | -71:17:19.2 | 17.28 | 0.22 | 0.18 | Associated with N 214H-2 | ||
| 1964 | 05:41:26.39 | -71:17:14.8 | 16.81 | 0.08 | 0.13 | Associated with N 214H-4 | ||
| 2065 | 05:41:26.61 | -71:16:59.5 | 14.84 | -0.10 | -0.06 | Associated with N 214H-4 |
4 Discussion
4.1 Stellar content
The H ii region N 214C lies in the OB association LH 110
of size 3′ 2′ (Lucke & Hodge, 1970), in which the latter
authors detected seven OB candidates.
The color-magnitude diagram obtained for 2341 stars of the OB association
is displayed in Fig. 3. Overplotted are also
the isochrones with ages 1 Myr, 1 Gyr, and 10 Gyr
for metallicity Z = 0.008 obtained by Lejeune & Schaerer (2001).
Two main stellar populations show up in this diagram: a main sequence
and an evolved component. The main sequence, well fitted by
an isochrones of age 1 Myr with a reddening of mag,
is made up of stars
with initial masses from 80 to 4 and possibly
as low as 2 . The color spread for the lower mass main
sequence stars may be due to either the reddening effect or
contamination by the evolved stars.
The evolved population consists of stars which are well fitted
by a 1 Gyr isochrone, corresponding to a turnoff mass between
1.9 and 2.0 . Stars less massive than the turnoff mass have
colors between 0.0 and 0.5 mag, whereas more massive stars are
centered on 1 mag.
Note that the 10 Gyr track is tangent to the redder border of the
evolved population, probably indicating that the bulk of the
stars are better fitted by a much younger, 1 Gyr isochrones.
Star # 709 is evolved, as indicated by its spectrum presenting features
typical of evolved low-mass stars. This result is supported by the
position of the star on the color-magnitude diagram.
Its absolute magnitude, , would point to a late-type
M giant. This star is quite interesting since it lies on the face of
the H ii region N 214C not far from the Sk cluster.
Generally speaking, several stars seen directly toward N 214C
belong to the evolved population. Do they really pertain to this
region, or are they field stars? Radial velocity determinations
are necessary to answer this question. Another remarkable case is
star # 437, which has the reddest colors of the sample
(see also Table LABEL:tab:classification). It lies toward the
loop structure of N 214C (Sect. 3.1) where the reddening, while not
negligible, is not enough to explain the strong colors measured
for # 437. Comparison with the intrinsic and colors
(Houdashelt et al., 2000) suggests an evolved low-mass, field star
likely affected by local extinction.
The fact that the H ii blob lies toward the northern
outskirts of N 214C and the compact H ii regions N 214H-1, 2, and 3
are situated in that area, suggests that the detected molecular cloud
(Israel et al., 1993; Heikkila et al., 1998) is in contact with the ionized gas in
that direction. This assumption
agrees with the observation that stars # 1882 and # 1846 have a
red color (Fig. 3). Note also that stars
# 1936 and more especially # 1964, the latter situated
in the diffuse, and maybe older H ii region N 214H-4, have a smaller
reddening, because they may be less affected by the molecular cloud.
The upper part of the main sequence is populated by massive O and B
types several of which have been classified in this work.
These stars, seen on the face of the H ii region N 214C, are associated
with the H ii region and therefore contribute to its ionization.
Their initial masses are 40 , with a very remarkable exception:
star # 17 with a mass of 80 if single. This main component
of the Sk cluster is a very hot star of type O2 V((f*)), recently
introduced by Walborn et al. (2002). This type is very rare since so far only
a dozen members have been identified. Should star # 17
not be fully resolved, as implied by the presence of He i 4471
in its spectrum, its mass must be smaller than 80 .
Note however that the later-type OB signature may be due to stars # 14
or # 21 lying 1′′.2 and 1′′.4 respectively from # 17 and not
to a binary companion. In that case, the estimated mass
of 80 based only on photometry, will be maintained.
Radial velocity observations may elucidate
the situation. Anyhow, star # 17, as the main excitation source of
N 214C, should have a powerful wind, as revealed by the presence of
wind and shock features created in the nebula around the star
(Sect. 3.1).
The blue star # 325 associated with the south-eastern extension of N 214C must be an O type of initial mass 30–40 , as indicated by the color-mag diagram. Although we do not have spectroscopic observations, the fact that the star is surrounded by [O iii] emission in a region globally dominated by H emission supports an O type characteristic. Note that stars # 379 and # 142, which are classified B0 V: and B1 III: (Fig. 10, Table LABEL:tab:classification and lie toward the same region as # 325, are not associated with [O iii] emission due to the lack of sufficiently hard ionizing photons in B stars.
4.2 The peculiar Blob
The compact H ii nebula located 60′′ north of Sk has
a striking spherical shape of 5′′ ( 1.3 pc) in radius.
Its mass would be 100 , assuming a sphere of 1 pc in radius
filled with atomic hydrogen of density 1000 cm-3.
The excitation of the blob may be mainly due to star # 1145,
type O5 III + OB, which probably lies outside the sphere.
The fact that the bright emission peak, where the
[O iii]/H ratio has its highest value, lies close
to # 1145 confirms the exciting role of this star. This result is also in
line with high-resolution radio continuum observations at 3 cm (8.6 GHz)
and 6 cm (4.8 GHz) obtained using the Australia Telescope Compact Array
(Indebetouw et al., 2004). These observations indicate the presence of a
compact, ionized region (B0542-7121) at the position of the blob with
radio continuum fluxes and mJy at 3 and 6 cm
respectively. These measurements correspond to a Lyman continuum flux
of 4.80 1048 photons s-1 assuming that the H ii region
is ionization bounded. The exciting star needed to provide this flux
is about O9 V type (Vacca et al., 1996).
The discrepancy between this estimate and the spectral classification
(O5 III star) can be explained by
the fact that the star is outside the blob, so only a fraction
of its radiation intercepts in.
In case an ionizing source
is hidden in the blob the extinction should be so strong that no Lyman
continuum photons can escape.
The radio continuum observations confirm also that
star # 1104, an early B, does not have a major role in the
ionization of the blob. On the other hand, there is a faint star
# 1132 seen toward the center of the blob in the dark opening,
but this is most likely a foreground, blue star of mag.
The fact that no hidden exciting source is expected does not preclude
the presence of an internal infrared object. And, interestingly, a
strong IRAS source, 05423-7120, coincides with the blob
(Indebetouw et al., 2004).
The measured fluxes ( = 0.84 Jy, = 3.91 Jy,
= 45.74 Jy, and 110.80 Jy) correspond to a
luminosity of 2 105 as
derived from the 60 m flux. This estimate implies a massive heat
source, equivalent to an embedded O7 V star of mass 40 .
The IRAS data can be fitted by a blackbody with K whose maximum
is centerd on 60 m.
This suggests that there is indeed an embedded massive star not
just a cold collapsing gas clump whose spectral energy distribution
would probably peak at or beyond 100 m.
There is however an excess emission at 12 m. Although the
excess in some cases could be due to a component of very small
grains or polycyclic aromatic hydrocarbons (Degioia-Eastwood, 1992; Bell et al., 2002),
it could also be due to the presence of a hotter source
(Wolf-Chase et al., 2003). The latter suggestion is in line with
the expectation that the putative object is most likely not isolated but
embedded in an infrared cluster.
Alternatively, an accreting
protostar cannot be ruled out. In that case a very massive protostar
( 100 ) with a high accretion rate
( 10-3 yr-1) is
required. Another possibility would be a trapped ultracompact H ii
region created immediately following high mass star formation (Keto, 2002).
This would imply a low radio luminosity compared to
the total luminosity reradiated by dust, suggesting also that the
object might be so heavily obscured that it emits mainly in far
infrared. If this putative object exists, it would be interesting to
determine its near- and mid-infrared properties using high spatial
resolution observations.
The compact H ii region discovered in N 214C may be a newcomer
to the family of HEBs (High Excitation Blobs)
in the Magellanic Clouds, the first member of which was detected in
LMC N 159 (Heydari-Malayeri et al. (1999b) and references therein). In contrast to the typical
H ii regions of the Magellanic Clouds, which are extended structures
spanning several minutes of arc on the sky (more than 50 pc) and powered by a
large number of hot stars, HEBs are dense, small regions usually
5′′ to 10′′ in diameter (1 to 3 pc). Moreover, they often
form adjacent to or apparently inside the typical giant H ii regions,
and rarely
in isolation. They are generally affected by significant amounts
of local dust. The formation mechanisms of these objects are not yet
well understood, in the sense that we do not know which particular
conditions can give rise to them adjacent to typical Magellanic
Cloud H ii regions. One thing seems however sure, they represent the youngest
massive stars of their OB associations. So far only a half-dozen
of them have been detected (SMC N 81, N88A; LMC N 159, N 83B, N 11A,
N 160A1 & A2) and studied using the Hubble Space Telescope
(Heydari-Malayeri et al., 1999c, a, b, 2001b, 2001a, 2002a, 2002b).
But the exciting stars of the tightest or youngest
members of the family remain undetected even with the HST
angular resolution in the visible.
The unusual spherical shape of the blob may be due to lack of
angular resolution, if we compare it with the Galactic H ii region
NGC 2024 (Flame nebula), which has a linear radius of
1.5 pc,
comparable to the H ii blob.
The optical image of NGC 2024 also shows a central elongated obscuration
in the north-south direction (see Lenorzer et al. (2004) and references
therein). There is a B-type infrared cluster behind the dust lane, and
recently Bik et al. (2003) estimated a spectral type of O8
for the dominant source of ionizing flux for the H ii region.
In spite of these apparent similarities,
two important differences distinguish the N 214C blob from NGC 2024.
The most massive star of the latter is an O8 type accompanied by
a cluster of B types, while the blob is associated with a more massive
star of type O5 III + OB (# 1145). Moreover, the blob lies in a
prominent region which has formed several O types and more especially
a very rare, massive, and hot star of type O2 V. These characteristics
call for high-resolution infrared observations of the blob in order
to investigate deep into the blob, specifically behind the absorption
lane. It would be very interesting if the embedded stellar population of
the blob turns out to be similar to that of NGC 2024. This will imply
that sharply different environmental factors (for instance metallicity
and initial mass function) can bring about similar stellar populations
under certain conditions. Knowing these particular conditions will be
important for better understanding star and cluster formation.
The ridge feature upon which the H ii blob seems to lie, may
in fact be an ionization front moving northward into the molecular cloud.
If this assumption is right, the blob may have resulted from
massive star formation following the collapse of a thin shell of neutral
matter accumulated between the shock and ionization fronts, as
predicted by the sequential star formation scenario (Elmegreen & Lada, 1977).
A list of carefully selected Galactic candidate regions which are likely
to be examples of this star formation process is presented by
Deharveng et al. (2005). Based on HST observations, this scenario
has also been
suggested for LMC N 83B (Heydari-Malayeri et al., 2001b). Since star # 1145 and
the blob lie apparently close to each other, one can raise the question
whether that star also is triggered by the ionization front of star # 17.
Star # 1145 (O5 III + OB) is less massive than # 17 (O2 V + OB) and
should naturally evolve more slowly than the latter. Yet the luminosity class
of # 1145 seems to imply the contrary. It should be underlined that
the luminosity class III means that the absorption feature
He i 4686 is filled in by emission. But this description of the
spectrum could have different physical causes. Usually
that is due to higher luminosity, but anything that produces the
He i 4686 emission will fill it in, e.g. loose material/colliding
winds in the binary. Therefore, one cannot rule out the possibility that
# 1145 be a second generation star triggered by # 17.
Fig. 5 reveals another ridge southeast of N 214C,
suggesting that the H ii region is in contact with a molecular cloud also
in that direction. Since the massive stars # 142, # 325, and # 379
are apparently situated beyond the south-eastern ridge,
the question of sequential star formation can similarly be
raised for them.
Acknowledgements.
We are grateful to Drs. P. Magain, F. Courbin and their team for giving us access to their new deconvolution code and for their hospitality at their Institute in Liège. We are also indebted to Dr. J. Walsh (ST-ECF) for his tool, specres, and the useful advices about its use. We are also thankful to Dr. L. Germany (ESO, NTT) for providing valuable customized calibration data, which greatly improved our data reduction. We are also grateful to Drs. Lise Deharveng (Laboratoire d’Astrophysique de Marseille), Thibaut Le Bertre (LERMA, Paris Observatory), and Hans Zinnecker (Astrophysikalisches Institut Potsdam) for discussions. We would like also to thank the referee, Dr. Paul Crowther, for helpful remarks and comments.References
- Bell et al. (2002) Bell, E. F., Gordon, K. D., Kennicutt, R. C., & Zaritsky, D. 2002, ApJ, 565, 994
- Bertin & Arnouts (1996) Bertin, E. & Arnouts, S. 1996, A&AS, 117, 393
- Bik et al. (2003) Bik, A., Lenorzer, A., Kaper, L., et al. 2003, A&A, 404, 249
- Caplan & Deharveng (1985) Caplan, J. & Deharveng, L. 1985, A&AS, 62, 63
- Caplan & Deharveng (1986) Caplan, J. & Deharveng, L. 1986, A&A, 155, 297
- Chin et al. (1997) Chin, Y.-N., Henkel, C., Whiteoak, J. B., et al. 1997, A&A, 317, 548
- Conti et al. (1986) Conti, P. S., Garmany, C. D., & Massey, P. 1986, AJ, 92, 48
- Davies et al. (1976) Davies, R., Eliott, K., & Meaburn, J. 1976, Mem. R. Astron. Soc., 81, 89
- Degioia-Eastwood (1992) Degioia-Eastwood, K. 1992, ApJ, 397, 542
- Deharveng et al. (2005) Deharveng, L., Zavagno, A., & Caplan, J. 2005, A&A, 433, 565
- Elmegreen & Lada (1977) Elmegreen, B. G. & Lada, C. J. 1977, ApJ, 214, 725
- Garmany & Walborn (1987) Garmany, C. D. & Walborn, N. R. 1987, PASP, 99, 240
- Groenewegen & Oudmaijer (2000) Groenewegen, M. A. T. & Oudmaijer, R. D. 2000, A&A, 356, 849
- Heikkila et al. (1998) Heikkila, A., Johansson, L. E. B., & Olofsson, H. 1998, A&A, 332, 493
- Henize (1956) Henize, K. G. 1956, ApJS, 2, 315
- Heydari-Malayeri et al. (2002a) Heydari-Malayeri, M., Charmandaris, V., Deharveng, L., et al. 2002a, A&A, 381, 941
- Heydari-Malayeri et al. (2001a) Heydari-Malayeri, M., Charmandaris, V., Deharveng, L., et al. 2001a, A&A, 372, 527
- Heydari-Malayeri et al. (2001b) Heydari-Malayeri, M., Charmandaris, V., Deharveng, L., et al. 2001b, A&A, 372, 495
- Heydari-Malayeri et al. (1999a) Heydari-Malayeri, M., Charmandaris, V., Deharveng, L., Rosa, M. R., & Zinnecker, H. 1999a, A&A, 347, 841
- Heydari-Malayeri et al. (2003) Heydari-Malayeri, M., Meynadier, F., & Walborn, N. R. 2003, A&A, 400, 923
- Heydari-Malayeri et al. (1999b) Heydari-Malayeri, M., Rosa, M. R., Charmandaris, V., Deharveng, L., & Zinnecker, H. 1999b, A&A, 352, 665
- Heydari-Malayeri et al. (2002b) Heydari-Malayeri, M., Rosa, M. R., Schaerer, D., Martins, F., & Charmandaris, V. 2002b, A&A, 381, 951
- Heydari-Malayeri et al. (1999c) Heydari-Malayeri, M., Rosa, M. R., Zinnecker, H., Deharveng, L., & Charmandaris, V. 1999c, A&A, 344, 848
- Houdashelt et al. (2000) Houdashelt, M. L., Bell, R. A., Sweigart, A. V., & Wing, R. F. 2000, AJ, 119, 1424
- Indebetouw et al. (2004) Indebetouw, R., Johnson, K. E., & Conti, P. 2004, AJ, 128, 2206
- Israel (1997) Israel, F. P. 1997, A&A, 328, 471
- Israel et al. (1993) Israel, F. P., Johansson, L. E. B., Lequeux, J., et al. 1993, A&A, 276, 25
- Isserstedt (1975) Isserstedt, J. 1975, A&AS, 19, 259
- Keto (2002) Keto, E. 2002, ApJ, 580, 980
- Lejeune & Schaerer (2001) Lejeune, T. & Schaerer, D. 2001, A&A, 366, 538
- Lenorzer et al. (2004) Lenorzer, A., Bik, A., de Koter, A., et al. 2004, A&A, 414, 245
- Lucke & Hodge (1970) Lucke, P. B. & Hodge, P. W. 1970, AJ, 75, 171
- Lucy & Walsh (2003) Lucy, L. B. & Walsh, J. R. 2003, AJ, 125, 2266
- Magain et al. (1998) Magain, P., Courbin, F., & Sohy, S. 1998, ApJ, 494, 472
- Magain et al. (2005) Magain, P., Courbin, F., Sohy, S., Gillon, M., & Letawe, G. 2005, in prep.
- Oey (1996) Oey, M. S. 1996, ApJS, 104, 71
- Vacca et al. (1996) Vacca, W. D., Garmany, C. D., & Shull, J. M. 1996, ApJ, 460, 914
- Walborn et al. (1999) Walborn, N. R., Drissen, L., Parker, J. W., et al. 1999, AJ, 118, 1684
- Walborn & Fitzpatrick (1990) Walborn, N. R. & Fitzpatrick, E. L. 1990, PASP, 102, 379
- Walborn et al. (2002) Walborn, N. R., Howarth, I. D., Lennon, D. J., et al. 2002, AJ, 123, 2754
- Wolf-Chase et al. (2003) Wolf-Chase, G., Moriarty-Schieven, G., Fich, M., & Barsony, M. 2003, MNRAS, 344, 809