LA-UR-04-5295
Nuclear Reaction Rate Uncertainties and Astrophysical Modeling. II. Carbon Yields from Low-mass Giants.
Abstract
Calculations that demonstrate the influence of three key nuclear reaction rates on the evolution of Asymptotic Giant Branch stars have been carried out. We study the case of a star with an initial mass of 2 and a metallicity of , somewhat less than the solar metallicity. The dredge-up of nuclear processed material from the interior of the star, and the yield predictions for carbon, are sensitive to the rate of the and triple- reactions. These reactions dominate the H- and He-burning shells of stars in this late evolutionary phase. Published uncertainty estimates for each of these two rates propagated through stellar evolution calculations cause uncertainties in carbon enrichment and yield predictions of about a factor of two. The other important He-burning reaction , although associated with the largest uncertainty in our study, does not have a significant influence on the abundance evolution compared to other modelling uncertainties. This finding remains valid when the entire evolution from the main-sequence to the tip of the AGB is considered. We discuss the experimental sources of the rate uncertainties addressed here, and give some outlook for future work.
pacs:
26.20.+fHydrostatic stellar nucleosynthesis, 97.30.HkCarbon stars, S stars, and related types (C, S, R, and N), 97.10.CvStellar structure, interiors, evolution, nucleosynthesis, agesI Introduction
Modern computer codes for stellar evolution calculations solve routinely a nuclear reaction network sufficiently large to account for all relevant nuclear transmutations. Reliable nuclear reaction rates are a crucial ingredient for accurate modelling of the evolution of stars, especially for investigations of the chemical evolution of the stars and of the amount of processed material that is returned to the interstellar medium. Such stellar model results are used for integrated models of the galactic chemical evolution, and for comparison to individual stellar abundance observations.
In spite of the obvious necessity to check the sensitivity of stellar chemical evolution predictions to uncertainties in the underlying reaction rates, little work in this direction has been done recently (Woosley et al., 2003). This is, in particular, true for the evolution of low- and intermediate mass stars () which host important nuclear production sites and contribute significantly to galactic chemical evolution. Two main issues make investigations of the propagation of nuclear reaction rate uncertainties difficult. One is the computationally expensive and numerically difficult nature of the advanced evolutionary phases of low-and intermediate mass stars. The second is that such studies are only useful if consistent estimates of the individual rate uncertainties are available.
We have started a program to address this problem. In Paper I (Stoesz and Herwig, 2003) we investigated the impact of CNO cycle reaction rate uncertainties on the predicted stellar oxygen isotopic ratios. These predictions are important for the astrophysical interpretation of pre-solar meteoritic corundum grains (Huss et al., 1994; Nittler et al., 1997). In Paper I we used a Monte Carlo approach integrated into nuclear network post-processing calculations.
In this second study we focus on the evolution of Asymptotic Giant Branch (AGB) stars and their sensitivity to the rates of three key nuclear reactions: , triple- and . We extend our preliminary results of this project (Herwig and Austin, 2004), and provide a more in-depth presentation. The following sections describe: Sect. II astrophysical background; Sect. III nuclear physics input, its uncertainties and possible revisions; Sect. IV the physical model and methods of the astrophysics simulation, as well as the main elements of AGB evolution that are important here; Sect. V our results as well as additional calculations with a second, independent code that verify the findings; Sect. VI new results for the triple- rate; and Sect. VII results and discussion.
II Astrophysical Context
After the initial H- and He-core burning phases, low- and intermediate mass stars evolve into double-shell-burning giant stars (Iben and Renzini, 1983; Lattanzio and Forestini, 1999). These AGB stars have a unique mechanical structure, as explained in more detail in Herwig (2005). The electron-degenerate core with mass consists of carbon and oxygen (the ashes from previous evolutionary phases) and is about the size of the earth, while the envelope has on average roughly the density of water and extends to several hundred times the radius of the sun. This envelope is unstable against convection, and is thus well mixed.
Recurrent He-shell flashes, with periods of 5 to 10 are a characteristic of these configurations. A combination of partial degeneracy, the small geometric scale of the He-burning shell, and the strong temperature dependence of the triple- reaction rate leads to a thermonuclear runaway that locally generates power of roughly (). Neither heat conduction nor photon radiation are sufficient to carry away the energy, and the layer between the He- and the H-shell becomes convectively unstable.
Part of the energy released in the He-flash will do expansion work, cooling the layers above the He-shell. The stellar opacities in this region at the base of the convective envelope then increase, which forces the envelope deeply into the core (in terms of the Lagrangian mass coordinate, the enclosed mass). This penetration of the envelope convection zone into the processed core material below the the H-burning shell is the third dredge-up.111It follows two dredge-up periods during previous evolutionary phases, which are however less important for the overall chemical enrichment of low- and intermediate mass stars. The details of these events are well documented in the astrophysical literature (Schönberner, 1979; Iben, 1981; Lattanzio, 1986; Hollowell and Iben, 1988; Vassiliadis and Wood, 1993; Blöcker, 1995).
The dredge-up event is responsible for the transfer of nuclear processed material from the high-temperature stellar interior to the low-temperature stellar surface where it can be observed spectroscopically. This material is also blown into the interstellar medium by stellar winds. For these reasons, the strength of the dredge-up is of great importance to the observed chemical enrichment of low-mass giants and their role in galactic chemical evolution.
The amount of dredge-up obtained in stellar models of the AGB stars continues to be a matter of debate. It is well established that the dredged-up amount depends on the core mass, the stellar metallicity and opacity, the model of convection, and the treatment of convective boundaries, as well as on the numerical implementation of several details in the codes (Mowlavi, 1999; Herwig, 2000; Karakas et al., 2002). Earlier studies have already indicated that stronger He-shell flashes are followed by deeper dredge-up (Boothroyd and Sackmann, 1988), and that a decreased energy generation in the H-shell leads to stronger He-shell flashes (Despain and Scalo, 1976). However, there are no investigations of the sensitivity of dredge-up and the envelope abundance evolution to nuclear reaction rate uncertainties.
We focus on the three reactions that dominate H-burning and He-burning respectively. It is well known that the reaction has the smallest rate in the CN cycle; it controls the circulation rate of the CN catalytic material in the H-burning shell. The reaction is weakly active during the interpulse phase between the He-shell flashes. The most important reaction for the He-shell flash is the triple- reaction.
In double-shell burning around degenerate cores several competing time-scales are involved. The period of the He-shell flashes depends mainly on the rate of Helium accretion from the H-burning shell. The strength of the He-shell flash depends on the geometrical size and on the partial degeneracy of the He-shell. A more degenerate and thinner shell results from a longer flash period, which in turn can be caused by the smaller energy generation rate due to a smaller CNO cycle rate. In such a case it takes longer to accrete the required amount of He from the H-burning shell to ignite the flash. Thus, one can qualitatively understand that the H-shell burning rate influences the He-shell flash strength, and thereby the subsequent dredge-up.
The possible influence of the triple- reaction on the He-shell flash strength is perhaps more obvious. A larger rate is likely to cause a larger peak-flash He-burning luminosity, and subsequently a deeper dredge-up. Our qualitative expectation is then that a reduced rate and an increased triple- rate will each increase the amount of carbon produced in the process. The effect of the rate is less obvious. To obtain quantitative estimates on these processes we have conducted a detailed numerical study.
III Nuclear Physics Input
The NACRE collaboration (Angulo et al., 1999) has recommended reaction rates for the reactions we consider here. In this section we examine whether, six years after their publication, the NACRE estimates still describe the available data with sufficient accuracy for our purposes. Table 1 lists the temperatures of interest: () to for the reaction and – for the triple- and the reactions.
III.1
The 14N()15O reaction has a complex structure with transitions, both resonant and non-resonant, to several final states contributing to the rate. In addition, contributions from the tails of subthreshold states must be considered. Schroeder et al. (1987) obtained data over a wide energy range from 0.2 to 3.6 MeV; their R-matrix fit to this data yielded a large S-factor for the transitions to the ground state. Their total S-factor, keV b, was the principal basis for the NACRE reaction rate (Angulo et al., 1999). However, the fit to the ground state cross section required an unusually large value for the gamma width of a subthreshold state at MeV in 15O, about 7 times that of the isospin-analog transition in 15N. Such large differences are seldom, if ever, seen, at least for light nuclei (Adelburger et al., 1998; Brown, 2004). Motivated by this fact, direct measurements of the 6.793 state’s lifetime were made (Bertone et al., 2001; Yamada et al., 2004) and yielded much smaller gamma widths. A reanalysis (Angulo and Descouvement, 2001) of the Schroeder data resulted in a much smaller ground state transition and keV b. Later, determinations of asymptotic normalization coefficients (ANC) for the relevant transitions using nuclear transfer reactions, combined with some of the Schroeder results (A. M. Mukhamedzhanov et al., 2003) led to keV b.
Recently, additional 14N()15O data and corrected data from Schroeder et al. (1987) were analyzed to yield keV b (A. Formicola, et al, 2004). An independent measurement at TUNL (Runkle et al., 2005) yielded keV b. Measurements of the analyzing power at 270 keV (Nelson et al., 2003) indicate that M1 contributions to the cross section should be considered; to our knowledge these contributions have not been included in detailed fits to the data. There are also preliminary data down to 70 keV (H. Costantini and the LUNA Collaboration, 2005) for the main transition, that to the 6.79 MeV state.
All the recent investigations show that the ground state transition is small and that the resulting total S factor is smaller by about a factor of two than the NACRE result. In the near future, the reliability of the rate is likely to improve as more complete analyses including all the recent data are carried out. However, for now we have chosen to use an unweighted average of the four recent results and a conservative error reflecting the relatively long extrapolations to the astrophysical range, the neglect of the M1 amplitudes, and the imperfect fits to the data. We obtain keV b. For easy employment in the stellar evolution code, this value can be approximated as a fraction of NACRE’s analytical fit (Angulo et al., 1999) to the reaction rate in the relevant temperature range.
III.2 Triple-
The first step of the triple- process is the fusion of two particles to form a equilibrium concentration of 8Be. The subsequent capture of an alpha particle produces an equilibrium concentration of 12C in its 7.65 MeV state. Occasionally 12C is formed by a leak, via a gamma cascade or pair emission, to the ground state of 12C. For the temperatures involved in the present calculations both of these steps are resonant and the reaction rate is given by:
| (1) |
The value of for the 7.65 MeV state is known to within keV (Nolen, Jr. and Austin, 1976) and contributes an uncertainty in the rate of only for . Essentially all the uncertainty in the rate is due to the uncertainty in , the radiative width of the 7.65 MeV state; is known with a precision of . It is essentially these established values of and that are incorporated into the NACRE rates for the temperatures considered here, and hence, for our purpose the NACRE rates are adequate. We shall see, however, that they are not sufficiently accurate.
Following the completion of the calculations described herein, H. O. U. Fynbo, et al. (2003), (Fynbo et al., 2005) determined the level structure of and concluded from their results that the 7.65 MeV state alone adequately describes the reaction rate for temperatures . They also conclude that at , the midpoint of the temperature range covered here, the triple-alpha rate is smaller than the NACRE results by about . This is comparable to the quoted error we used, and should be kept in mind when examining the details of the present results. In fact, our calculations can be used to determine the effect of the change on C-yields.
III.3
This reaction has been the subject of many experiments and analyses over a period of forty years, but it is still not accurately known. It is not possible here to review this subject in detail, it is simply too complex. One can find a comparison of the various rates in Fig. 1 of Eid et al. (2004), and the references cited there can be consulted for more detail. A extensive discussion of this rate can be found in Buchmann (2005) and the results of extensive recent measurements in J. W. Hammer, et al. (2005). The NACRE rate is probably somewhat too large in the region of present interest, but the quoted uncertainties are sufficiently large to represent the probable range of acceptable values. This is a minor issue for the present calculations since, as we shall see, carbon production in low and intermediate mass AGB stars is very weakly dependent on the rate.
III.4 Comments
We conclude that the NACRE recommendations describe current triple- and data sufficiently well, at least for the temperature range relevant here. Recent data, however, make it clear that the NACRE estimate for the rate is high by roughly a factor of two.
IV Methods and physics input
| reaction | 222Recommended reaction rate. | exp333Power of 10 multiplying reaction rates in columns 3,4, and 5 | 444Ratio between tabulated value and fit formula. | 555. | 666 | |||
| adopted for our calculations: | ||||||||
| adopted for our calculations: | ||||||||
| adopted for our calculations: | ||||||||
The one-dimensional stellar evolution codes we employed solve the well-established full set of non-linear partial differential equations to account for hydrostatic equilibrium, mass continuity, and energy transport and generation (Kippenhahn and Weigert, 1990; Blöcker, 1995; Herwig, 2000). Most of the calculations have been done with the code EVOL (Herwig, 2004). It includes updated input physics.777The opacities, for example, are from Iglesias and Rogers (1996) supplemented with low temperature opacities by Alexander and Ferguson (1994). A small amount of envelope overshooting, but no overshooting at other AGB convection zones is introduced following Herwig et al. (1997).888The efficiency for convective envelope (CE) overshooting is , see Herwig (2000) for a description of the overshooting scheme used. Mass loss is included by adopting the formalism of Blöcker (1995) with a scaling factor . For more details, and definitions see Herwig (2004).
In order to generate the initial model for our comparative study we compute the evolution of a star with a mass of and a metallicity of from the pre-main sequence through the H- and He-core burning phase. After the He-core burning phase the star gradually climbs up the Asymptotic Giant Branch in the - (Hertzsprung-Russell) diagram. We choose as a starting model for all subsequent calculations a model at the very end of the He-core burning phase, and well before the onset of the first He-shell flashes.
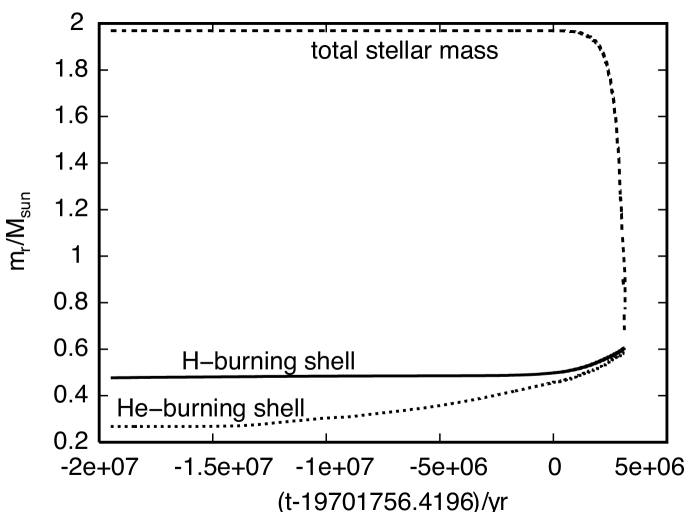
The evolution of the H- and He-burning shell and of the stellar surface in the Lagrangian mass coordinate for the benchmark sequence ET2 are shown in Fig. 1. From the end of the He-core burning phase the star spends about 20 million years on the so-called Early-AGB phase. During this phase the H-burning shell is largely inactive and most nuclear energy is produced in the He-burning shell.
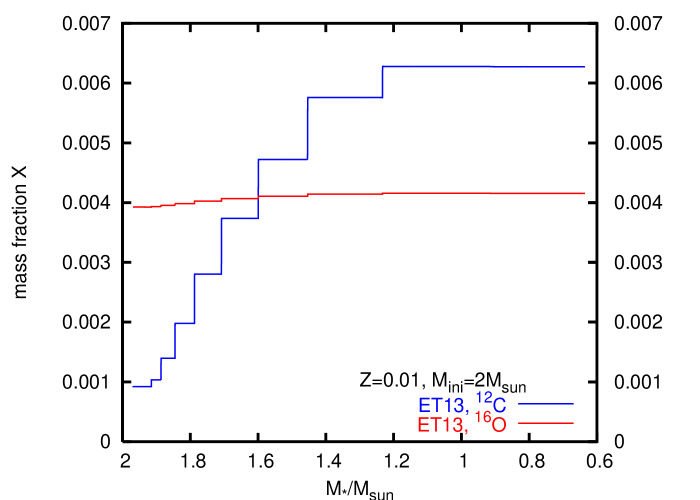
He-shell flashes occur only during a rather short period of the post-He-core burning phase. The underlying reason for their occurrence is the different burning rate of the two shells which eventually prohibits quiescent double-shell burning. A close-up of the actual He-shell flash phase of the AGB is shown in Fig. 2. Seventeen thermal pulses can be identified by the vertical lines that connect the H- and the He-shell at almost equidistant intervals. These vertical lines are the brief He-shell flash convection zones which last for only to . During the flash the convectively unstable layers are confined to the region below the H-shell and above the He-shell. The inset shows a small spike at the bottom which is the rapidly growing upper boundary of the He-shell flash convection zone. It stops just short of the mass coordinate of the H-free core where the H-shell is located, and quickly retreats afterward. The H- and He-burning shells remain well separated even during the He-shell flash episodes, and no H from the envelope can enter the He-burning shell. The inset also shows how the bottom of the convective envelope later descends into mass layers previously occupied by the He-shell flash convection zone and with consequent “dredging” of processed material into the envelope. It is this tiny detail in the convective evolution of the stellar interior that is responsible for the enrichment of the envelope and eventually, through mass loss, of the interstellar medium. The dredge-up events after the thermal pulses cause a gradual increase of carbon and to a much lesser extent oxygen (Fig. 3). The surface abundance for 16O is nearly constant with time for near-solar metallicity. This results in an increase of the C/O ratio, and eventually to the formation of C-stars. More detailed figures of the evolution of He-shell flashes can be found, for example, in Fig. 1 and 10 in Herwig (2000).
For any comparative study of the propagation of nuclear reaction rate uncertainties in a stellar evolution code a somewhat consistent set of quantitative estimates on the uncertainties is required. In the absence of such estimates, one is left with the rather crude approach of applying common factors to all rates in question. However, such an approach misses out on critical aspects of the error propagation in a real stellar evolution environment. As we will show, for example, the reaction in our sample with the largest relative error has the smallest impact on the observable prediction. Similar conclusions were drawn in Paper I (Stoesz and Herwig, 2003).
In this study we rely initially on the NACRE compilation (Angulo et al., 1999) which contains recommended values and estimates for lower and upper bounds as a function of temperature. We then consider the impact of the revised recommendation for the reaction. Note that the recommended factors only apply in the given temperature range. In Table 1 and Fig. 4 we show the relevant information from the NACRE compilation for the two temperature ranges appropriate for He- and H-burning respectively. In addition to the tabulated reaction rates, fitting formula for the recommended values are provided. In the calculations we use these formulae instead of tables to evaluate the reaction rates at the required temperatures. We have checked the accuracy of the formulae, and found that for the range of interest here (as indicated in Table 1, column 2) the fitting error is rather small as shown in Column 7 of Table 1 which shows .
V Calculations and Results
V.1 Chemical enrichment and dredge-up as a function of nuclear physics input
| ID | reaction | factor | 999Number of Thermal Pulses that cause dredge-up. | 101010Dredge-up efficiency at mass coordinate , for details see text. | 111111Maximum reached by any flash in the entire sequence. | 121212Entire mass dredged-up by all dredge-up events. | 131313 yield from thermal pulses and the accompanying dredge-up in units of . For details see text. |
| ET2 | all | ||||||
| ET5 | |||||||
| ET8 | |||||||
| ET6 | |||||||
| ET9 | |||||||
| ET7 | |||||||
| ET10 |
| ID | 141414See Table 2 and text for explanations and details. | ||||||
|---|---|---|---|---|---|---|---|
| ET12 | |||||||
| ET13 | |||||||
| ET14 | |||||||
| ET15 | |||||||
| ET17 | |||||||
| ET18 |
Starting from our initial model at the end of core He-burning, we calculate seven full evolutionary sequences which end when all envelope mass is lost and the remaining stellar core is about to become the central star of the planetary nebulae stage. The sequences differ only in the adopted rates for the three reactions investigated here (Table 2). One benchmark sequence (ET2) has been computed with the recommended NACRE rates for all three reactions. In addition six sequences have been calculated in which for each of these reactions the rate from the fitting formula is multiplied by the factors given in Table 1, which include the small differences between tabulated and fitting formula values. Thus, for each reaction two sequences are computed, one adopting the upper and one adopting the lower bound of the uncertainty range.
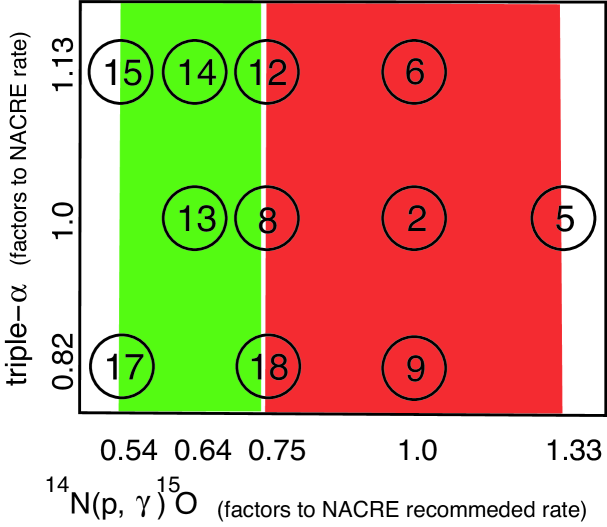
In a second set of sequences we have investigated the influence of the revised (smaller) rate. We have considered also simultaneous changes of both this rate and the triple- rate (Table 3). An overview of the reaction rate choices for the most interesting cases in which the and the triple- rate have been changed is shown in Fig. 4.
We summarize these results in Table 2 and Table 3. The most salient features of these results are described by the efficiency of dredge-up, , and the yield of carbon . The efficiency is given by with the core mass growth between two He-shell flashes due to H-shell burning, and the dredged-up mass following the He-shell flash. For each flash indicates the efficiency of dredge-up. means that the same amount of mass by which the core grew between two flashes is dredged-up after a flash. The 12C yield from thermal pulses and the accompanying dredge-up is given for C by: where and are the initial and the final stellar mass at the beginning and the end of the AGB phase, is the mass fraction at the surface as the star evolves and is the initial mass fraction. We also tabulate the total dredged-up mass.
The chemical evolution of AGB giants depends sensitively on the rates of the and the triple- reaction. Calculations with a smaller rate (case ET8) show a larger dredge-up efficiency, a larger dredged-up mass, and a larger amount of carbon mixed from the processed layers to the envelope and a larger carbon yield.151515The carbon enrichment is used here as a proxy for the envelope enrichment with nuclear processed material which would include the s-process elements, for example. All these quantities are about a factor of two higher than for the benchmark case.
For the triple- reaction we observe the opposite behavior. The case ET6 with a larger rate has, on average, He-shell flash peak luminosities (not shown in the table) that are 20-50 higher than the benchmark case and accordingly dredge-up is deeper. The efficiency, total dredged-up mass, and the yield are about a factor of two higher for sequence ET6 compared to sequence ET2. It is also clear that these effects are non-linear in the rates. The changes for increases in the rate and decreases in the triple- rate are small.
The uncertainty in the as given in the NACRE compilation rate has a much smaller influence on the observables studied here. We find that in both cases with upper and lower range values for this rate (cases ET7 and ET10) the yield is somewhat larger than in the benchmark case. Sequence ET10 has a slightly larger yield than ET7 although ET7 has a slightly larger dredge-up mass and efficiency than ET10 (see discussion in Sect. V.2).
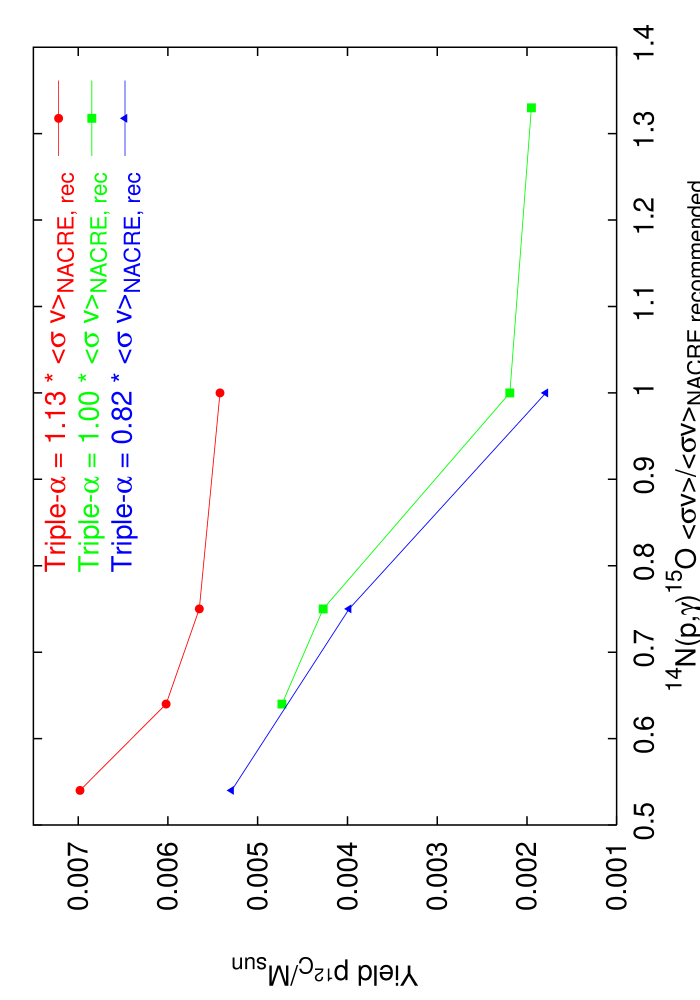
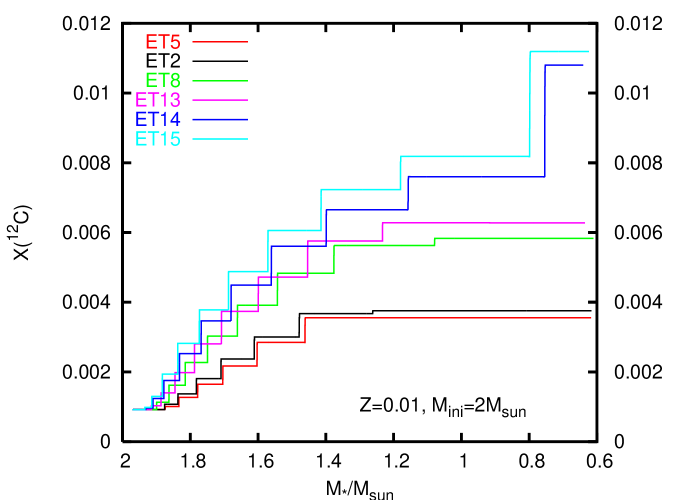
In Table 3 we show the results for the revised rate and for cases in which two rates are changed simultaneously. The 12C yield increases further for the lower rate and the combination with an increased triple- rate leads to still larger values. A compact representation of the set of simulations is given in Fig. 5. The main result is that due to the revision of the rate the predicted yields of low-mass stars is about twice as large as with the old rate. In addition, the relative error of the combined effect of the and triple- rate has decreased.
The evolution of the abundance is useful to further illustrate the differences. In Fig. 6 the envelope abundance increases in discrete steps for all cases. These steps correspond to the discrete dredge-up events after sufficiently strong He-shell flashes. The astrophysical yield is obtained by integrating the surface abundance over the mass lost. Most notable is the fact that abundances for the shown cases span a range significantly exceeding a factor 2. Until the reaction rates are better known this is an unavoidable uncertainty in the yield predictions.
These results confirm our original qualitative expectations. A smaller rate leads to a smaller helium production rate and later ignition of the He-shell flash. This flash is then more violent and the subsequent dredge-up is more efficient compared to a case with a larger rate. More efficient dredge-up leads to a larger envelope enrichment, and thus the envelope abundance and stellar yield is larger for the run with the smaller rate. For the triple- reaction a larger rate leads to stronger He-shell flashes. In fact the run with the large rate shows He-burning peak luminosities which are about 20-50% larger than for the run with the lower triple- rate. Accordingly the run with the larger rate shows greater efficiency, deeper dredge-up, and larger abundances at the surface and in the yields.
V.2 Verification of stellar modelling results
The main set of models has been computed using the EVOL stellar evolution code (Herwig, 2000). In order to check these results we have repeated a subset of the numerical experiments with the independent MSSSP code (Lattanzio, 1986). Calculations were carried out for and with the standard rate used in that code (very similar to the NACRE rate) starting from the main-sequence and a comparison calculation starting, as with the EVOL set of sequences, after the end of core He-burning with times the standard rate. This calculations shows deeper dredge-up and a larger C yield compared to the sequence with the higher rate. The effect seen in the MSSSP calculations is qualitatively and quantitatively consistent with the EVOL results.
In several test calculations we discovered that starting the comparison runs with different reaction rates at or even after the onset of the He-shell flashes did not show consistent trends. The luminosity of the H- and He-shell depend on the core properties (im particular mass and radius) that are the result of the previous core burning phases of H and He. For the main set of comparative calculations we therfore choose an initial model about 20 million years before the first thermal pulse, and immediately after the end of the He-core burning.
Comparison calculations have been done with the MSSSP code with different rates. As with the EVOL calculations reported in Sect. V.1 we were not able to identify clear correlations between this reaction rate and the dredge-up and yield properties of the models. The differences we found were below the level and more sensitive to numerical parameters (such as the spatial and temporal resolution) than the rate. (This is actually to be expected, because this reaction rate is not as important as the triple- rate during the AGB thermal pulse evolution.) The quantities like total dredge-up mass and carbon yield are the result of a discrete process repeated to times. Thus, these numbers are subject to a statistical fluctuation .
V.3 The pre-AGB evolution: H- and He-core burning
The main emphasis of this study is the impact of nuclear reaction rates on the AGB evolution, in particular the chemical enrichment through the third dredge-up. However, we did check how the dredge-up of models with different reaction rates change if run all the way from the main-sequence, including the effect on H- and He-core burning. One test has been done with the MSSSP code, starting a sequence with the reduced rate from the main-sequence. In that sequence the dredge-up during the AGB thermal pulse phase is still significantly larger than with the NACRE recommended rate, but the increase is somewhat smaller then for the comparison runs started after the end of He-core burning.
A second test has been made with the EVOL code running two sequences all the way from the zero-age main-sequence to the end of the thermal pulse AGB. In addition to the benchmark case ET2 we reran the combination of case ET14 (, ), and refer to this run as ET14a. We found that in this case the dredge-up is about larger than in the ET14 model calculated from the starting model after the end of He-core burning. This is another example of the highly non-linear behaviour of the third dredge-up.
We can analyse the differences caused by the change of nuclear reaction rate on the H- and He-core burning phases, and find them to be very small. The central temperature during the H-core burning of the models studies here are initially, increasing sharply to at the end of H-core burning. Case ET14a shows central temperatures throughout core H-burning that are larger than the benchmark case. This small increase of temperature is sufficient to increase energy generation required for hydrostatic equilibrium because of the steep temperature dependence of the rate. Run ET14a consumes H in the center slightly faster, and accordingly the H-core burning phase is about shorter than in the benchmark case. The mass of the convective core is practically the same in both cases. None of these nuclear reaction rate differences during the main-seqeunce evolution would make an observable difference.
During the He-core burning the slightly larger triple- rate leads to a slightly larger C/O ratio on the core (). However, during the EVOL calculations some breathing pulses of the convective core occur. These breathing pulses are well known during the He-core burning phase and related to the unstable growth of the convective core into a layer that is stabilized by an composition gradient. The treatment of convective boundaries implemented in the EVOL code makes the occurrence of breathing pulses somewhat dependent on the numerics. It is not clear from the calculations to which extent the magnitude of the central C/O ratio depends on this simulation error. However, since the effect is small we decided not to follow this question any further. At the end of He-core burning the age difference between the two runs is of the total age. The core mass and size are practically identical.
The second dredge-up decreases the core mass slightly for stars of this mass. This effect is weaker in run ET14a, so that the core mass after the second dredge-up is slightly larger than in the benchmark run. It is during the early AGB evolution from the end of He-core burning to the first thermal pulse that sequence ET14a has a slower growth rate of the H-free core, corresponding to a smaller H-burning luminosity. This leads to a smaller core mass at the first thermal pulse for case ET14a compared to the benchmark run. A smaller core mass should result in less efficient third dredge-up, if the reaction rates are the same. However, ET14a has a combination of rates that increase third dredge-up, as shown in the main set of comparative calculations. In addition, because the stellar luminosity of run ET14a is somewhat smaller, the mass loss according to the adopted L-dependent mass loss formula is smaller, and the thermal pulse AGB phase is longer by . In particular the last thermal pulses have larger He-flash peak luminosity, that as discussed above leads to more efficient dredge-up.
The third test concerns the influence of the rate on the pre-AGB evolution. We calculated an additional sequence (ET7a) corresponding to sequence ET7 (NACRE rate times 1.44) from the main-sequence to the thermal pulse AGB phase. As can be expected, there are no difference (e.g. duration, core size) between run ET7a and ET2a during the H-core burning phase. During the core He-burning phase the central C/O ratio is systematically smaller in run ET7a compared to the benchmark case. For example after 1/3 of the He-core burning phase for the ET7a run and for the benchmark case. Not surprisingly the ratio of those two values is 1.44. The ET2a He-core burning duration is shorter than ET7a, the central temperature and density are almost the same. As in the discussion of run ET14a above we note the occurence of breathing pulses during the He-core burning phase, in particular towards the end of this phase. In runs ET2a and ET7a these breathing pulses are very similar, with no observable difference. The core mass at the first thermal pulse is for ET7a, and practically the same () for ET2a. We continued run ET7a into the thermal pulse regime until the onset of the third dredge-up. As expected from the practically idenitical core masses the ET7a and ET2a sequence show very similar third dredge-up behaviour.
In conclusion we find that as expected the sensitivity of stellar evolution properties to the rate during the H- and He-core burning phases of low-mass stars are small. There is a small dependence of the thermal pulse AGB results on the progenitor evolution, which however does not change the trends established with our main set of comparative calculations starting with the same initial model after the end of He-core burning.
VI Improving the triple- rate
The recent results of H. O. U. Fynbo, et al. (2003), (Fynbo et al., 2005) have shown that for , the triple alpha reaction rate is dependent essentially on the properties of the state at an excitation energy 7.65 MeV in , the Hoyle state. This reduces the problem of determining the triple alpha rate to determining the properties of that state.
Because the 7.65 MeV state is a state its direct excitation is difficult. Moreover, the ratio of the radiative width to the total width is small, . As a result one must determine from the relationship
| (2) |
Here , and are the gamma width, pair width and total width of the 7.65 MeV state. Each of the three factors on the right is determined in a separate experiment. At present they are known with an accuracy, left to right, of , and . In all cases, there are several consistent measurements, so these results can be regarded as robust.
There are two new developments that may significantly improve our knowledge of , and hence the triple- reaction rate, by improving the accuracy of the poorest known quantities: the pair width and the pair branch . The pair width is determined from the transition charge density for inelastic electron scattering to the 7.6 MeV state. There is a new, as yet unpublished result (H. Crannell, et al., 2005), based on a compendium of extant measurements over a large momentum transfer range, that has a quoted accuracy of . It is difficult to imagine that a more accurate value of can be obtained. On the other hand, this value is not quite consistent with the earlier values of .
The pair branch is the least well known quantity, primarily because it is so small, about . A new experiment (Tur et al., 2004), a Western Michigan University (WMU), Michigan State University (MSU) collaboration, is underway using the Tandem accelerator at WMU. The proposed detector is an improved version of that used by Robertson et al. (1977).
In this experiment the 7.6 MeV state in 12C is excited by inelastic proton scattering, taking advantage of a strong resonance at an excitation energy of 10.6 MeV and a scattering angle of 135 degrees in the lab. In order to reduce gamma ray backgrounds, a coincidence is required between a thin plastic- scintillator cylinder surrounding the target and a large plastic scintillator surrounding both the target and the cylinder. This arrangement should strongly discriminate against ray-backgrounds–gamma rays have only small probability of interacting in the thin cylinder. The pair branch is then given simply by the ratio of the number of positron-electron pairs detected by plastic scintillator coincidences to the number of counts in the 7.65 MeV peak in the proton spectrum. An examination of the systematic uncertainties in the similar Robertson experiment leads us to estimate that an accuracy of 5% is achievable.
These two results promise to reduce the uncertainty in the triple- rate to about 6%; as we have seen that will greatly improve the reliability of predictions of carbon production in AGB stars.
VII Discussion
We have presented a systematic investigation of the propagation of the rate uncertainties of key nuclear reaction rates into chemical enrichment predictions of low- and intermediate mass stars that have reached the thermal pulse AGB phase. We found that the dredge-up in low-mass stars depends rather sensitively on the adopted reaction rates. The overall dredge-up of material and, specifically, the yield of 12C, has uncertainties of greater than a factor of two owing to the reaction rate uncertainties. The C/O ratio at the stellar surface has a similar uncertainty.
Such uncertainties are a problem for many problems of current astrophysical interest. The construction of integrated models of galactic chemical evolution, for example, includes contributions from stars of all initial masses (Timmes et al., 1995), and AGB stars are an important contributor for some nuclear species. The enrichment of the surface abundance with carbon also effects the appearance of AGB stars in extra-galactic stellar population studies. As the surface abundance changes from O-dominated (), to C-rich () the molecular chemistry in the giant’s atmosphere changes considerably (Marigo, 2002), affecting the star’s surface temperature and thereby its astronomical colors. In older extra-galactic populations AGB stars are often the brightest stars, and can probe the population’s properties, for example, its age. Finally, many extremely metal-poor (EMP) stars, which may provide information on chemical evolution in the early Universe, turn out to have binary White Dwarf companions (Lucatello et al., 2005). The unusual abundance patterns of these EMP stars (Beers and Christlieb, 2005) should correlate with the chemical yields of the White Dwarf progenitors - the AGB stars at this low metallicity.
Of course nuclear reaction rates are not the only uncertainties in AGB models. The treatment of convection, and mixing in general, effects the efficiency of the third dredge-up as well (Frost and Lattanzio, 1996; Herwig, 2005). Two separate issues have to be considered. Convection in 1D stellar evolution models is usually approximated by some variant of the local mixing-length theory (Böhm-Vitense, 1958).In this ballistic theory the mean free path of rising and descending blobs has to be specified.161616Usually one uses the well known stellar parameters of the sun to calibrate this free parameter, and keeps this value constant as the evolution progresses. However, multi-D hydro-simulations have shown that this assumption is not correct (Ludwig et al., 1999), and for evolved giants the mixing-length parameter may be larger by some substantial fraction. Based on the sparse information on this topic in the literature (Boothroyd and Sackmann, 1988; Ludwig et al., 1999; Marigo, 2001) we roughly estimate that the mixing-length uncertainty translates into yield uncertainties ranging from to a factor of a few, depending on initial stellar mass.
Another source of uncertainty of dredge-up predictions is the treatment of convective overshooting. There is now enough numerical and experimental proof to claim that convective overshooting takes place in stellar environments, and that the efficiency of that process depends on the evolutionary phase (Robinson et al., 2004). It appears that dredge-up predictions are uncertain by a factor of two because of the poorly known overshooting efficiency.
These two issues related to the modelling of stellar convection have been viewed as the major source of dredge-up and yield prediction uncertainties. Our study shows that nuclear reaction rate uncertainties of two key reactions induce modelling uncertainties of similar magnitude. The need to reduce these uncertainties is a powerful argument for better determinations of the reaction rates of the and triple- reactions. Progress in experimental nuclear physics will have an immediate impact on astrophysical models that rely on stellar yields.
Acknowledgements.
This work was funded in part under the auspices of the U.S. Dept. of Energy, and supported by its contract W-7405-ENG-36 to Los Alamos National Laboratory, the Australian Research Council, and by the US NSF grants PHY01-10253 and PHY02-16783, the latter funding the Joint Institute for Nuclear Astrophysics (JINA), a NSF Physics Frontier Center.References
- Woosley et al. (2003) S. E. Woosley, A. Heger, T. Rauscher, and R. D. Hoffmann, Nucl. Phys. A 718, 3 (2003).
- Stoesz and Herwig (2003) J. A. Stoesz and F. Herwig, Mon. Not. R. Astron. Soc. 340, 763 (2003).
- Huss et al. (1994) G. R. Huss, A. J. Fahey, R. Gallino, and G. J. Wasserburg, Astrophys. J. 430, L81 (1994).
- Nittler et al. (1997) L. R. Nittler, C. M. O. Alexander, X. Gao, R. M. Walker, and E. Zinner, Astrophys. J. 483, 475 (1997).
- Herwig and Austin (2004) F. Herwig and S. M. Austin, Astrophys. J. Lett. 613, L73 (2004).
- Iben and Renzini (1983) I. Iben, Jr. and A. Renzini, Ann. Rev. Astron. Astrophys. 21, 271 (1983).
- Lattanzio and Forestini (1999) J. Lattanzio and M. Forestini, in AGB Stars, edited by T. L. Bertre, A. Lebre, and C. Waelkens (ASP, 1999), IAU Symp. 191, p. 31.
- Herwig (2005) F. Herwig, Ann. Rev. Astron. Astrophys. 43 (2005), in press.
- Schönberner (1979) D. Schönberner, Astron. Astrophys. 79, 108 (1979).
- Iben (1981) I. Iben, Jr., Astrophys. J. 246, 278 (1981).
- Lattanzio (1986) J. C. Lattanzio, Astrophys. J. 311, 708 (1986).
- Hollowell and Iben (1988) D. Hollowell and I. Iben, Jr., Astrophys. J. 333, L25 (1988).
- Vassiliadis and Wood (1993) E. Vassiliadis and P. Wood, Astrophys. J. 413, 641 (1993).
- Blöcker (1995) T. Blöcker, Astron. Astrophys. 297, 727 (1995).
- Mowlavi (1999) N. Mowlavi, Astron. Astrophys. 344, 617 (1999).
- Herwig (2000) F. Herwig, Astron. Astrophys. 360, 952 (2000).
- Karakas et al. (2002) A. I. Karakas, J. C. Lattanzio, and O. R. Pols, PASA 19, 515 (2002).
- Boothroyd and Sackmann (1988) A. I. Boothroyd and I.-J. Sackmann, Astrophys. J. 328, 671 (1988).
- Despain and Scalo (1976) K. H. Despain and J. M. Scalo, Astrophys. J. 208, 789 (1976).
- Angulo et al. (1999) C. Angulo, M. Arnould, and Rayet, M. et al., Nucl. Phys. A 656, 3 (1999), NACRE compilation.
- Schroeder et al. (1987) U. Schroeder, H. W. Becker, G. Bogaert, J. Görres, C. Rolfs, H. P. Trautvetter, R. E. Azuma, C. Campbell, J. D. King, and J. Vise, Nucl. Phys. A 467, 240 (1987).
- Adelburger et al. (1998) E. G. Adelburger, S. M. Austin, J. Bahcall, A. B. Balentekin, and G. Bogaert et al, Rev. Mod. Phys. 70, 1265 (1998).
- Brown (2004) B. A. Brown (2004), priv. com.
- Bertone et al. (2001) P. F. Bertone, A. E. Champagne, D. C. Powell, C. Iliadis, S. E. Hale, and V. Y. Hansper, Phys. Rev. Lett. 87, 152501 (2001).
- Yamada et al. (2004) K. Yamada, T. Motobayashi, and Akiyoshi, H. et al., Phys. Lett. B 579, 265 (2004).
- Angulo and Descouvement (2001) C. Angulo and P. Descouvement, Nucl. Phys. A 690, 755 (2001).
- A. M. Mukhamedzhanov et al. (2003) A. M. Mukhamedzhanov et al., Phys. Rev. C 67, 065804 (2003), and private communication.
- A. Formicola, et al (2004) A. Formicola, et al, Phys. Lett. B. 591, 61 (2004).
- Runkle et al. (2005) R. C. Runkle, A. E. Champagne, C. Angulo, C. Fox, C. Iliadis, R. Longland, and J. Pollanen, Phys. Rev. Lett. 94, 082503 (2005).
- Nelson et al. (2003) S. O. Nelson, M. W. Ahmed, B. A. Perdue, and A. L. Sabounov et al., Phys. Rev. C 68, 065804 (2003).
- H. Costantini and the LUNA Collaboration (2005) H. Costantini and the LUNA Collaboration, Nucl. Phys. A (2005), to be published, Proceedings of the Eighth International Symposium on Nuclei in the Cosmos.
- Nolen, Jr. and Austin (1976) J. A. Nolen, Jr. and S. M. Austin, Phys. Rev. C 13, 1773 (1976).
- H. O. U. Fynbo, et al. (2003) H. O. U. Fynbo, et al., Phys. Rev. Lett. 91, 082502 (2003).
- Fynbo et al. (2005) H. O. U. Fynbo, C. A. Diget, U. C. Bergmann, M. J. G. Borge, J. Cederkäll, P. Dendooven, L. M. Fraile, S. Franchoo, V. N. Fedosseev, B. R. Fulton, et al., Nature 433, 136 (2005).
- Eid et al. (2004) M. F. E. Eid, B. S. Meyer, and L.-S. The, Astrophys. J. 611, 452 (2004).
- Buchmann (2005) L. Buchmann, Nucl. Phys. A (2005), to be published, Proceedings of the Eighth International Symposium on Nuclei in the Cosmos.
- J. W. Hammer, et al. (2005) J. W. Hammer, et al., Nucl. Phys. A (2005), to be published, Proceedings of the Eighth International Symposium on Nuclei in the Cosmos.
- Kippenhahn and Weigert (1990) R. Kippenhahn and A. Weigert, Stellar structure and evolution (Springer, Berlin, 1990).
- Herwig (2004) F. Herwig, Astrophys. J. 605, 425 (2004).
- Iglesias and Rogers (1996) C. A. Iglesias and F. J. Rogers, Astrophys. J. 464, 943 (1996).
- Alexander and Ferguson (1994) D. Alexander and J. Ferguson, Astrophys. J. 437, 879 (1994).
- Herwig et al. (1997) F. Herwig, T. Blöcker, D. Schönberner, and M. F. El Eid, Astron. Astrophys. 324, L81 (1997).
- H. Crannell, et al. (2005) H. Crannell, et al., Nucl. Phys. A (2005), to be published, Proceedings of the Eighth International Symposium on Nuclei in the Cosmos.
- Tur et al. (2004) C. Tur, A. Wuosmaa, K.-I. Yoneda, and S. M. Austin (2004), unpublished.
- Robertson et al. (1977) R. G. H. Robertson, R. A. Warner, and S. M. Austin, Phys. Rev. C 15, 1072 (1977).
- Timmes et al. (1995) F. X. Timmes, S. E. Woosley, and T. A. Weaver, Astrophys. J. Suppl. 98, 617 (1995).
- Marigo (2002) P. Marigo, Astron. Astrophys. 387, 507 (2002).
- Lucatello et al. (2005) S. Lucatello, S. Tsangarides, T. C. Beers, E. Carretta, R. G. Gratton, and S. G. Ryan, Astrophys. J. (2005), in press., eprint astro-ph/0412422.
- Beers and Christlieb (2005) T. C. Beers and N. Christlieb, Ann. Rev. Astron. Astrophys. 43 (2005), in press.
- Frost and Lattanzio (1996) C. A. Frost and J. C. Lattanzio, Astrophys. J. 473, 383 (1996).
- Böhm-Vitense (1958) E. Böhm-Vitense, Z. Astrophys. 46, 108 (1958).
- Ludwig et al. (1999) H. Ludwig, B. Freytag, and M. Steffen, Astron. Astrophys. 346, 111 (1999).
- Marigo (2001) P. Marigo, Astron. Astrophys. 370, 194 (2001).
- Robinson et al. (2004) F. J. Robinson, P. Demarque, L. H. Li, S. Sofia, Y.-C. Kim, K. L. Chan, and D. B. Guenther, Mon. Not. R. Astron. Soc. 347, 1208 (2004).