Detection of the Buried AGN in NGC 6240 with the Infrared Spectrograph on The Spitzer Space Telescope11affiliation: based on observations obtained with the Spitzer Space Telescope, which is operated by the Jet Propulsion Laboratory, California Institute of Technology, under NASA contract 1407
Abstract
We present mid-infrared spectra of the nearby, Ultraluminous Infrared Galaxy NGC 6240 taken with the IRS on Spitzer. The spectrum of NGC 6240 is dominated by strong fine-structure lines, rotational H2 lines, and PAH emission features. The H2 line fluxes suggest molecular gas at a variety of temperatures. A simple two-temperature fit to the S(0) through S(7) lines implies a mass of M⊙at TK and M⊙at TK, or about of the total molecular gas mass in this system. Noteably, we have detected the [NeV] m emission line, with a flux of erg cm-2 s-1, providing the first direct detection of the buried AGN in the mid-infrared. Modelling of the total SED from near to far-infrared wavelengths requires the presence of a hot dust (TK) component, which we also associate with the buried AGN. The small [NeV]/[NeII] and [NeV]/IR flux ratios, the relative fraction of hot dust emission, as well as the large m PAH EQW, are all consistent with an apparent AGN contribution of only to the bolometric luminosity. However, correcting the measured [NeV] flux by the extinction implied by the silicate optical depth and our SED fitting, suggests an intrinsic fractional AGN contribution to the bolometric luminosity of in NGC 6240, which lies within the range implied by fits to the hard X-ray spectrum.
1 Introduction
Ultraluminous Infrared Galaxies (ULIRGs), i.e. those galaxies with infrared luminosity LL⊙, have the power output of quasars yet emit nearly all of their energy in the mid and far-infrared part of the spectrum. Most ULIRGs are found in interacting and merging systems (e.g. Armus, Heckman & Miley 1987; Sanders, et al. 1988; Murphy, et al. 1996), where the merger has driven gas and dust towards the remnant nucleus, fueling a massive starburst, and either creating or fueling a nascent AGN (Mihos & Hernquist 1996).
Spectroscopic observations with the ISO satellite greatly expanded our understanding of the mid-infrared spectra of ULIRGs (e.g., Genzel et al. 1998; Lutz et al. 1999; Rigopoulou et al. 1999; Spoon et al. 2002; Sturm et al. 2002; Tran et al. 2001). However, the the limitations in sensitivity of the ISO spectrometers, left many ULIRGs, even at relatively low redshift, beyond the reach of these methods until now.
In order to adequately sample the local ULIRG population, we are obtaining mid-infrared spectra of a large number of ULIRGs () having with the Infrared Spectrograph88affiliationmark: (IRS) on Spitzer. The entire sample will be observed with the low-resolution () IRS modules, and about half will be observed with the high-resolution () IRS modules as well. These sources are chosen primarily from the IRAS 1-Jy (Kim & Sanders 1998), 2-Jy (Strauss et al. 1992), and the FIRST/IRAS radio-far-IR sample of Stanford et al. (2000). In this letter, we present the IRS spectra of NGC 6240, a nearby (), double-nucleus, merging galaxy (Fosbury & Wall 1979; Fried & Schulz 1983; Wright, Joseph & Miekle 1984), with an m luminosity (LIR as defined by Sanders et al 1988) of L⊙. The optical nuclear spectrum of NGC 6240 is classified as a LINER (Armus, Heckman & Miley 1989), and the extended optical nebula reveals the presence of a starburst-driven superwind (Heckman, Armus & Miley 1987; 1990). X-ray observations with ASCA (Turner et al. 1997), Beppo-SAX (Vignati et al. 1999), Chandra (Komossa et al. 2003, Ptak et al. 2003), XMM-Newton (Netzer et al. 2005) provide clear evidence for the presence of one (or two) AGN behind significant columns of absorbing material (N cm-2).
Strong [OIV] m line emission in the ISO SWS spectrum of NGC 6240 led Lutz et al. (2003) to suggest that up to of the infrared energy emitted by NGC 6240 could be powered by a buried AGN, yet direct evidence for the AGN in the mid-infrared was lacking until now. In this paper we present IRS spectra that show the presence of faint [NeV] m emission from NGC 6240, and we use fine-structure line ratios and PAH emission feature strengths to estimate the energetic importance of the AGN. Because it is a nearby, merging system that has a powerful starburst, a buried (pair of) AGN and a superwind, NGC 6240 provides us with a close-up view of the critical processes that shape all ULIRGs. Our analysis of the IRS spectra of NGC 6240 will serve to highlight the advantages, and the limitations, of IRS spectroscopy for studying luminous, infrared galaxies and buried AGN.
Throughout the paper, we will adopt a flat, -dominated Universe ( km s-1 Mpc-1, , ). The luminosity distances to NGC 6240 is then 99.2 Mpc, assuming , and one arcsec subtends pc in projection.
2 Observations
NGC 6240 was observed with the IRS on 04 March 2004. The IRS is fully described in Houck et al. (2004). All four IRS modules were used in Staring mode. Two cycles of 14 sec each were obtained for each nod position and each order of the Short-Low (SL) and Long-Low (LL) modules. Six cycles of 30 sec each, and four cycles of 60sec each, were obtained for each nod position of the Short-High (SH) and Long-High (LH) modules, respectively. A high-accuracy blue peak-up was performed on a nearby offset star before placing the slits on NGC 6240. Since the separation of the twin nuclei in NGC 6240 is about 1.5 arcsec, they are both contained within all IRS apertures, the narrowest of which (SL) has a slit width of 3.6 arcsec.
3 Data Reduction and Analysis
All spectra were reduced using the S11 IRS pipeline at the Spitzer Science Center. This reduction includes ramp fitting, dark sky subtraction, droop correction, linearity correction, and wavelength and flux calibration. One-dimensional spectra were extracted from the two-dimensional spectra using the SMART data reduction package (Higdon et al. 2004). The one-dimensional spectra are then scaled to a spectrum of Lacertae, extracted in an identical manner using SMART. The SL and LL data have been sky subtracted by differencing the two nod positions along the slit, before spectral extraction. As a final step, we have normalized the SL and LL 1D spectra upwards to match the IRAS m FSC data (Moshir et al. 1990). The scale factor was 1.16. The low-resolution IRS spectra are displayed in Fig. 1a.
Since the SH and LH slits are too small for on-slit background subtraction, we have subtracted the expected background flux through each slit based on the model of Reach et al. (2004). The LH data went through an additional cleaning step to remove residual hot pixels, which uses the B-mask (supplied with the BCD data) and the warm pixel mask for the given IRS campaign. Hot pixels were interpolated over spatially by using the two nod positions, before extraction from 2D to 1D spectra. For a full description of this method, see Devost et al. (2005). The SH and LH spectra were then scaled to the corresponding IRS low-resolution spectra, using a single scale factor for each module. The scale factors were 1.15 and 1.07 for SH and LH, respectively. The high-resolution IRS spectra are shown in Fig. 1b,c.
4 Results
4.1 Continuum & Dust Features
The IRS low-res spectrum of NGC 6240 shows a steeply rising continuum, heavily absorbed at & m by amorphous silicates (Fig. 1a). There is little or no water ice or hydrocarbon absorption from m, as is seen in some nearby ULIRGs – e.g. UGC 5101 (Armus et al. 2004). Broad PAH (Polycyclic Aromatic Hydrocarbon) emission features at 6.2, 7.7, 11.3, and m are visible. In addition, we detect the much fainter 16.4, and m PAH features, along with the broad “plateau” between m, which are seen in some ULIRGs and nearby starburst galaxies (Sturm et al. 2000, Armus et al. 2004, Smith et al. 2004, Brandl et al. 2005). The very weak UIB at m (see section 4.2) may also be produced by poly-cyclic aromatic hydrocarbons.
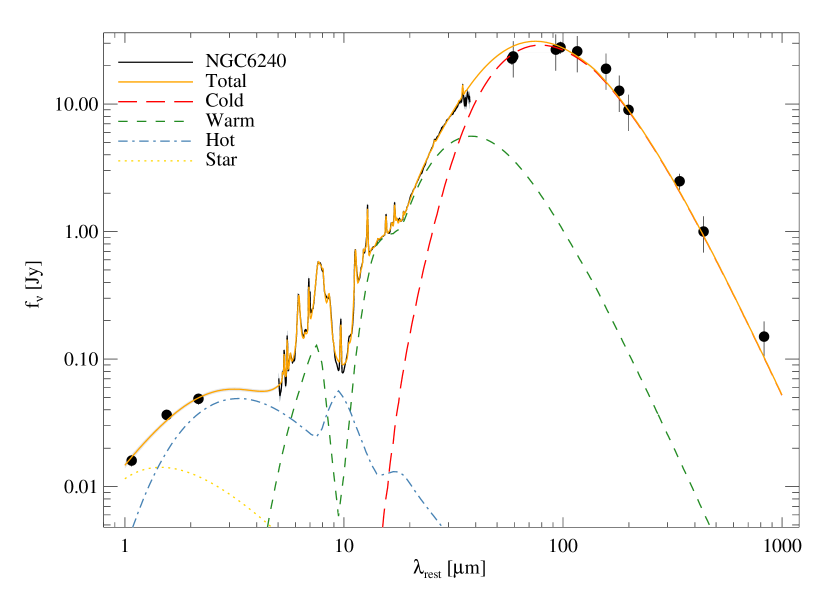
To estimate the contribution of dust emission at different temperatures to the luminosity of NGC 6240, and to accurately measure the strengths of the PAH emission features against the underlying, silicate-absorbed continuum, we have fit the SED with a multi-component model which includes at least two graphite and silicate dust grain components, PAH emission features (fit with Drude profiles), a 3500K blackbody stellar component, and unresolved Gaussian emission lines (to fit the fine structure and H2 lines). To extend the SED, we have added near-infrared, far-infrared, and sub-mm data to the IRS low-resolution spectra. The near-infrared photometry is from Scoville et al. (2000), the m and m data are from the IRAS Faint Source Catalog (Moshir et al. 1990), the m, m, m, and m data are from Klaas et al. (2001), and the m data are from Benford (1999). Our fit to the NGC 6240 SED is shown in Fig. 2. For a full description of this model fitting, see Marshall et al. (2005).
Three dust components are required to fit the NGC 6240 continuum spectrum. The characteristic temperatures of the three components are K (cold), K (warm), and K (hot). Each component is composed of graphite and silicate grains (with optical properties from Draine & Lee 1984), distributed in size according to the model of Weingartner & Draine (2001). The hot and warm components are modeled as spherically symmetric dust shells which are optically thin in the mid-infrared. The dust grains are distributed with uniform density around the central source, out to a distance of ten radial scale factors (where the unit radius is taken to be the distance at which the equilibrium temperature of the grains is equal to the component temperature). The temperatures of all grains are calculated as a function of their size, composition, and distance from the illuminating source. Grain sublimation is taken into account, so that the size-distribution can vary with radial distance from the central source, depending upon the temperature of the grains. The cold component is modeled as a distribution of grains immersed in a single radiation field (i.e., they are not radially distributed from a central source). As such, the grains in this component have a range of temperatures due to their varying composition and sizes, but not due to their spatial distribution. It is presumed that the cold dust is responsible for the absorption of photons from the hot and warm components. Nonetheless, the emission from the cold grains is treated as optically thin since they are sufficiently cold to radiate predominantly at far-infrared wavelengths, where their opacity is extremely small. Note that the range of grain temperatures due to the distribution of grain-sizes in the cold component produces an SED that is wider than that obtained with an average grain gray-body of the same temperature. In this treatment, there is therefore not a unique temperature associated with each component, as there is in a gray-body model. We instead define a “characteristic” temperature of a component to be the temperature of the most luminous grain size at the distance from the source contributing the majority of the luminosity. This luminosity dominating distance corresponds to a , where approximately half of the UV-source photons have been absorbed. Each component therefore contains dust above and below the characteristic temperature. With this definition, the characteristic temperature roughly corresponds to the expected peak in the dust modified Planck function.
A hot dust component with a characteristic temperature of about 700K, as we have found in NGC 6240, implies the existence of a significant number of grains near sublimation. As suggested by Laurent et al. (2000), an excess of hot dust can be taken as evidence for grains heated close to sublimation in the presence of an AGN. In NGC 6240, the presence of this hot dust together with the high-ionization lines discussed below, are consistent with this interpretation. The hottest grains in thermal equilibrium in the TK dust component, if illuminated with an AGN-like spectrum (Sanders et al. 1989) having the bolometric luminosity of NGC 6240, would be at a distance of about 1 pc from the central source. The hot component accounts for approximately of the bolometric luminosity in NGC 6240.
The optical depths to both the hot and cold dust components are essentially zero, while the screen optical depth to the warm component is (effectively the silicate optical depth, since this component dominates at m), implying an A mag. This is about a factor of three larger than the lower limit which would be derived from a smooth continuum fit anchored at m, m and m, since the un-extinguished model continuum at m is dominated by silicate emission. The warm component accounts for about of the bolometric luminosity before correcting for extinction, and about after correcting for this extinction.
While a multi-component SED fit is never “unique”, we have compared our best fit to alternative models which exclude a hot dust component, and which tie the optical depth to the hot dust at the value derived for the warm component. The latter is most similar to a spherical shell model wherein the hot dust is closest to the (obscured) nucleus and the coldest dust is responsible for most of the obscuration along the line of sight. Both of these constrained fits produce significantly poorer results, producing reduced chi-squared values that are between 50% and a factor of two larger than our preferred, three component fit described above.
Fits to the multiple PAH emission features in NGC 6240 result in 6.2/7.7 and 11.3/7.7 flux ratios of 0.21 and 0.25, respectively, suggesting a mix of neutral and ionized grains with between Carbon atoms each (Draine & Li 2001). The 6.2/7.7 flux ratio is between that found for NGC 253 and the Circinus galaxy, whereas the 11.3/7.7 flux ratio is about a factor of two, larger (Sturm et al. 2000; Draine & Li). The m PAH EQW is 0.52, about smaller than what is found for pure starburst galaxies (Brandl et al. 2005), but much larger (a factor of ) than is found for AGN. The PAH-to-LIR lumninosity ratio is about 0.023. In all cases, the extinction to the PAH features is assumed to be zero, as in a model where the emission arises from an extended region seen against a (partially) obscured continuum. Note, our multiple component continuum fits produce significantly larger PAH flux in features (e.g. the 7.7, 8.6, and 11.3m features) that are affected most by silicate absorptions than do other methods which employ spline fits to the observed continuum, even those anchored at relatively “clean” parts of the spectrum. However, the fitting we have used to derive the PAH fluxes in Table 1 are directly comparable to the Draine & Li (2001) models. This will be discussed fully in Marshall et al. (2005).
4.2 Emission Lines
The IRS short-high and long-high spectra of NGC 6240 are dominated by unresolved atomic, fine-structure lines of Ne, O, Si, S, and Fe, covering a large range in ionization potential, (Figs. 1b,1c and Table 1). The [FeII] lines at 5.34 and m (partially blended with [OIV] m) are particularly strong in NGC 6240 as compared to other ULIRGs and starburst galaxies, as has been noted by Lutz et al. (2003). We also detect a faint feature at m which we attribute to [FeII] emission. Grain destruction, possibly in the starburst-driven superwind, is the likely source of the increased gas phase Fe abundance in the cooling ISM in NGC 6240 (Draine & Woods 1990).
The most striking feature of the NGC 6240 spectrum is the strength of the pure rotational emission lines of H2. As noted by Draine & Woods (1990), based primarily upon the strength of the near-infrared H2 lines, NGC 6240 has both the largest H2 line luminosity, and the largest ratio of H2 -to- infrared luminosity, of any known galaxy. In the IRS spectrum, we detect the S(0) through S(7) lines (see Table 1), except for S(6), which is blended with the m PAH emission feature. The line flux we measure for the S(0) line is erg cm-2 s-1, consistent with the upper limit ( erg cm-2 s-1) in Lutz et al. (2003). The H2 excitation level diagram (Fig. 3) provides strong evidence for multiple temperature components in NGC 6240, a fact noted previously by Lutz et al. Fitting the S(3) through S(7) features, we derive a gas temperature of TK, and a mass of M⊙ for this warm component. Subtracting this fit off the lower excitation lines, we can then fit the S(0) and S(1) lines and derive a gas temperature of TK, and a corresponding mass of M⊙. In all cases an ortho–to–para ratio of three is assumed. Obviously the coldest component dominates the mass of “warm” H2 in NGC 6240.
A mass of M⊙ is about of the molecular gas mass derived from single-dish millimeter CO line measurements by Solomon et al. (1997). However,it is about of the cold molecular gas, or about 1/3 the total (warm plus cold) molecular gas mass, within the central 1 kpc as measured by Tacconi et al. (1999), which itself about half of the dynamical mass within the central 1 Kpc. The cold gas, as well as the warmer gas traced by the near-infrared S(1) line (Tecza et al. 2000), is actually centered between the two nuclei in NGC 6240, the latter presumably thermally excited via slow shocks triggered by either the interaction or the outflowing wind (Tecza et al., Van der Werf 1996, Egami et al. 1998). Although we have no spatial information on the H2 emission in our IRS spectrum, the de-convolved linewidths are comparable to those measured by Tecza et al. (km s-1), suggesting that much of the warm molecular gas we measure is associated with the centrally-concentrated gas seen by Tacconi et al. and Tecza et al. between the two nuclei.
The strongest H2 line in our IRS spectrum, the S(5) transition at m, has a flux about a factor of times larger that of the near-infrared S(1) line (Rieke et al. 1985; Herbst et al. 1990; Fischer, Smith & Glaccum 1990). The mid-infrared H2 emission lines listed in Table 1 alone account for about of the total energy output of NGC 6240. The model proposed by Draine & Woods (1990) for the strong H2 emission in NGC 6240, that of thermal emission from gas heated by X-rays, also predicts an m H rotational feature with a flux of erg cm-2 s-1. This feature is unique to the X-ray heating model. Unfortunately, this key diagnostic falls near the broad, PAH emission feature at m, which is clearly seen in our IRS spectrum. Since our limits for unresolved features in this part of the spectrum are about erg cm-2 s-1, even without the presence of the PAH emission, we cannot confirm or rule out the presence of the H line at the level predicted by Draine & Woods.
Most of the emission lines are resolved in our SH and LH spectra, with the bright lines having an average linewidth of km s-1, corrected for instrumental broadening, comparable to the linewidths reported by Lutz et al. (2003) from their SWS spectra. There is no obvious trend of increased linewidth with wavelength.
Ratios of the mid-infrared atomic fine structure emission lines can be used to characterize the source of the UV photons which ionize the gas and heat the dust (Genzel et al. 1998, Lutz et al. 1998, Sturm et al. 2002, Verma et al. 2003). Some features, e.g. the [NeV] lines at 14.3 and m, imply the presence of an AGN, since the ionization potential (97.1 eV) is too large to be produced by main sequence stars. The same is not true for [OIV], since it takes only 55 eV to ionize O++. While the m is strong in the spectra of AGN, it is seen in many starburst galaxies as well (e.g., Lutz et al. 1998, Verma et al. 2003). In the IRS spectrum of NGC 6240, [OIV] has a line flux of W cm-2, and the [OIV] 25.9/[NeII] 12.8 line flux ratio is 0.12. The [SIII] 18.7/[SIII] 33.4 line flux ratio (0.75) suggests an electron density of ncm-3 in the ionized nebula, for TK.
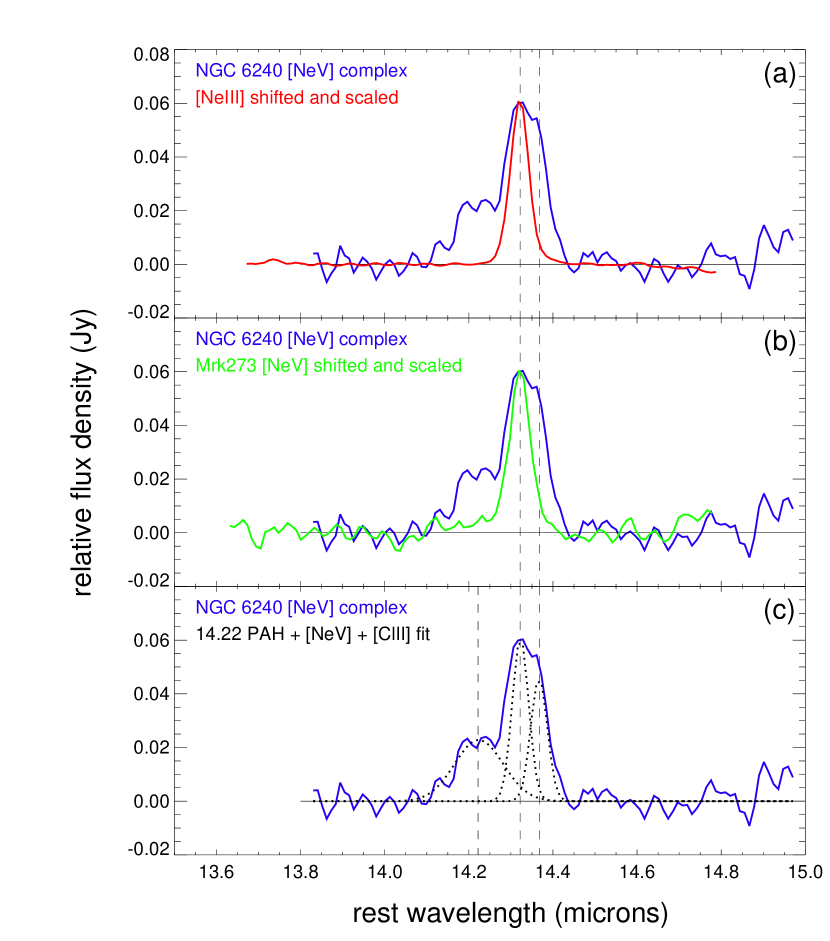
An expanded view of the rest-frame m region in NGC 6240 (order 14 from the SH spectrum) is shown in Fig. 4a. Two broad features are evident – a weak feature roughly centered at m, and a second, stronger feature, roughly centered at m. We identify the first as m PAH emission (Moutou et al. 1996), and the second as a blend of the [NeV] m and [ClII] m fine structure emission lines. The [NeV] line is a direct indication of the AGN nature of NGC 6240. The [ClII] line has been seen in the mid-infrared spectra of a number of starburst galaxies (Sturm et al 2000, Spoon et al. 2000, Devost et al. 2005). The broad, [NeV], [ClII] blend is not seen in other ULIRGs in our sample with [NeV] emission (see Fig.4b and Armus et al. 2005), and is not an instrumental artifact. In Fig. 4b we have overlayed the same part of the spectrum from Mrk 273, another nearby ULIRG with a strong [NeV] emission line (Armus et al. 2005). In Mrk 273 we see neither the m PAH nor the m [ClII] line. In NGC 6240 we have fit the [NeV] + [ClII] complex with two Gaussians having fixed positions, and widths equal to that measured for the isolated [NeIII] m line (Fig. 4c). Only the relative flux in the lines is allowed to vary. The [NeV] m emission line flux is then W cm-2. After removal of the [NeV] and [ClII] lines, the broad feature at m is fit with an single, un-constrained Gaussian. The [NeV] 14.3/[NeII] 12.8, and the [NeV] 14.3/[NeIII] 15.5 line flux ratios are then and , respectively. We have not detected the [NeV] m line, with an upper limit on the line flux of W cm-2. The [NeV] 14.3/24.3 line flux ratio is , comparable to that found for nearby, bright Seyfert 2 galaxies by Sturm et al. (2002).
5 Discussion
We have detected the [NeV] emission line in the IRS spectrum of NGC 6240. This is the first reported detection of this feature, and it provides a direct measure of the buried AGN. Although NGC 6240 does exhibit large-scale shocks from the superwind, it is unlikely that these shocks contribute to the [NeV] emission. As pointed out by Voit (1992), shock models tend to enhance the low-ionization lines (e.g., [NeII] or [SiII]). While our measured [NeII] 12.8/[NeIII] 15.55 line flux ratio of 2.8 is larger than found in most pure AGN models (Voit 1992), it is much lower than is typically found in shocks, where [NeII]/[NeIII] (Binette, Dopita & Tuohy 1985). It is, however, completely consistent with a moderate excitation starburst galaxy (Thornley et al. 2000, Verma et al. 2003). We therefore favor a model wherein the [NeV] emission in NGC 6240 comes from a coronal-line region in close proximity to one or both of the active nuclei, and that most of the observed [NeII] and [NeIII] emission is dominated by the surrounding starburst.
Pure AGN, and AGN-dominated ULIRGs, typically have [NeV]/[NeII] and [OIV]/[NeII] line flux ratios of and , respectively (Sturm et al. 2002, Armus et al. 2004). Starburst galaxies, on the other hand typicall have stringent upper limits on [NeV] ([NeV]/[NeII] ), yet a large range in [OIV]/[NeII] flux ratios, from (Sturm et al. 2002, Verma et al. 2003, Devost et al. 2005). Therefore, both the [NeV]/[NeII] and [OIV]/[NeII] line flux ratios in NGC 6240 are significantly below the AGN values, while the [OIV]/[NeII] ratio is on the high end, but still consistent with that found in some high-excitation starburst galaxies. If we use a simple linear mixing model (e.g. Sturm et al. 2002) wherein the observed values of [NeV]/[NeII] and [OIV]/[NeII] seen in NGC 6240 are due to “excess” [NeII] from the starburst, then both line ratios imply an apparent AGN contribution of about to the bolometric luminosity. The detection of a hot dust component, which is not seen in IRS spectra of starburst galaxies (Brandl et al. 2005), and which is responsible for of the bolometric luminosity, is additional indirect evidence for the buried AGN.
Fits to the Beppo-SAX, hard X-ray spectrum (Vignati et al. 1999) suggest an HI column density toward the active nucleus of cm-2, or an A mag. Correcting for this HI column implies an intrinsic 2-10 KeV, hard X-ray to bolometric luminosity of erg s-1, or a hard X-ray to bolometric luminosity ratio of , depending upon the unknown fraction of the X-ray flux which is reflected. This range is comparable to other AGN which typically have hard X-ray to bolometric flux ratios of (see Ptak et al. 2003 for a summary), suggesting that NGC 6240 has a rather “normal” hard X-ray to bolometric luminosity ratio for an AGN (Vignati et al. 1999). The extinction-corrected, hard X-ray data are therefore consistent with the buried AGN producing anywhere from of the luminosity in NGC 6240, with the larger values much more likely. Note, the typical (Elvis et al. 1994) QSO luminosity ratio is about 0.03.
While the [NeV]/[NeII] line flux ratio is often treated as reddening independent, this is not strictly true. Since the [NeV] is coming from gas directly heated by the AGN, while the [NeII] can be dominated by the extended starburst, the distribution of the dust in NGC 6240 (and other ULIRGs) can have a significant effect on the measured [NeV]/[NeII] emission-line flux ratio. This affect would typically be to lower the observed ratio, causing ULIRGs to look more starburst-like. Could the low [NeV] flux in NGC 6240 be the result of the large extinction implied by the X-ray spectrum ? Correcting the measured [NeV] emission by an A mag would produce an intrinsic [NeV]/IR flux ratio in NGC 6240 well above any other known AGN or ULIRG, so the hard X-ray derived extinction is not applicable. From our SED fit, the extinction to the warm dust is A mag. While large, this is still likely to be a lower limit to some lines of sight to the circum-nuclear region directly excited by the AGN. However, if we assume A mag to the coronal line region, and an intrinsic [NeV]/[NeII] line flux ratio of 1.0 for this AGN-heated gas, we derive a corrected [NeV]/[NeII] ratio of 0.24 (or 0.20 if we also extinction correct the [NeII] which is excited by the AGN). This implies the “intrinsic” AGN contribution is likely to be between , a number which is within the range estimated from the fits to the extinction-corrected, hard X-ray data.

![[Uncaptioned image]](/html/astro-ph/0511381/assets/x3.png)

References
- (1)
- (2) Armus, L., Heckman, T.M, & Miley, G.K. 1987, AJ, 94, 831.
- (3)
- (4) Armus, L., et al. 2004, ApJ Suppl., 154, 178.
- (5)
- (6) Armus, L., et al. 2005, in preparation.
- (7)
- (8) Brandl, B.R., et al. 2005, in preparation.
- (9)
- (10) Benford, D. 1999, PhD Thesis, California Institute of Technology.
- (11)
- (12) Devost, D., et al. 2005, in preparation.
- (13)
- (14) Draine, B.T. & Lee, H.M. 1984, ApJ, 285, 89.
- (15)
- (16) Draine, B.T. & Woods, D.T. 1990, ApJ, 363, 464.
- (17)
- (18) Draine, B.T. & Li, A. 2001, ApJ, 551, 807.
- (19)
- (20) Egami, E. 1998, in Proc. IAU Symposium 186, Galaxy Interactions at Low and High Redshift, ed. J. Barnes & D.B. Sanders (Dodrecht: Kluwer).
- (21)
- (22) Evans, A.S., Mazzarella, J.M., Surace, J.A., & Sanders, D.B. 2002, ApJ, 580.
- (23)
- (24) Fischer, J., Smith, H.A., & Glaccum, W. 1990, in Astrophysics with Infrared Arrays, ed. R. Elston (ASP Conf. Series).
- (25)
- (26) Fried, J.W., & Schulz, H. 1983, A&A, 118, 166.
- (27)
- (28) Fosbury, R.A.E., & Wall, J.V. 1979, MNRAS, 189, 79.
- (29)
- (30) Genzel, R., Lutz, D., Sturm, E., Egami, E., Kunze, D., et al. 1998, ApJ, 498, 589.
- (31)
- (32) Heckman, T.M., Armus, L., & Miley, G.K. 1987, AJ, 93, 276.
- (33)
- (34) Heckman, T.M., Armus, L., & Miley, G.K. 1990, ApJ Suppl., 74, 833.
- (35)
- (36) Herbst, T.M., et al. 1990, ApJ, 99, 1773.
- (37)
- (38) Higdon, S.J.U., et al. 2004, PASP, 116, 975.
- (39)
- (40) Houck, J.R., et al. 2004, ApJ Supplement, 154, 18.
- (41)
- (42) Imanishi, M., Terashima, Y., Anabuki, N., & Nakagawa, T. 2003, ApJ, 596, L167.
- (43)
- (44) Kim, D.C. & Sanders, D.B. 1998, ApJS, 119, 41.
- (45)
- (46) Klaas, U., et al. 2001, A&A, 379, 823.
- (47)
- (48) Laurent, O., et al. 2000, A&A, 359, 887.
- (49)
- (50) Lonsdale, C.J., Smith, H.E., & Lonsdale, C.J. 1995, ApJ, 438, 632.
- (51)
- (52) Lutz, D., Kunze, D., Spoon, H.W.W., & Thornley, M.D. 1998, A&A, 333, L75.
- (53)
- (54) Lutz, D., Veilleux, S., & Genzel, R. 1999, ApJ, 517, L13.
- (55)
- (56) Lutz, D., et al. 2003, A&A, 409, 867.
- (57)
- (58) Marshall, J.A., et al. 2005, in preparation.
- (59)
- (60) Mihos, C.J., & Hernquist, L. 1996, ApJ, 464, 641.
- (61)
- (62) Moshir, et al. 1990, IRAS Faint Source Catalog, V2.0.
- (63)
- (64) Moutou, C., Verstraete, L., Leger, A., Sellgren, K., & Schmidt, W. 2000, A & A, 354, L17.
- (65)
- (66) Murphy, T.W. Jr., Armus, L., Matthews, K., Soifer, B.T., Mazzarella, J.M., Shupe, D.L., Strauss, M.A., & Neugebauer, G. 1996, AJ, 111, 1025.
- (67)
- (68) Ptak, A., et al. 20003, ApJ, 592, 782.
- (69)
- (70) Reach, W.T., Morris, P., Boulanger, F., & Okumura, K. 2004, Icarus, in press.
- (71)
- (72) Rieke, G.H. et al. 1985, ApJ, 290, 116.
- (73)
- (74) Rigopoulou, Spoon, H.W.W., Genzel, R., Lutz, D., Moorwood, A.F.M., & Tran, Q.D. 1999, AJ, 118, 2625.
- (75)
- (76) Sanders, D.B., et al. 1988 ApJ, 325, 74.
- (77)
- (78) Smith, J.D.T., et al. 2004, ApJ Supplement, 154, 199.
- (79)
- (80) Solomon, P.M., Downes, D., Radford, S.J.E., & Barrett, J.W. 1997, ApJ, 478, 144.
- (81)
- (82) Spoon, H.W.W., Koornneff, J., Moorwood, A.F.M., Lutz, D., Tielens, A.G.G.M. 2000, A&A, 357, 898.
- (83)
- (84) Spoon, H.W.W., Keane, J.V., Tielens, A.G.G.M., Lutz, D., Moorwood, A.F.M., & Laurent, O. 2002, A & A, 385, 1022.
- (85)
- (86) Strauss, M.A., Huchra, J.P., Davis, M., Yahil, A., Fisher, K.B., & Tonry, J. 1992, ApJS, 83, 29.
- (87)
- (88) Sturm, E., et al. 2000, A & A, 358, 481.
- (89)
- (90) Sturm, E., et al. 2002, A & A, 393, 821.
- (91)
- (92) Tacconi, L.J., Genzel, R., Tecza, M., Gallimore, J.F., Downes, D., & Scoville, N.Z. 1999, ApJ, 524, 732.
- (93)
- (94) Tecza, M., Genzel, R., Tacconi, L.J., Anders, S., Tacconi-Garman, L.E., & Thatte, N. 2000, ApJ, 537, 178.
- (95)
- (96) Tran, Q.D., et al. 2001, ApJ, 552, 527.
- (97)
- (98) Van der Werf, P.P. 1996, in Cold Gas at High Redshift, ed. M.N. Bremmer, P.P. Van der Werf, H.J.A. Roettgering, & C.L. Carilli (Dodrecht: Kluwer).
- (99)
- (100) Verma, A., Lutz, D., Sturm, E., Sternberg, A., Genzel, R., & Vacca, W. 2003, A & A, 403, 829.
- (101)
- (102) Vignati, P., et al. 1999, Astron. & Astrophys., 349, 57.
- (103)
- (104) Voit, G.M. 1992, ApJ, 399, 495.
- (105)
- (106) Weingartner, J.C. & Draine, B.T. 2001, ApJ, 548, 296.
- (107)
| Feature ID | Flux | EQW | FWHM | |
|---|---|---|---|---|
| (m) | (erg cm-2s-1) | (m) | (km s-1) | |
| 5.34 | 18.9 (6.9) | 0.024 (0.009) | ||
| H2 S(7) | 5.511 | 33.7 (12.5) | 0.042 (0.015) | |
| PAH | 6.2 | 399 (44) | 0.52 (0.06) | |
| H2 S(5) | 6.909 | 95.2 (16.6) | 0.095 (0.016) | |
| 6.98 | 57.0 (15.5) | 0.057 (0.015) | ||
| PAH | 7.7 | 1876 (212) | 2.60 (0.28) | |
| H2 S(4) | 8.025 | 36.4 (10.8) | 0.058 (0.017) | |
| PAH | 8.6 | 439 (43) | 1.35 (0.13) | |
| H2 S(3) | 9.665 | 70.9 (1.9) | 0.2393 (0.0041) | 570 (60) |
| 10.511 | 3.8 (0.3) | 0.0099 (0.0004) | 411 (60) | |
| PAH | 11.3 | 475 (31) | 1.61 (0.10) | |
| H2 S(2) | 12.279 | 39.8 (0.5) | 0.0334 (0.0007) | 542 (60) |
| PAH | 12.6 | 522 (90) | 0.78 (0.14) | |
| 12.814 | 193.1 (3.7) | 0.1198 (0.0018) | 799 (60) | |
| PAH | 14.2 | 5.8 (1.1) | 0.005 (0.001) | |
| 14.322 | 5.1 (0.9) | 0.0087 (0.0008) | ||
| 14.368 | 3.6 (1.0) | 0.0072 (0.0009) | ||
| 15.555 | 70.4 (2.4) | 0.0625 (0.0019) | 828 (60) | |
| PAH | 16.4 | 22.4 (0.8) | 0.0198 (0.0008) | |
| H2 S(1) | 17.03 | 50.4 (1.5) | 0.0423 (0.0017) | 585 (60) |
| PAH | 17.4 | 7.3 (1.0) | 0.0055 (0.0010) | |
| 17.934 | 4.6 (0.7) | 0.0039 (0.0006) | 657 (62) | |
| 18.713 | 19.9 (1.4) | 0.0178 (0.0022) | 810 (120) | |
| 24.318 | ||||
| 25.890 | 27.2 (0.7) | 0.0234 (0.0006) | 674 (60) | |
| 25.988 | 23.1 (0.1) | 0.0210 (0.0003) | 624 (60) | |
| H2 S(0) | 28.218 | 8.6 (1.2) | 0.0032 (0.0004) | 439 (90) |
| 33.481 | 26.3 (8.4) | 0.0093 (0.0030) | 537 (60) | |
| 34.815 | 268.9 (10.1) | 0.0981 (0.0005) | 823 (60) |
Note. — Line fluxes and rest-frame equivalent widths for lines as measured in the IRS spectra. Uncertainties in the line fits (all single Gaussians except where noted) are listed in parentheses. In all cases, except for the [NeV] 14.32 and [ClII] 14.36 lines, these uncertainties are the larger of either the Gaussian fit or the difference in the two nod positions. For [NeV] 14.32 and [ClII] 14.36 the quoted errors are conservatively estimated at . The FWHM reported in column five is from a Gaussian fit to the SH or LH data, after removal of the instrumental profile, in quadrature. In all cases the error given for the FWHM is the larger of either the fit, or the known dispersion due to order curvature and undersampling (km s-1. FWHM are not listed for unresolved emission lines measured only in the SL data (those with wavelengths of m), or for the PAH features. All lines were measured using the SMART spectral reduction package (Higdon et al. 2004), except for the PAH features which were measured as a product of the multi-component model fits described in the text.