Infrared extinction by homogeneous particle aggregates of SiC, FeO and SiO2: comparison of different theoretical approaches
Abstract
Particle shape and aggregation have a strong influence on the spectral profiles of infrared phonon bands of solid dust grains. Calculating these effects is difficult due to the often extreme refractive index values in these bands. In this paper, we use the Discrete Dipole Approximation (DDA) and the T-matrix method to compute the absorption band profiles for simple clusters of touching spherical grains. We invest reasonable amounts of computation time in order to reach high dipole grid resolutions and take high multi-polar orders into account, respectively. The infrared phonon bands of three different refractory materials of astrophysical relevance are considered - Silicon Carbide (SiC), Wustite (FeO) and Silicon Dioxide (SiO2). We demonstrate that even though these materials display a range of material properties and therefore different strengths of the surface resonances, a complete convergence is obtained with none of the approaches. For the DDA, we find a strong dependence of the calculated band profiles on the exact dipole distribution within the aggregates, especially in the vicinity of the contact points between their spherical constituents. By applying a recently developed method to separate the material optical constants from the geometrical parameters in the DDA approach, we are able to demonstrate that the most critical material properties are those where the real part of the refractive index is much smaller than unity.
Grain growth by aggregation is an important process in dense cosmic environments as well as in the Earth’s atmosphere. Besides influencing dynamic properties it also changes the absorption and scattering properties of the solid dust particles for electromagnetic radiation (e.g. [1, 2]). This is especially true in spectral regions where resonant absorption occurs, such as the phonon bands in the infrared (IR). It is quite well known that shape and aggregation effects actually determine the band profiles of such absorption and emission bands, which hinders e.g. the identification of particulate materials by their IR bands. Despite many detailed investigations the full understanding of the influence of grain aggregation is still lacking, due to the complicated nature of the problem (e.g. [3, 4]).
We have investigated different simplified cluster shapes, as a means to compare how the numerical codes which are often used in astrophysical calculations manage to converge. The clusters consist of 5, 7 and 8 particles and are of significantly different shapes. For the material properties we have considered three astrophysically relevant materials differing in their optical properties; Silicon Carbide (SiC), Wustite (FeO) and Silicon Dioxide (SiO2).
The paper is structured such that Sect. 1 presents a description of the cluster shapes, Sect. 2 provides a description of the different materials considered and their optical properties. In Sect. 3 the numerical methods used for determining the extinction of the clusters are described. Sections 4 and 5 describe our results for the cluster-of-spheres method and the DDA calculations, respectively, and describe the convergence problems encountered by the different methods. Sect. 6 offers our conclusions.
1 Cluster Structures
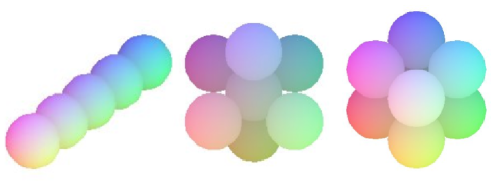
We consider clusters of identical touching spherical particles arranged in three different geometries: fractal, cubic, and linear. For a high precision of the calculations, we restrict the number of particles per cluster to less than 10.
We have selected three main geometries, namely a “snowflake 1’st–order prefractal” cluster (fractal dimension , [5]), where one sphere is surrounded by six others along the positive and negative cartesian axes, a cluster of eight spheres arranged as a cube and a linear chain of five spheres. All of the clusters (Fig. 1) consist of homogeneous spheres with radii nm and embedded in vacuum (or air).
2 Infrared properties of our materials
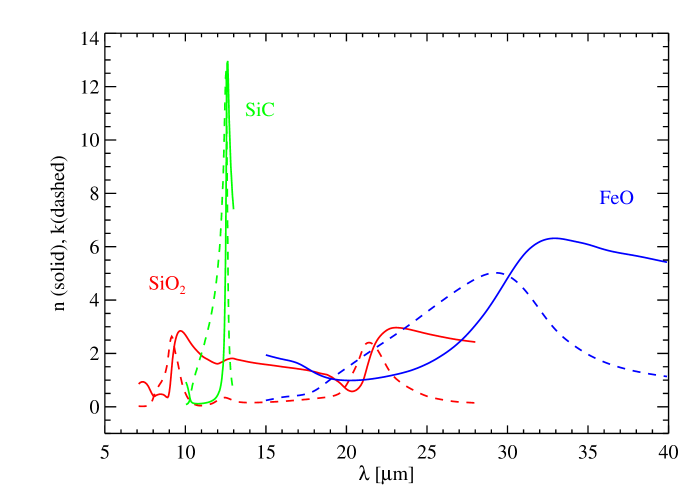
In order to study the convergence of the different codes, we chose three different materials of which our clusters are composed: crystalline -SiC, crystalline FeO and amorphous SiO2. These solids differ significantly from each other in their infrared properties. First, while -SiC and FeO have only one mid-infrared resonance, amorphous SiO2 has three of them. Second – and more importantly – the minima and peak values of these materials’ optical constants are very different from each other, see Fig. 3. Roughly speaking, the maximum and values of FeO, by reaching 5–6 close to 30 m, amount to only 50% of those of -SiC in its resonance at 12.6 m, and the same holds true for SiO2 as compared to FeO. Due to its sharp resonance, -SiC not only reaches a very high maximum, but also a very deep minimum of , which makes the calculation of its absorption and scattering behaviour especially difficult (see also Sect. 4 and 5). More details on the maxima of and as well as the minima of for SiC, FeO and SiO2 can be found in Tab. 1.
| Resonance | nmax | (nmax) | nmin | (nmin) | kmax | (kmax) |
|---|---|---|---|---|---|---|
| [m] | [m] | [m] | ||||
| -SiC | 13.0 | 12.6 | 0.12 | 10.8 | 12.6 | 12.5 |
| FeO | 6.3 | 33.0 | 0.99 | 20.3 | 5.0 | 29.2 |
| SiO2, r1 | 2.8 | 9.8 | 0.36 | 8.9 | 2.6 | 9.2 |
| SiO2, r2 | 1.8 | 12.8 | 1.62 | 11.9 | 0.3 | 12.4 |
| SiO2, r3 | 2.9 | 22.7 | 0.58 | 20.4 | 2.4 | 21.3 |
The optical constants used for the amorphous SiO2 we got from [7] and for FeO from [8]. The data for -SiC were calculated from a Lorentz oscillator model according to [9], assuming a damping constant, , of 10 cm-1. It should be noted that high-quality (terrestrial) SiC is characterized by damping constants of only 1–3 cm-1, implying an even sharper resonance than for = 10 cm-1. However, circumstellar SiC is almost certainly characterized by an imperfect lattice structure, corresponding to a damping constant significantly larger than 3 cm-1 (see [9] for more details).
SiC, FeO and SiO2 are not only among the potential condensates in circumstellar shells, but due to the above indicated values of their infrared optical constants also well-suited for testing the convergence of the different codes delivering the cluster absorption and scattering effiencies. As we are going to show, covergence in the absorption efficiency calculations cannot be reached by means of the codes we used for materials with optical constants reaching as deep minima and as high maxima of as -SiC does; but also for a material like amorphous SiO2 the convergence of our calculations is very slow.
3 Computational approaches
The clusters-of-spheres calculations have been performed using (1) the T-matrix code by D.W. Mackowski (SCSMTM) calculating the random-orientation scattering matrix for an ensemble of spheres [10] and (2) the program developed by M. Quinten [11] (MQAGGR, commercially available) based on the theoretical approach by [12]. Both programs aim at solving the scattering problem in an exact way by treating the superposition of incident and all scattered fields, developed into a series of vector spherical harmonics. Available computer power, however, forces to truncate the series at a certain maximum multipolar order L = npolmax, which in both programs can be specified explicitly. Furthermore, both programs perform an orientation average of the cluster, the resolution of which was set to 15 degrees in MQAGGR and 10 degrees in SCSMTM for theta (the scattering angle). The variation in the azimuthal angle is not specified in SCSMTM. In MQAGGR it is varied between 0 and 360 degrees, again with a resolution of 15 degrees.
The discrete dipole approximation (DDA) method is one of several discretization methods (e.g. [13, 14]) for solving scattering problems in the presence of a target with arbitrary geometry. In this work we use the DDSCAT code version 6.1 by B.T. Draine and P.J. Flatau [15], which is very popular among astrophysicists. In DDSCAT the considered grain/cluster is replaced by a cubic array of point dipoles of certain polarizabilities [16]. The cubic array has numerical advantages because it allows a significant speedup of the conjugate gradient method, applied to solve the matrix equations describing the dipole interactions, by using Fast Fourier Transforms. By specifying an appropriate grid resolution, calculations of the scattering and absorption of light by inhomogeneous media such as particle aggregates can be carried out to in principle whatever accuracy is required. The size of the dipole grid is in reality limited by the available computing power.
M. Min et al. [17] have presented an easy to use method to compute the absorption and scattering properties of small particles with arbitrary shape, structure, orientation and composition based on a solution of the DDA equations in the Rayleigh domain. For a given geometrical shape of the particles, the solution has to be computed only once to obtain the absorption and scattering properties for arbitrary values of the refractive index. This method thus provides a nice tool to study the dependence of the convergence behavior of the DDA on the value of the refractive index of the particle.
4 Convergence of the clusters-of-spheres method
For a pair of gold spheres, it has been shown already by [4] that the clusters-of-spheres method, when applied to touching particles, hardly yields convergent results when including multipolar terms up to an order of eight. By comparing their results – obtained according to the formalism by [12] – with the exact quasistatic solution for a pair of touching particles, Smith et al. found that especially for the longitudinal optical mode, the multipolar expansion up to L = 8 does not lead to satisfactory results. (Note that the values of n and k for gold near the 484 nm plasmon resonance peak studied by [4] amount to nres = 1.1 and kres = 1.8. Beyond , k() increases with .)
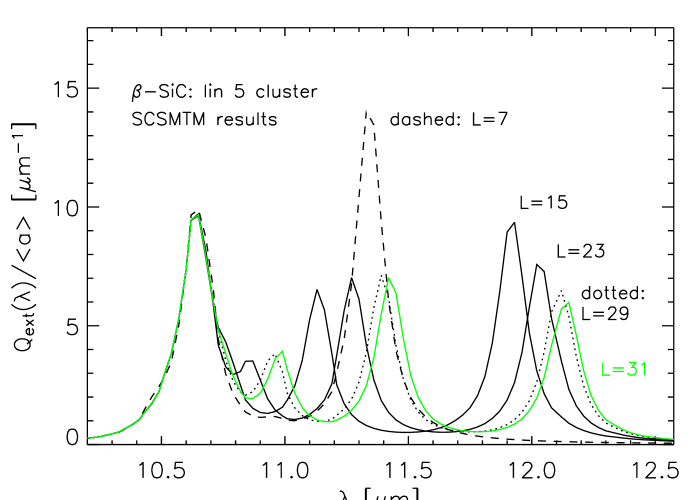
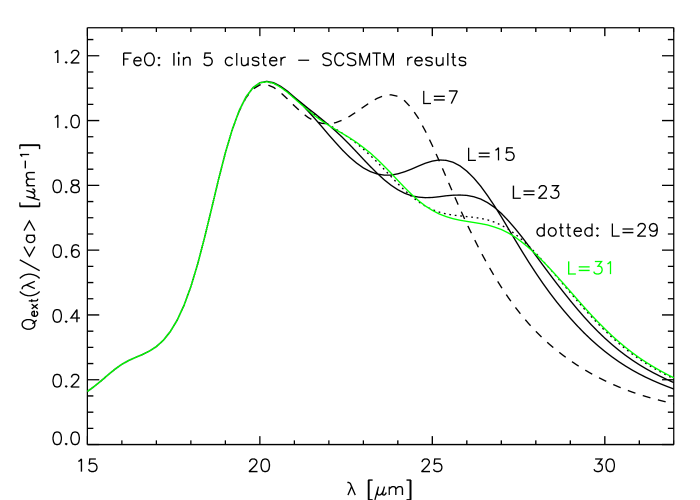
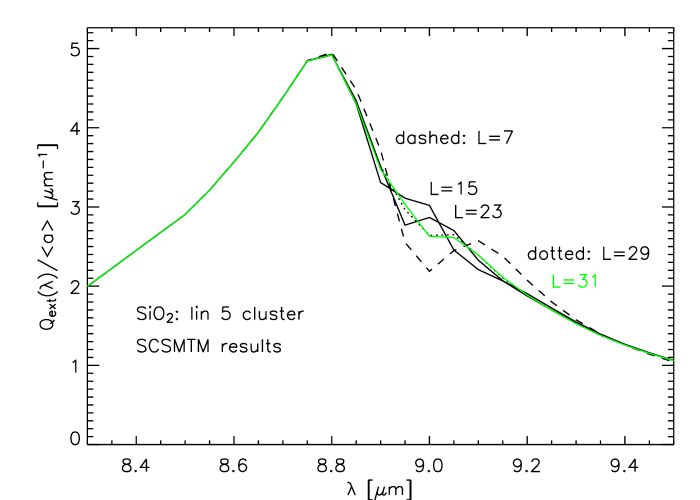
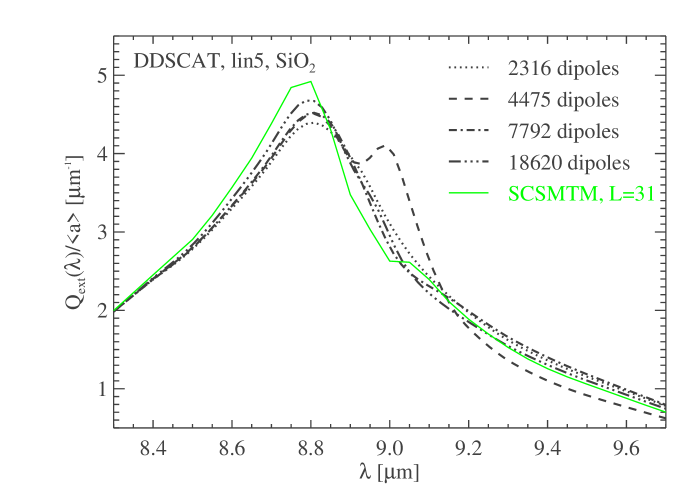
In our application of the clusters-of-spheres method, we came to similar conclusions, even though we included multipolar terms up to an order of L = 31. This is illustrated in Figs. 4 – 6, which show the extinction band profiles for the lin5 cluster of SiC, FeO and SiO2 spheres in the 10–12.5, 15–32 and 8.3–9.5 m wavelength ranges, respectively. The spectra are presented in terms of the extinction efficiency Qext=Cext/(a2), with Cext being the extinction cross section and a the radius of a sphere with the same volume as the cluster. Qext is normalized by a to become independent of a within the Rayleigh limit. In the figures we plot Qext/a because this quantity is independent of the particle size when the particles are in the Rayleigh limit.
For all three materials, a phonon band – split up into at least two components – is seen in the extinction spectrum. Also in all three cases, for the ‘blue’ component of the phonon band, convergence is achieved for L 20, while for the ‘red’ component(s), this is not the case, but instead, even for L = 31, there is a continuous peak shift if L is increased. Recall that our extinction spectra do not refer to specific orientations of the particle chain with respect to the external electromagnetic field, but are orientationally averaged. By studying specific orientations of the chains, it becomes evident that the ‘blue’ phonon band component corresponds to an orientation of the electric field perpendicular to the long axis of the chain, while the ‘red’ component corresponds to the complementary case. It is this latter case which causes the slow convergence. The convergence, however, also depends on the values of optical constants. For amorphous SiO2, with its smaller maximum values of n and k (cf. Tab. 1), the differences between the results for the individual multipolar orders are significantly smaller than for FeO with its larger peak values of n and k.
| Cluster | dipoles | dipoles | Cluster | dipoles | dipoles |
|---|---|---|---|---|---|
| in the grid | in the cluster | in the grid | in the cluster | ||
| lin5 | 48x16x16 = 12288 | 2316 | sc8 | 24x24x24 = 13824 | 7160 |
| lin5 | 60x60x60 = 216000 | 4475 | sc8 | 25x25x25 = 15625 | 8217 |
| lin5 | 72x48x32 = 110592 | 7792 | sc8 | 60x60x60 = 216000 | 111976 |
| lin5 | 80x80x80 = 512000 | 10515 | frac7 | 24x24x24 = 13824 | 1757 |
| lin5 | 90x60x40 = 216000 | 14845 | frac7 | 25x25x25 = 15625 | 2105 |
| lin5 | 96x48x24 = 110592 | 18620 | frac7 | 60x60x60 = 216000 | 28973 |

The 20 m phonon band of amorphous SiO2 (not shown in our figures) actually converges even faster than the the 9 m band. Here, convergence seems to be achieved for L31. This is probably due to the fact that Re(m) does not reach as low values as for the 9 m band. This dependence of the convergence on Re(m) is also observed with the DDA approach and will further be discussed in the next section.
5 Convergence of the DDA methods
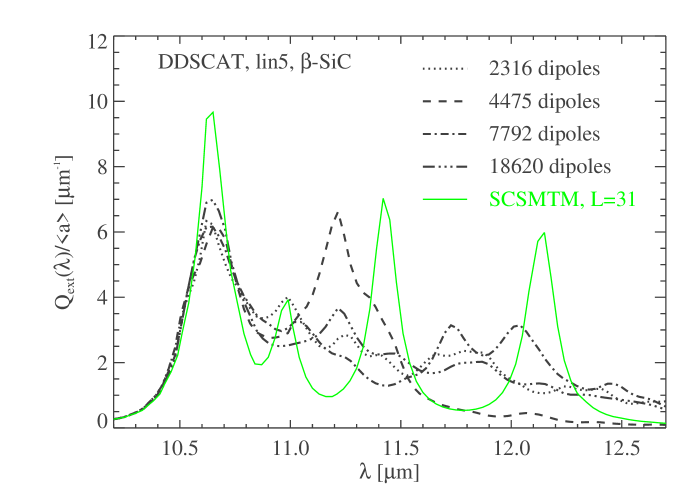
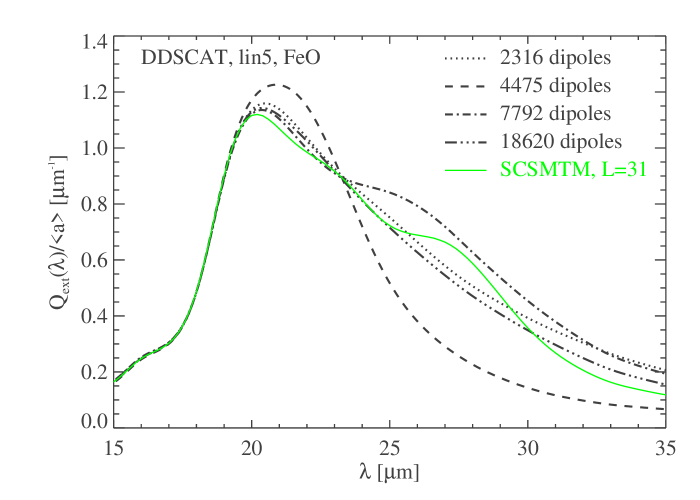
As well as the cluster-of-spheres methods, the DDA method also encounters difficulties with reaching convergence for the clusters we have chosen to study, see Figs. 7 – 10. For the lin5 cluster composed of SiC it is clear from Fig. 7 that we are most likely not even close to obtaining a converged result, although we have used rather large numbers of dipoles (see Tab. 2) for the calculations. This is especially true at wavelengths longward of the primary resonance at 10.6 m. Some of the spectra obtained show secondary resonances similar to the SCSMTM results whereas others are relatively flat. Similarly, for the FeO lin5 cluster the results seem to be converged towards the short-wavelength part of the spectrum shown in Fig. 8, but not towards the longer wavelengths, especially for one particular spectrum (4475 dipoles) which strongly differs from all others including the SCSMTM result. For SiO2 (Fig. 9) the DDSCAT calculation is closer to converging due to the lower values of the optical constants for this material as compared to FeO and SiC, see Tab. 1. However, again the 4475 dipole spectrum shows a secondary resonance which is neither present in the other three nor in the SCSMTM result. Similar results concerning the convergence were found for the two other cluster shapes studied frac7 and sc8, Fig. 10.
An influence of the refractive index values on the precision of the DDA is expected. For materials with large refractive index () [18] show that especially the absorption is overestimated by DDA. According to [18], the lattice dispersion relation prescription for the polarisability, , gives fair accuracy for scattering but poorer results for absorption. When is large, the continuum material is effective at screening the external field: in the limit the internal field generated by the polarization would exactly cancel the incident field, so that the continuum material in the interior of the target would be subjected to zero field. In the case of a discrete dipole array, the dipoles in the interior will also be effectively shielded, while the dipoles located on the target surface are not fully shielded and, as a result, absorb energy from the external field at an excessive rate. This error can be reduced to any desired level by increasing the number of dipoles, thereby minimizing the fraction of the dipoles which are at surface sites, but very large values of are required when is large [18].
At a closer view to the results of the DDA calculations, we found that the choice of the dipole grid is significant for the obtained result. For the linear five particle cluster lin5, a grid with a dipole number which is a multiple of five provides a significantly different result than dipole grids which are not a multiple of five. The former are the ones which generally produce stronger secondary resonances as can be seen from a comparison of the resulting spectra (shown in Fig. 7) with Tab. 2 (see also Fig. 11, which will be discussed later). For the semi-fractal seven particle cluster frac7 the difference was between dipole grids which were a multiple of three and for the cubic eight cluster sc8 it was for dipole grids which were a multiple of two, equivalent to the length scale of the longest chain within the cluster.
The results shown in Figs. 7 – 10 were calculated using DDSCAT [15] but identical results were found using the code by [17]. According to this solution the absorption cross section averaged over all orientations of an arbitrarily shaped particle obtained using DDA can be written as
| (1) |
where , is the material volume of the particle, is the number of dipoles. The , the so-called form-factors (not to be confused with the symbol for the multipolar order), and , the weights, are obtained from the DDA equations. Once the and the are found, it is trivial to compute the absorption cross section for any wavelength or complex refractive index, .
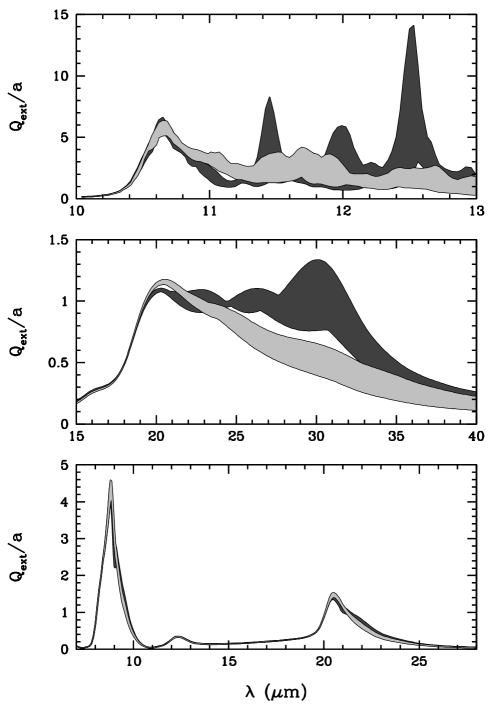

Fig. 11 shows a selection of results for the lin5 cluster, divided in into grids dividable and non-dividable by 5. It is obvious, especially for SiC and FeO, that the dividable grids produce secondary resonances, which lead to long-wavelength extinction enhancement but with a large spread. Consequently, they are the ones that contribute stronger to the convergence problems than the non-dividable grids.
The method by [17] allows to examine these effects in even more detail by investigating the origin of the resonances. According to Eq. 1, each form-factor causes a resonance in the complex plane at
| (2) |
In the limiting case the and form a continuous distribution, smoothing out all these resonances to a continuum function of . However, using a limited number of dipoles will result in a limited number of resonances. Especially for small values of , this resonance behavior might show up. The positions of these resonances are sensitive to the exact configuration of the dipoles in the particle. Thus it is very hard to obtain convergence using DDA for low values of .
The previous is illustrated in Fig. 12 where we plot in the contours the dimensionless quantity for the lin5 aggregate as a function of the real and imaginary part of the refractive index. We do not give any numerical values for the contour lines because we would like to focus on the general shape of the contours. In the upper panels it can be seen that there is a large difference between the contours obtained using different numbers of dipoles. It is clear in all plots that a number of resonances are present along the axis with . More generally speaking, the contours look very different over the whole complex space. If we zoom in on the region with moderate values of (the lower panels), we see that the differences between the 52 and the 54 wide dipole grids are almost gone in this region of the complex plane. All the differences between the contours shown in the middle two panels are located at very small values of . However, the grid of 50 and 55 dipoles width still displays a different shape of the contours. More generally, for this cluster shape there is a different behaviour when the number of dipoles along the long axis of the system is a multiple of five. This illustrates the bad convergence behavior of this cluster shape when using DDA.
6 Conclusions
We have studied the performance of two cluster-of-spheres ([10, 11]) and two discrete dipole approximation (DDA; [15, 17]) methods for calculating the extinction of aggregates. The methods were chosen because they are popular and often used in studies of astrophysical dust extinction and scattering problems.
We present results of the calculated extinction within infrared absorption bands of SiC, FeO and SiO2 clusters composed of 5 to 8 spherical particles of radii 10 nm. The clusters had three different shapes: linear chain, semi-fractal and simple cubic. The materials display a range of material properties and therefore have different strengths of the surface resonances. When the real part of the refractive index is much smaller than unity, none of the four methods are able to converge. For the two DDA methods there is a strong dependence of the calculated band profiles on the exact dipole distribution within the particles. For the linear five particle cluster lin5 the result depend on whether the grid is a multiple of five or not, for the semi-fractal seven particle cluster frac7 and the simple cubic eight particle cluster sc8 the dependence is on whether the grid is a multiple of three and two, respectively.
Currently it does not seem possible to calculate the absorption efficiencies of clusters of spheres for materials with optical constants in a reliable way. We assume that the critical point is the contact geometry of the particles, which explains the importance of the resolution of the methods used. This implies that for corresponding experiments it is of great importance to study the contact points between the particles. Without a good investigation of the contact points a comparison between experimental data and model calculations are very likely to be fruitless. One could hope that things might be easier when particles are less perfect than the spheres we have considered, since that will give rise to fewer resonance effects.
Acknowledgment
We would like to thank B.T. Draine and P.J. Flatau for making their DDA code and D.W. Mackowski for making his T-matix code available as shareware. HM acknowledges support by DFS grant Mu1164/5, MM would like to thank J.W. Hovenier for valuable discussions and TP acknowledges R. Ottensamer’s significant contributions to the SCSMTM calculations. Dark Cosmology Center is funded by the Danish National Research Foundation.
References
- [1] M. Min, C. Dominik, J.W. Hovenier, A. de Koter, L.B.F.M. Waters, “The 10 m amorphous silicate feature of fractal aggregates and compact particles with complex shapes”, Astron. Astrophys., in press (2005).
- [2] R. Stognienko, Th. Henning, V. Ossenkopf, “Optical properties of coagulated particles”, Astron. Astrophys. 296, 797–809 (1995).
- [3] A.C. Andersen, J. Sotelo, V. Pustovit, G. Niklasson, 2002, “Extinction calculations of multi-sphere polycrystalline graphitic clusters. A comparison with the 2175 Å peak and between a rigorous solution and discrete-dipole approximations”, Astron. Astrophys. 386, 296–307.
- [4] G.B. Smith, W.E. Vargas, G.A. Niklasson, J.A. Sotelo, A.V. Paley, A.V. Radchik, “Optical properties of a pair of spheres: Comparison of different theories”, Optics Communications 115, 8–12 (1995)
- [5] T. Vicsek, “Fractal models for diffusion controlled aggregation”, J. Phys. A 16, L647–L652 (1983).
- [6] D. Clément, H. Mutschke, Klein R., Th. Henning, “New laboratory spectra of isolated -SiC nanoparticles: Comparison with spectra taken by the Infrared Space Observatory”, Astrphys. J. 594, 642–650 (2003).
- [7] H.R. Philipp, “Silicon Dioxide (SiO2) (Glass)”, in Handbook of optical constants of solids, ed. E.D. Palik, Academic Press Inc., Orlando (1985), 749–763
- [8] Th. Henning, B. Begemann, H. Mutschke, J. Dorschner, “Optical properties of oxide dust grains”, Astron. Astrophys. Supp. 112, 112–143 (1995).
- [9] H. Mutschke, A.C. Andersen, D. Clément, Th. Henning, G. Peiter, “Infrared properties of SiC particles”, Astron. Astrophys. 345, 187–202 (1999).
- [10] D.W. Mackowski, M.I. Mishchenko, “Calculation of the T matrix and scattering matrix for ensembles of spheres”, J. Opt. Soc. Amer. A 13, 266–2278 (1996). (SCSMTM).
- [11] M. Quinten, U. Kreibig, “Absorption and elastic scattering of light by particle aggregates”, Appl. Opt. 32, 6173–6182 (1993). (MQAGGR).
- [12] J.M. Gérardy, M. Ausloos, “Absorption spectrum of clusters of spheres from the general solution of Maxwell’s equations. II. Optical properties of aggregated metal spheres”, Phys. Rev. B 25, 4204–4229 (1982)
- [13] B.T. Draine, “The discrete-dipole approximation and its application to interstellar graphite grains”, Astrophys. J. 333, 848–872 (1988).
- [14] J.I. Hage, J.M. Greenberg, “A model for the optical properties of porous grains”, Astrophys. J. 361, 251–259 (1990).
- [15] B.T. Draine, P.J. Flatau, “User guide for the discrete dipole approximation code DDSCAT 6.1”, http://arxiv.org/abs/astro-ph/030969 (2004). (DDSCAT).
- [16] J.J. Goodman, B.T. Draine, P.J. Flatau, “Application of FFT techniques to the discrete dipole approximation”, Opt. Lett. 16, 1198–1200 (1991).
- [17] M. Min, J.W. Hovenier, C. Dominik, A. de Koter, M.A. Yurkin, “Absorption and scattering properties of arbitrarily shaped particles in the Rayleigh domain: A rapid computational method and a theoretical foundation for the statistical approach”, JQSRT in press (2005).
- [18] B.T. Draine, J.J. Goodman, “Beyond Clausius-Mossotti - Wave propagation on a polarizable point lattice and the discrete dipole approximation”, Astrophys. J. 405, 685–697 (1993).