1]Department of Astronomy and Astrophysics, 525 Davey Lab, Penn State University, University Park, PA. 16802, USA 2]JILA, University of Colorado, Boulder, CO. 80309, USA 3]Department of Physics, North Carolina State University, Raleigh, NC. 27695, USA 4]Space Research Institute, Sofia, Bulgaria
Supernova Remnant 1987A: High Resolution Images and Spectrum from Chandra Observations
Abstract
We report on the morphological and spectral evolution of SNR 1987A from the monitoring observations with the Chandra/ACIS. As of 2005, the X-ray-bright lobes are continuously brightening and expanding all around the ring. The softening of the overall X-ray spectrum also continues. The X-ray lightcurve is particularly remarkable: i.e., the recent soft X-ray flux increase rate is significantly deviating from the model which successfully fits the earlier data, indicating even faster flux increase rate since early 2004 (day 6200). We also report results from high resolution spectral analysis with deep Chandra/LETG observations. The high resolution X-ray line emission features unambiguously reveal that the X-ray emission of SNR 1987A is originating primarily from a “disk” along the inner ring rather than from a spherical shell. We present the ionization structures, elemental abundances, and the shock velocities of the X-ray emitting plasma.
keywords:
supernovae; supernova remnants; X-rays1 Introduction
The continuous development of optically bright spots around the inner ring of supernova (SN) 1987A indicates that the blast wave shock is approaching the dense circumstellar material (CSM) that was produced by the massive progenitor’s equatorial stellar winds. In such a case, the blast wave shock front should decelerate by interacting with the dense CSM, and may produce significant soft X-ray emission. We have been monitoring the evolution of SN 1987A with the Chandra X-Ray Observatory since 1999, and found that the soft X-ray flux from SN 1987A has indeed been rapidly increasing (Burrows et al. 2000; Park et al. 2002;2004). The significant interaction of the blast wave with the dense CSM therefore signals the birth of a supernova remnant (SNR) 1987A. We successfully described the composite soft X-ray (0.52 keV) light curve, obtained with the ROSAT and the Chandra between 1990 and 2003, using a simple model that assumes a constant-velocity shock interacting with an exponential ambient density profile (Park et al. 2004;2005a). We report here the latest development of the X-ray light curves of SNR 1987A, in which we find a significant deviation of the soft X-ray flux from the previous model predictions since day 6200.
In addition to the regular monitoring observations, we have performed two deep Chandra gratings observations of SNR 1987A. The early observations with the High Energy Transmission Gratings Spectrometer (HETG) indicated a high-velocity shock (v 3400 km s-1) in which the X-ray emitting plasma is in electron-ion non-equilibrium (Michael et al. 2002). SNR 1987A was, however, faint and the detected photon statistics were limited. Recently, we performed follow-up deep observations of SNR 1987A with Low Energy Transmission Gratings Spectrometer (LETG) (Zhekov et al. 2005a). With the SNR being 8 times brighter and the exposure 3 times deeper than the early HETG observations, the new LETG data provide good photon statistics and allow us, for the first time, to measure the individual line profiles and line ratios from SNR 1987A. We present here some first results from these LETG data.
2 Observations
As of 2005 July, we have performed a total of eleven monitoring observations of SNR 1987A with Advanced CCD Imaging Spectrometer (ACIS) aboard Chandra (Table 1). We also have performed two deep gratings observations in 1999 October and 2004 August-September (Table 1). The data reduction of these observations have been described in literatures (Burrows et al. 2000; Park et al. 2005c; Michael et al. 2002; Zhekov et al. 2005a).
| Observation ID | Date (Age1) | Instrument | Exposure (ks) | Counts |
|---|---|---|---|---|
| 124+13872 | 1999-10-6 (4609) | ACIS-S + HETG | 116.1 | 6903 |
| 122 | 2000-1-17 (4711) | ACIS-S3 | 8.6 | 607 |
| 1967 | 2000-12-07 (5038) | ACIS-S3 | 98.8 | 9030 |
| 1044 | 2001-4-25 (5176) | ACIS-S3 | 17.8 | 1800 |
| 2831 | 2001-12-12 (5407) | ACIS-S3 | 49.4 | 6226 |
| 2832 | 2002-5-15 (5561) | ACIS-S3 | 44.3 | 6427 |
| 3829 | 2002-12-31 (5791) | ACIS-S3 | 49.0 | 9277 |
| 3830 | 2003-7-8 (5980) | ACIS-S3 | 45.3 | 9668 |
| 4614 | 2004-1-2 (6157) | ACIS-S3 | 46.5 | 11856 |
| 4615 | 2004-7-22 (6359) | ACIS-S3 | 48.8 | 17979 |
| 4640+4641+5362 | 2004-8-269-5 | ACIS-S + LETG | 289.0 | 165573 |
| +5363+60992 | (6400) | |||
| 5579+61782 | 2005-1-12 (6533) | ACIS-S3 | 48.3 | 24939 |
| 5580+63452 | 2005-7-14 (6716) | ACIS-S3 | 44.1 | 27048 |
1 Day since SN.
2 These observations were splitted by multiple sequences which were combined
for the analysis.
3 Photon statistics are from the zeroth-order data.
3 X-Ray Images
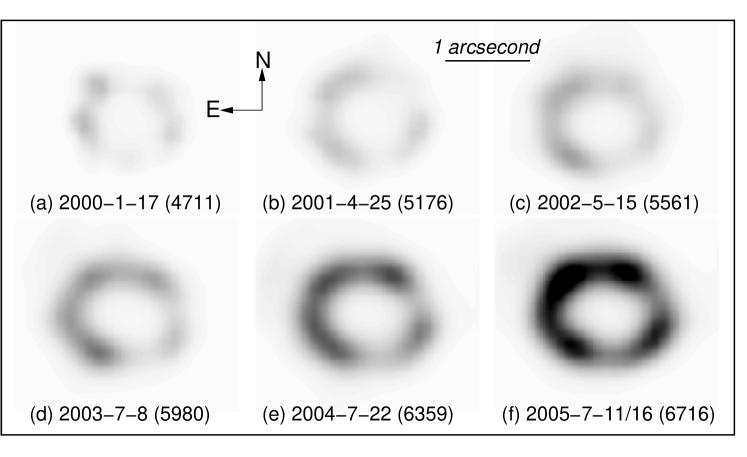
X-ray images of SNR 1987A from the ACIS observations are presented in Figure 1. Figure 1 shows images from six epochs which are separated roughly by 1 year from each other. The continuous brightening of the X-ray emission from the SNR is evident. The significant brightening of the remnant makes the X-ray morphology now a complete ring. This X-ray morphology suggests that the blast wave shock is now engulfing the entire inner ring rather than small clumps of the dense CSM.
4 X-Ray Flux

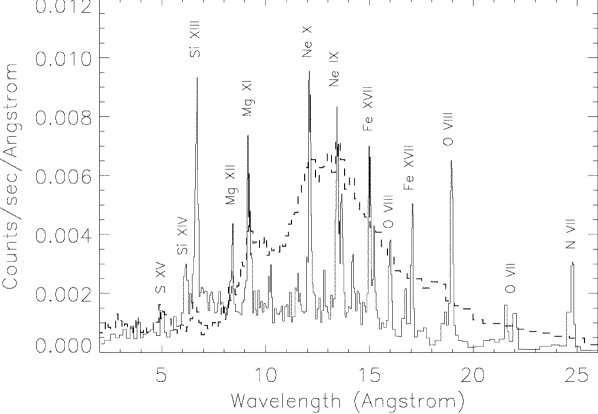
Figure 2 shows the ACIS spectrum of SNR 1987A from two epochs of 2000 January and 2005 July. The overall increase of the X-ray flux in the last 5.5 years is evident. Previous works reported that the electron temperature of the X-ray emitting plasma, measured by a single shock model, was decreasing from 3 keV (day 4600) to 2.2 keV (day 6200) (Park et al. 2004;2005a). Our latest data indicate an electron temperature of 1.6 keV as of 2005 July (day 6700), which confirms the overall spectral softening of SNR 1987A. As the overall spectral shape changes with the photon statistics significantly improving, the single-shock model, however, became unable to adequately fit the recently obtained data. A two-shock model is more useful approximation than a single-shock model in order to describe the observed spectrum by characteristically representing the decelerated and the fast shock components (e.g., Park et al. 2004). We thus fit the X-ray spectrum observed in each eleven epoch with a two-component plane-parallel shock model (Borkowski et al. 2001). The detailed description of the two-shock spectral modeling of SNR 1987A can be found elsewhere (Park et al. 2005c).
In the spectral fits, we fix some elemental abundances (relative to solar) at the values appropriate for the inner ring and the LMC ISM because contributions of the line emission from those species in the observed energy range are negligible: i.e., He (= 2.57), C (= 0.09) (Lundqvist & Fransson 1996), Ca (= 0.34), Ar (= 0.54), and Ni (= 0.62) (Russell & Dopita 1992). For other species of N (= 0.76), O (= 0.094), Ne (= 0.29), Mg (= 0.24), Si (=0.28), S (= 0.45), and Fe (= 0.16), we use the abundances measured with the spectral analysis of our deep LETG observations (Zhekov et al. 2005b), because we believe that the high resolution dispersed spectrum obtained from the deep LETG observations provides the best information on the elementral abundances. The best-fit models then indicate the electron temperatures of = 0.220.31 keV and 2.23.2 keV for the soft and the hard components, respectively. The soft component is most likely in collisional ionization equilibrium (ionization timescale 1013 cm-3 s), while the hard component is in non-equilibrium ionization condition ( 2 1011 cm-3 s). The best-fit total foreground column is = 2.35 1021 cm-2.

Based on the two-shock model, we present the X-ray light curves of SNR 1987A in Figure 3. The soft X-ray light curve shows that the observed flux significantly deviates from the extrapolation of the simple model used in previous works (the short-dashed curve) after day 6200. We interpret that this up-turn of the soft X-ray flux is caused by the shock recently beginning to interact with the entire inner ring rather than only with small protrusions of the CSM. In fact, the modified model (the solid curve), which considers the X-ray flux separately before and after the shock interacts with the dense CSM in order for a better description of such a condition, can successfully fit the overall soft X-ray light curve (Park et al. 2005b).
The light curves of the fractional contributions from the soft and the hard components to the observed 0.52 keV flux are presented in Figure 4. The contribution from the soft component was small and then continues to increase for the last five years to become dominant since day 6200. This long-term change in the fractional light curves suggests that the decelerated portion of the shock front by the interaction with the dense CSM has continuously increased and now the shock front is for the most part decelerated by the dense inner ring. The soft X-ray light curve and the fractional flux variations thus consistently support that the blast wave shock began to interact with the entire inner ring since day 6200.
5 Radial Expansion Rate
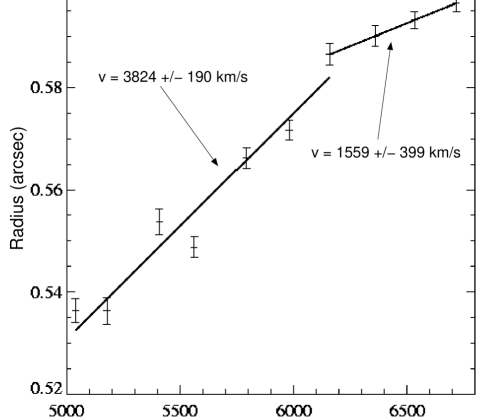
The radial expansion of the overall X-ray remnant of SN 1987A has been reported (Park et al. 2002;2004). The expansion rate was estimated to be 4200 km s-1 until day 5800 (Park et al. 2004). With the latest data, we perform X-ray measurements of the radial expansion rate of SNR 1987A using a more sophisticated image modeling than that by Park et al. (2002;2004). The detailed description of our image analysis for the expansion measurements can be found elsewhere (Racusin et al. 2005). We find a “break” in the radial expansion rate at around day 6200 where the rate becomes significantly lower from 3800 km -1 to 1600 km s-1 (Figure 5). The deceleration of the radial expansion rate of SNR 1987A is perhaps expected considering our picture of the blast wave everntually entering the dense CSM all around the inner ring. It is remarkable that the predicted deceleration of the expansion rate occurs at day 6200 which is coincident with the results from the soft X-ray light curves. The radial expansion rate of SNR 1987A is thus self-consistently supportive of the shock beginning to interact with the entire inner ring at day 6200.

6 Dispersed Spectrum
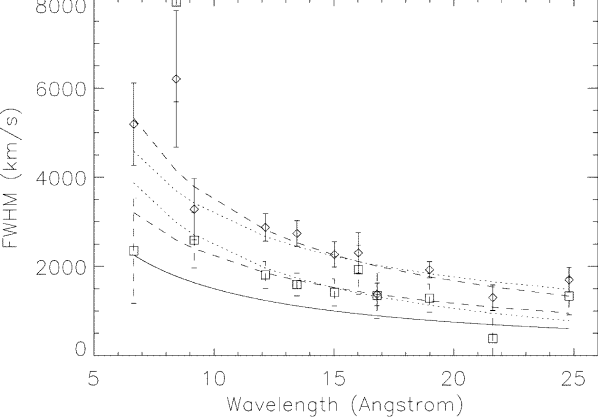
The dispersed X-ray spectrum of SNR 1987A obtained with deep LETG observations is presented in Figure 6. The fine structures of X-ray lines are clearly resolved with good photon statistics. The detailed discussion of the results from these LETG data can be found in Zhekov et al. (2005a;2005b). We note that we chose the roll-angle of the observations in order to align the dispersion axis in the north-south direction. With this observation setup, assuming that the bulk of X-ray emission originates from the interaction between the blast wave and the inner ring, we expected that the Doppler shifts due to the the orientation of the inner ring (an inclination angle of 45∘ with the north side toward the Sun) would result in systematic distortions of the dispersed images of SNR 1987A: i.e., the overall SNR image should be compressed in the negative ( = 1) arm while it is stretched in the positive ( = +1) arm. The measured line widths indeed reveal systematically larger broadenings in the positive arm than those measured in the negative arm (Figure 7). These line profiles provide the first direct evidence that the X-ray emission is originating from a “plane” containing the inner ring rather than from a spherical volume. These line broadenings imply shock velocities of v 3401700 km s-1.
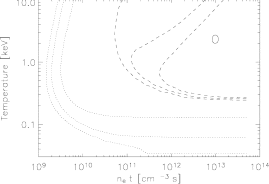
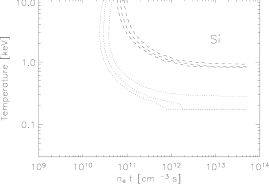
The deep LETG observations allow us to directly measure the line flux ratios from various X-ray lines of SNR 1987A (Zhekov et al. 2005a). In Figure 8, we present the ranges of the electron temperature () and the ionization timescale () derived from the plane-parallel shock model, which agree with the measured “G-ratios” of the He triplets (, where f, i, and r are the forbidden, intercombination, and resonance line intensities, respectively) and the He/Ly ratios from O and Si. Broad ranges of the electron temperature ( 0.12 keV) and the ionization timescale ( 10111013 cm-3 s) are consistent with the measured line ratios.
7 Discussion
The bulk of soft X-ray emission of SNR 1987A most likely originates from the interaction between the blast wave shock and the clumpy structure of the pre-existing (before the SN) dense equatorial CSM. The emergence of the first optical spot in day 3700 indicated the beginning of such interactions. Days 60006200 appear to mark another important milestone in the evolution of SNR 1987A: i.e., the blast wave reaches the dense CSM around the entire inner ring. This interpretation is supported by several observations.
(1) A simple model assuming a single shock propagating into ambient medium with an exponential density profile has successfully described the soft X-ray light curve for the previous 13 years. However, an up-turn of the soft X-ray flux since day 6200 cannot be described with the simple constant-velocity shock model. A significant contribution from the decelerated shock needs to be considered in order to adequately fit the data (Park et al. 2005b). (2) The fractional contribution to the observed 0.52 keV flux from the soft component of the two-shock model has continuously increased. The soft component represents the X-ray emission from the decelerated shock and becomes dominant since days 60006200 (Park et al. 2005b). (3) The X-ray radial expansion rate significantly reduces since day 6200 (Racusin et al. 2005). (4) The shock kinematics obtained by the LETG observations (at day 6400) indicate velocities of 3401700 km s-1 for the X-ray emitting plasma (Zhekov et al. 2005a). These velocities are significantly lower than those estimated from earlier X-ray and radio images (v 30004000 km s-1). (5) The soft X-ray images indicate that the brightening has become global since day 6000 (Park et al. 2005b). (6) The optically bright spots become prevailing over the entire inner ring by day 6000 (e.g., Plate 1 in McCray 2005).
On the other hand, the hard X-ray light curve shows significantly lower flux increase rate (Figure 3). It is remarkable that the hard X-ray light curve is similar to that of the radio data. The radio emission appears to primarily originate from the synchrotron emission behind the reverse shock (Manchester et al. 2005). The similarity between the radio and hard X-ray light curves might suggest that the hard X-rays originate from the same population of electrons to produce radio synchrotron emission. However, a better correlation of the radio image with the hard X-ray image than with the soft X-ray image is not clear (Park et al. 2005b). Thus, the lower flux increase rate in the hard X-ray band might simply be caused by the continuous softening of the X-ray spectrum due to the shock interaction with the dense CSM. Follow-up monitoring of the light curve, the morphology, and the spectral properties in the hard X-ray band will be essential to unveil the true origin of the hard X-ray emission of SNR 1987A.
With the recent deep LETG observations, we for the first time measure the individual X-ray line profiles from SNR 1987A (Zhekov et al. 2005a). The systematic difference in the line broadening between the positive and negative dispersion arms provide direct observational evidence for the X-ray emission originating in the equatorial plane of the inner ring. More surprisingly, the derived velocity (v 3401700 km s-1) of the X-ray emitting plasma is significantly lower than the average shock velocities estimated with the previous X-ray and radio data (v 30004000 km s-1). The low velocity suggests that the blast wave has been significantly decelerated by the dense inner ring, which is consistent with the results from the X-ray light curve and image analyses.
The X-ray line ratio measurements indicate that the X-ray emitting plasma of SNR 1987A cannot be adequately described by a single combination of the electron temperature and the ionization timescale. Instead, the observed X-ray lines originate from wide ranges of the plasma temperature and the ionization age. The multi-phases of the X-ray emitting thermal plasma of SNR 1987A was suggested by the undispersed spectrum and is clearly confirmed by the dispersed spectrum. This plasma structure is most likely due to the interaction of the blast wave with the complex density gradients near the boundary of the dense inner ring.
Acknowledgments
The authors thank L. Staveley-Smith for providing unpublished radio fluxes. This work was supported in part by SAO under Chandra grants GO4-5072A, GO4-5072B, and GO5-6073X.
References
- Borkowski et al. (2001) Borkowski, K. J., Lyerly, W. J., & Reynolds, S. P. 2001, ApJ, 548, 820
- Burrows et al. (2000) Burrows, D. N. et al. 2000, ApJ, 543, L49
- Hasinger et al. (1996) Hasinger, G., Aschenbach, B., & Trum̈per, J. 1996, A&A, 312, L9
- Manchester et al. (2005) Manchester, R. N. et al. 2005, ApJ, 628, L131
- McCray (2005) McCray, R. 2005, Cosmic Explosions, Proc. IAU Colloquium No. 192, ed., J. M. Marcaide and K. W. Weiler, (Heidelberg: Springer), 77
- Michael et al. (2002) Michael, E. et al. 2002, ApJ, 574, 166
- Park et al. (2002) Park, S. et al. 2002, ApJ, 567, 314
- Park et al. (2004) Park, S. et al. 2004, ApJ, 610, 275
- Park et al. (2005a) Park, S. et al. 2005a, AdSpR, 35, 991
- Park et al. (2005b) Park, S. et al. 2005b, ApJL, in press (astro-ph/0510442)
- Park et al. (2005c) Park, S. et al. 2005c, in preparation
- Racusin et al. (2005) Racusin, J. L. et al. 2005, in preparation
- Zhekov et al. (2005a) Zhekov, S. A. et al. 2005a, ApJ, 628, L127
- Zhekov et al. (2005b) Zhekov, S. A. et al. 2005b, in preparation