The dust-scattered X-ray halo around Swift GRB 050724
Abstract
This paper discusses the X-ray halo around the Swift -ray burst GRB 050724 (), detected by the Swift X-Ray Telescope. The halo, which forms a ring around the fading X-ray source, expands to a radius of within ks of the burst exactly as expected for small-angle X-ray scattering by Galactic dust along the line of sight to a cosmologically distant GRB. The expansion curve and radial profile of the halo constrain the scattering dust to be concentrated at a distance of pc (from Earth) in a cloud/sheet of thickness pc. The halo was observed only out to scattering angles of , for which the scattering is dominated by the largest grains, with a maximum size estimated to be m. The scattering-to-extinction ratio was estimated to be ; this is a lower limit to the true value because contribution from smaller grains, which scatter to larger angles, was not directly observed. The line-of-sight to the GRB passes close to the Ophiuchus molecular cloud complex, which provides a plausible site for the scattering dust.
Subject headings:
gamma rays: bursts — X-rays: general — Galaxy: structure — ISM:dust1. Introduction
Small-angle scattering of X-rays by dust grains can produce a ‘halo’ around a distant X-ray source, with a radial intensity distribution that depends on the dust properties and location (Overbeck 1965; Hayakawa 1970; Trümper & Schöfelder 1973). This effect was first detected by Rolf (1983) using Einstein observations of the bright X-ray binary GX , and has subsequently been observed around several other bright Galactic X-ray sources (e.g. Catura 1983; Predehl & Schmitt 1995; Predehl et al. 2000).
Gamma-ray bursts (GRBs) produce high X-ray fluxes for short periods, typically s. Viewed through a substantial column of Galactic dust, these impulsive X-ray events may produce halos that appear to expand on the sky because X-rays scattered at larger angles travel a slightly longer path length to the observer and suffer an increased time delay. This time delay, between the direct and scattered light, means the later observations of the scattered light provide a view of the GRB X-ray emission at earlier times and can, in principle, provide details of the location, spatial distribution and properties of the dust (e.g. Alcock & Hatchett 1978; Klose 1994; Miralda-Escudé 1999; Draine & Bond 2004). In particular, assuming the GRB to lie at a cosmological distance, the distance to the scattering dust can be measured from the radial expansion of the halo, because the halo size increases as , where is the time since the pulse of illuminating X-rays and is the distance between the dust and observer. Observations of GRB dust haloes can thereby provide very accurate distances to Galactic structures, as first demonstrated by Vaughan et al. (2004) using an XMM-Newton observation of the Integral GRB 031203.
This paper discusses the X-ray halo around GRB 050724, the first halo discovered by Swift (Romano et al. 2005) and only the second ever observed around a GRB. The rest of the paper is organised as follows: Section 2 discusses the Swift observations and basic data analysis; Section 3 describes the X-ray properties of the burst counterpart during the first few ks of the observation; Section 4 discusses the detailed analysis of the X-ray halo images; Section 5 uses the archival ROSAT and IRAS data to probe the ISM in the direction of the GRB; and finally the implications of the results of this analysis are discussed in Section 6. Throughout this paper the quoted errors correspond to % confidence regions unless stated otherwise.
2. Observations and data analysis
At 2005-07-24 12:34:09 UT the Swift Burst Alert Telescope (BAT; Barthelmy 2004) triggered and located GRB 050724 (Covino et al. 2005). The prompt BAT light curve showed a relatively short-lived spike, with a FWHM of s (Covino et al. 2005; Krimm et al. 2005), plus an extended low-flux tail lasting for at least s. As discussed by Barthelmy et al. (2005), this burst would have been classified a short burst if observed by BATSE. The total fluence was erg cm-2 (Krimm et al. 2005) over the keV band. The spectrum evolves from relatively hard during the s peak (photon index of ) to much softer () at s after the trigger.
The spacecraft slewed immediately to the BAT on-board calculated position; the Swift X-ray telescope (XRT; Burrows et al. 2004, 2005a) began observations at 12:35:22.9 UT (in automatic state), only s after the BAT trigger, and detected a rapidly fading, uncatalogued X-ray source at (J2000) RA=, Dec ′ (with a % confidence radius of ; Barthelmy et al. 2005). This position is close to the Galactic plane (); the expected column density of neutral Galactic gas along this line-of-sight (LoS) is cm-2 (as measured from cm maps; Dickey & Lockman 1990), and the reddening (from the IR dust maps of Schlegel, Finkbeiner & Davis 1998).
Follow-up observations revealed a variable optical and radio source within the XRT error circle ( ″ from the XRT position; Gal-Yam et al. 2005; Soderberg et al. 2005). A ks Chandra observation further refined the position of the fading X-ray source and showed it to be coincident with the optical and radio transient (Burrows et al. 2005b). Prochaska et al. (2005) identified the host galaxy of the transient to be a massive early-type galaxy at a redshift of (from Ca H+K and G-band absorption). See also Berger et al. (2005) for a discussion of the host galaxy optical spectrum.
The XRT collected data in Windowed-Timing (WT) mode from s post-burst (WT mode allows imaging in one spatial dimension only), after which time the data were taken in Photon Counting (PC) mode. WT mode allows imaging in one spatial dimension only, whereas PC mode produces two-dimensional images, see Hill et al. (2004) for a full description of the XRT operating modes. The XRT data were processed by the Swift Data Center at NASA/Goddard Space Flight Center (GSFC) to level data products (calibrated, quality flagged event lists). These were further processed with xrtpipeline v0.8.8 into level data products. In the subsequent analysis only event grades were used for the WT mode data and only grades were used for the PC mode data.
3. Early X-ray emission from GRB 050724
Spectra and light curves were extracted from the WT data using a pixel (″) wide box to define the source and background regions. For the PC mode data, source counts were accumulated from within a circle of radius pixels (″), and background data were accumulated within an annulus having inner and outer radii of and pixels (). The appropriate ancillary response matrices were generated using xrtmkarf v0.4.14.
The spectrum of the WT data ( s post-burst) was binned such that each spectral bin contained at least counts and fitted over the keV range111 The bandpass for the WT-mode spectral fit was restricted to energies above keV to avoid calibration uncertainties at lower energies. using XSPEC (Arnaud 1996). The spectral model comprised a power law continuum modified by two neutral absorbers (modelled using the TBabs code of Wilms, Allen & McCray 2000), one at and the other at , corresponding to neutral interstellar gas in our Galaxy and intrinsic to the GRB host galaxy, respectively. Allowing both column densities to be free parameters, this simple model gave a very good fit ( for degrees of freedom, dof) with best-fitting parameters as follows: , cm-2 and cm-2. The Galactic column density inferred from the X-ray spectrum exceeds that expected based on the cm measurements (see Section 2), by cm-2, and yet there is no clear excess absorption intrinsic to the host galaxy. Figure 2 shows the contours for the two absorption column densities.

4. X-ray halo analysis
4.1. Expansion curve

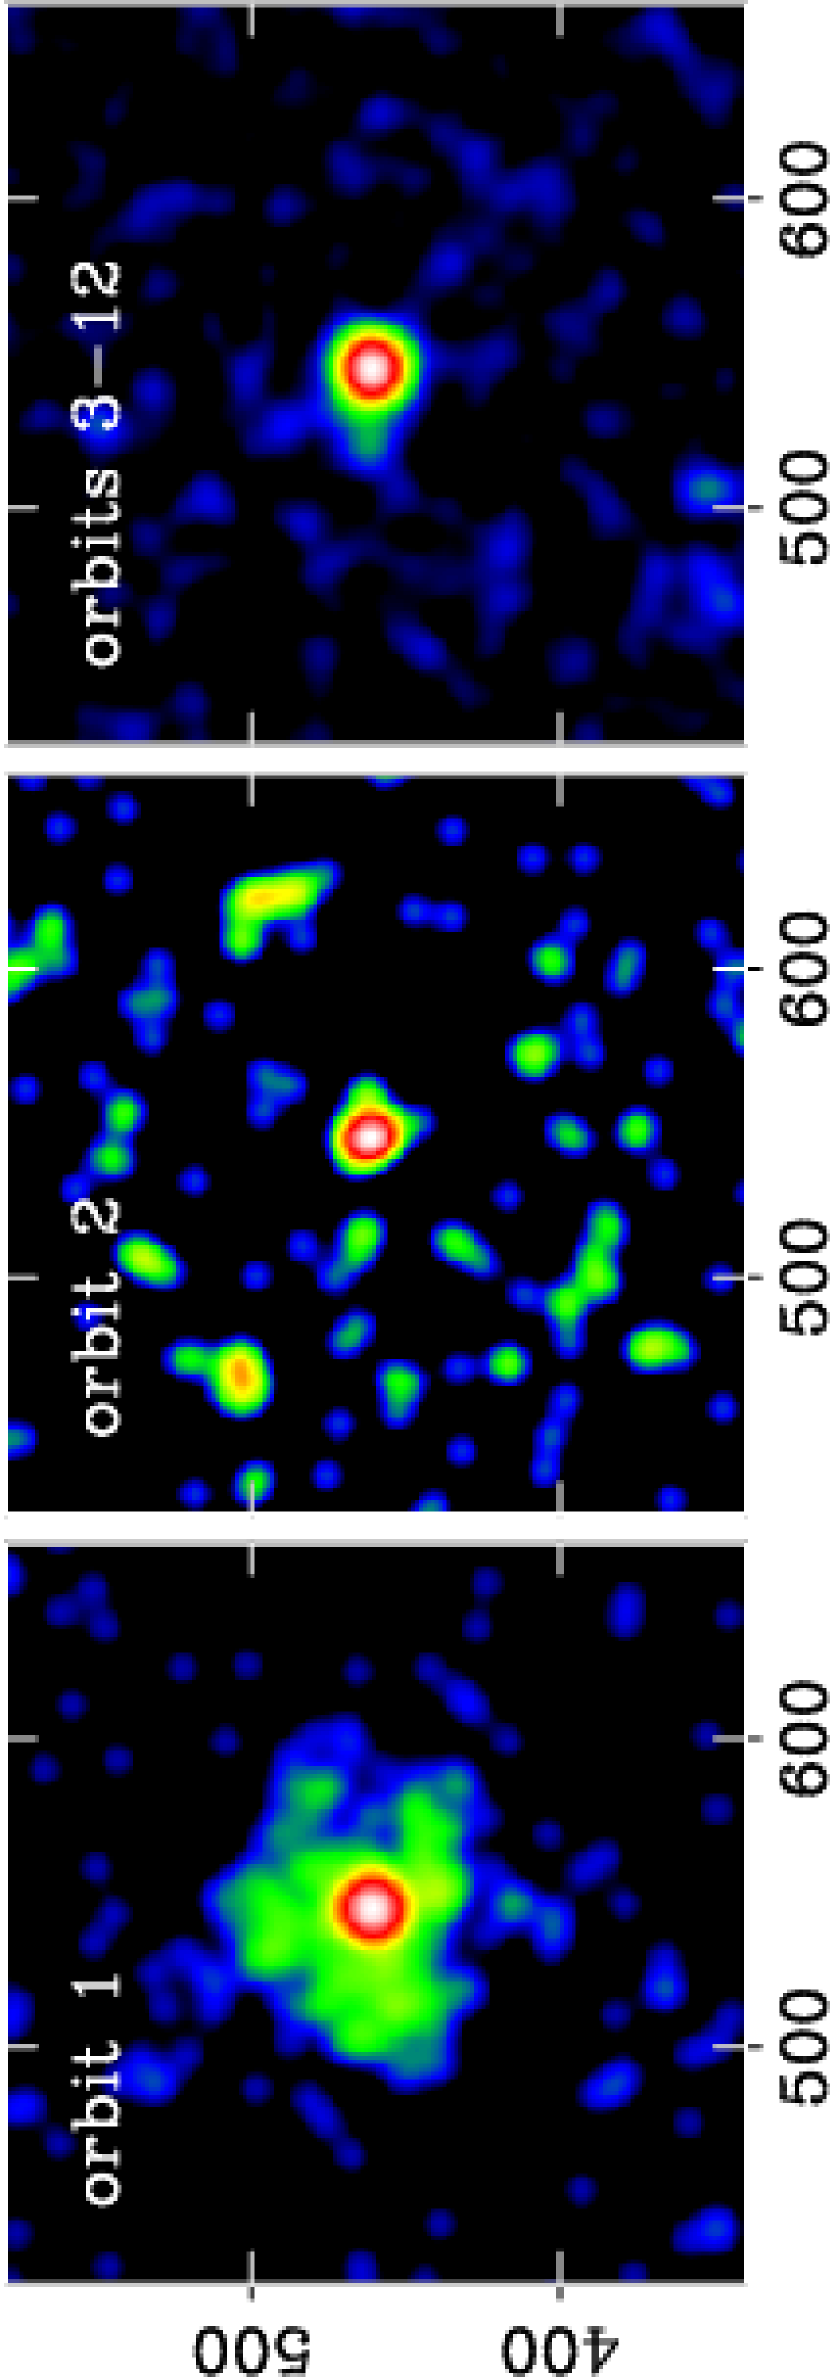
Figure 1 shows the XRT (PC mode) images from the first, second and later orbits of Swift, over the keV energy range (only events with energies keV were used since the halo has a soft spectrum, as discussed in Section 4.3, and was not detected above keV). The first orbit showed extended emission around the point-like GRB which was dispersed in the second orbit and was difficult to detect in later orbits. In order to better quantify this extension, images were accumulated in five non-overlapping time intervals: , , and s from the first orbit and s from the second orbit.
Radial profiles were calculated for each image by accumulating the counts in annuli centred on the GRB (see Figure 3). The expanding halo was revealed by the small but significant localised excess of counts, beyond the unresolved GRB222The Point Spread Function (PSF) of the XRT has a half-energy radius of , or FWHM at keV (Moretti et al. 2005; Burrows et al. 2004). The radius of the halo as a function of time, , was estimated by fitting each radial profile (using XSPEC) with a model comprising the PSF of the source (a King profile with parameters taken from ground based calibration data; Moretti et al. 2004, 2005) plus a constant background level (per pixel), integrated over the annular bin. A Gaussian was added to represent the profile of the halo, fixing the width to be equal to % of the radius: (see Section 4.2). The -statistic was used to find the maximum likelihood model parameters, appropriate for the case of few counts per bin (, where is the likelihood; Cash 1979). For each profile, the -statistic was minimised and the maximum likelihood position of the Gaussian was used as the radius of the halo in that image. The % confidence region for the radius was estimated using the values (see Figure 4).

Figure 5 shows the radius of the halo in each of the five time bins, as measured using the radial profiles. These data were fitted with the function , which describes the radial expansion of a dust-scattered halo following a (short) X-ray pulse at time (e.g. Trümper & Schöfelder 1973; Klose 1994; Miralda-Escudé 1999; Draine & Bond 2004). Strictly speaking, this assumes a very narrow pulse of X-rays and an intrinsically narrow dust scattering screen. The value of corresponds to the typical arrival time of direct (un-scattered) photons, which will be after since the GRB 050724 remained X-ray bright from until s, meaning almost all the direct X-rays actually arrived after . The best-fitting values of the free parameters were: (with measured in arcsec) and s after . This model gave a good fit, with for dof. In order to check whether the best-fitting value of is plausible, the mean arrival time for the direct X-rays was estimated using the X-ray light curve from the joint BAT-XRT data (Figure 3 of Barthelmy et al. 2005): the flux-weighted photon arrival time333 The flux-weighted photon arrival time was calculated as where is the X-ray light curve. over this light curve was s, consistent with the best-fitting from the radial expansion curve.
The normalisation, , describes how fast the halo expands and is uniquely determined by the distance to the dust444 The halo shape is affected by the geometry of the scattering region, and it may not be circular and centred on the GRB image if the scatterer is in the form of a plane-parallel slab not perpendicular to the line-of-sight, or is curved (see Tylenda 2004 for a discussion). However, because of the large ratio of dust distance to halo size, only the most pathological geometries (e.g. slab included at ) will produce any observable effect. . Assuming the GRB to be at a cosmological distance . The best-fitting normalisation predicts a distance to the scattering medium of pc, where the % confidence region was calculated with as a free parameter555 This distance estimate is smaller than that given in Romano et al. (2005) because that earlier analysis assumed , an assumption not made in the present analysis.
This distance measurement is quite robust to the choice of function used to parameterise the halo radial profile. This was demonstrated by repeating the radial profile fitting using different functions to model the halo profile. For each one the halo expansion curve was measured and the distance calculated from its best-fitting normalisation. A Gaussian of fixed width () gave pc, a Lorentzian of fixed width () gave pc and a King model as used to model the PSF (see above) gave pc. These different estimates are all well within the confidence region of the original estimate, demonstrating that any systematic errors introduced by the choice of radial profile model are smaller than the quoted statistical error.

4.2. Co-moving radial profile
The radial profile of the halo was examined in more detail by summing the five radial profiles (Figure 3), after adjusting the size of the radial bins to correct for the expansion of the halo. A constant background level, estimated from the mean level at large radii, was subtracted from each profile before combining them. The result is shown in Figure 6. This shows that the average radial profile of the halo, after correcting for its expansion, was reasonably narrow. Fitting this profile using a Gaussian to model the halo gave a relative width of (% confidence limit).
The observed radial width of the halo is a combination of four terms: () the time profile of the illuminating X-ray pulse; () the radial distribution of the dust along the line of sight, () the PSF of the XRT, and () the radial expansion of the halo over the length of an exposure. Term () is negligible since the time duration of the initial pulse is short compared to the times (since burst) of the halo images ( s). The XRT PSF (with FWHM of ) gives rise to a fractional width of % in the first image to % in the last, meaning term () must contribute significantly to the measured width. The co-moving radial profile is dominated by counts from later images (with longer exposures), during which the fractional increase in the halo radius – term () – was %. The measured width of the halo may therefore be explained entirely by terms () and (), implying the remaining term, the radial thickness of the dust, must be small. A very conservative limit on the physical thickness of the dust cloud along this line of sight is pc. Most likely the dust is confined in a much narrower region.

4.3. Halo spectrum
The spectrum of the halo was extracted from the first orbit of data using an annular extraction region with inner and outer radii of and pixels ( arcsec), respectively. A background spectrum was extracted from an annulus with radii of and pixels and an appropriate ancillary response file was generated. Due to the small number of counts () the spectrum was fitted using the -statistic, rather than binning to counts per bin and fitting using the statistic, which would result in very few bins. The spectral model used was an absorbed power law, with the neutral absorption column density fixed at the value obtained from the early XRT spectrum ( cm-2; section 3). The data are shown in Figure 7. The best fitting photon index was , significantly steeper than the GRB X-ray spectrum (), as expected due to the strong energy dependence of the dust scattering cross section. The model gave a good fit, with a rejection probability of only estimated using Monte Carlo simulations. The mean photon energy in the binned, background subtracted halo spectrum was keV.

4.4. Halo flux as a function of angle
The flux decay of the halo was also estimated using the radial profile of the combined image from orbits and (over which the halo is well-detected). Counts were accumulated in annuli of width ( pixels) and background subtracted assuming a constant background level per pixel estimated from an annulus enclosing . The sampling of the halo as a function of angle is incomplete, due to the incomplete time coverage of the observation, therefore radii over which the halo was not observed were masked out of the radial profile. The masking was done by converting the times of the observations into radii using the best-fitting expansion curve (Figure 5) and removing all radial bins containing unobserved angles. The result is shown in Figure 8.
The total fluence of scattered light (in the halo), , should be related to the direct light (i.e. un-scattered light from the GRB), , by:
| (1) |
where is the scattering optical depth, with the total scattering cross-section and is the dust grain column density along the LoS (e.g. equation 14 of Mauche & Gorenstein 1986, henceforth MG86). For low optical depths (), where multiple scattering is insignificant, this can be approximated by . The above quantities represent the entire halo (integrated over all scattering angles) but the scattering cross-section is a function of angle which defines the halo fluence per unit angle. In the Rayleigh-Gans approximation666 Smith & Dwek (1998) demonstrated that the Rayleigh-Gans theory and the more exact Mie theory are in close agreement for photons energies keV and typical grain sizes. the differential scattering cross-section for a spherical grain of size (in units of m) is given by:
| (2) |
(equation 2.2 of Hayakawa 1970) where is a normalisation that depends on the energy of X-rays being scattered, and is the spherical Bessel function of the first order. The central core of this function is approximately Gaussian, leading to a halo with a characteristic size arcsec (equation 6 of MG86; Hayakawa 1970). Using equation 2 the scattered fluence in the halo per unit scattering angle is:
| (3) | |||||
which peaks at .
This function was fitted to the data (solid curve in Figure 8) yielding a best-fitting value of m (with a % confidence region of m), assuming a typical energy of keV for the scattered X-rays (see section 4.3). The scattering of soft X-rays is dominated by the largest grains, due to the strong dependence of the scattering cross-section on grain size (the total scattering cross section, integrated over all angles is ), and so this estimate for corresponds to grains close to the maximum grain size. This best-fitting model was integrated over all angles to estimate the total halo fluence of counts (where the error was approximated by the % fractional error on the total observed halo fluence).
The above calculation is valid for a single grain size which should be a reasonable approximation given the strong dependence of the scattering cross-section on . The presence of smaller grains will however cause the halo fluence to fall off less rapidly at large angles and this extended ‘tail’ could contain substantial additional fluence. In order to investigate the consequence of a continuous grain size distribution, equation 3 was re-calculated at each angle by integrating over the grain size distribution . The size distribution was assumed to follow that of Mathis, Rumpl & Nordsieck (1977; hereafter MRN):
| (7) |
The revised function was fitted to the data assuming m and , yielding a best-fitting m (with a % confidence region m), this is slightly larger than, but not inconsistent with other estimates derived from X-ray haloes (MG86; Predehl et al. 1991; Clark 2004). The best-fitting model is also shown in Figure 8 (dot-dashed curve). The fit is not very sensitive to 777 Using m or m changed the fit statistic by only or , respectively. as long as and . The total fluence in this model, integrated over all angles, was virtually identical to the single grain size model ( counts), although the fluence could be higher if there is a greater contribution from smaller grains scattering to larger angles that were not directly observed.

4.5. Scattering optical depth
Given the above estimate of the halo fluence, , it is possible to estimate the dust scattering optical depth once the direct GRB X-ray fluence, , is known. This latter quantity can be estimated by integrating the combined XRT-BAT light curve of the burst. Figure 3 of Barthelmy et al. (2005) shows the X-ray light curve of GRB 050724 from . This was produced using the XRT observations after s, and the keV BAT light curve extrapolated into the XRT band based on a spectral fit to the simultaneous BAT and XRT spectrum. During the first s after the trigger the X-ray source was bright; the WT data contain source counts ( keV). The extrapolated BAT data predict almost exactly the same number of counts prior to the start of the XRT/WT observation. Although there will be a systematic error associated with the extrapolation of the BAT data to lower energies, the tight agreement between BAT and XRT data in the interval of overlap suggests this is likely to be small (Barthelmy et al. 2005). Together these give a total of counts. Combining this with the value of section 4.4 gave . Making an approximate correction to an effective scattering optical depth at keV gives (with the mean scattered photon energy in keV).
5. ISM towards GRB 050724
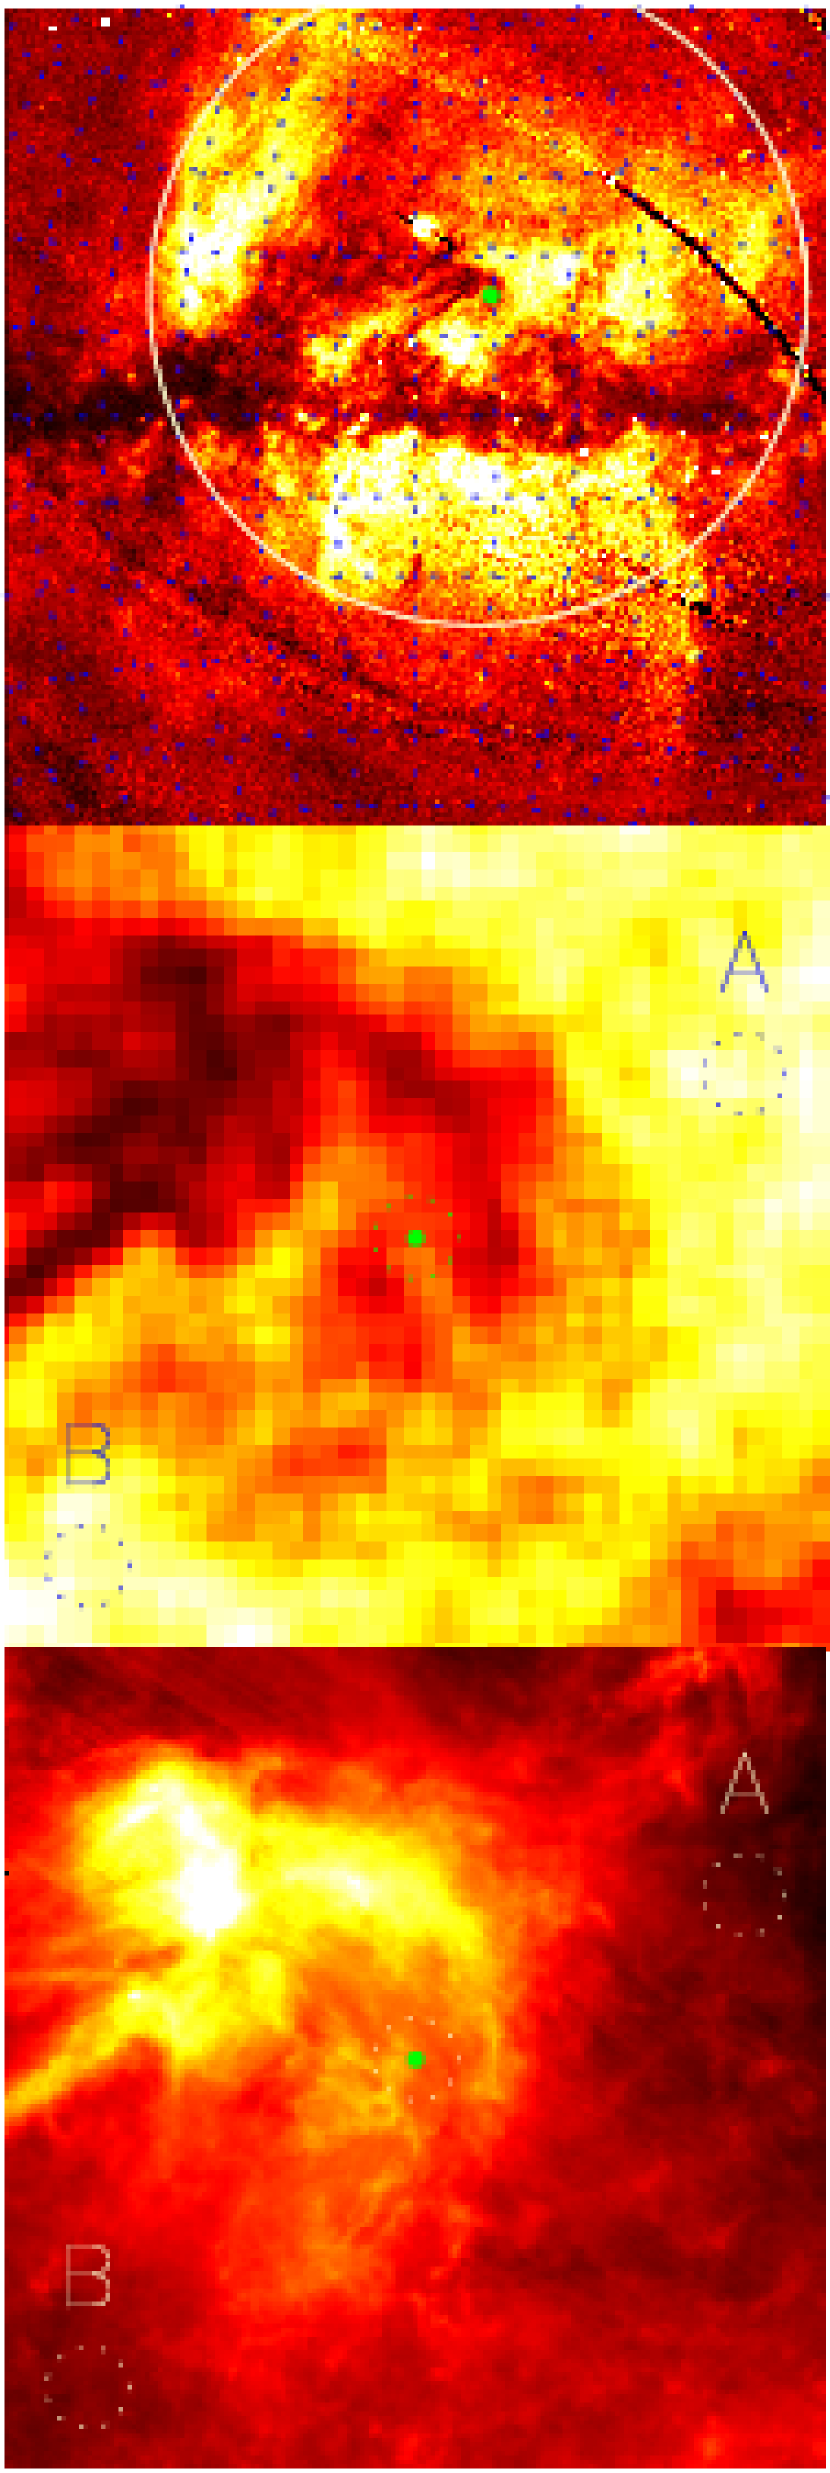
Archival ROSAT and IRAS data were used to constrain the ISM in the direction of GRB 050724. The top two panels of Figure 9 show the soft X-ray sky around GRB 050724, derived from the ROSAT All-Sky Survey (RASS) data in the keV band, and the bottom panel shows the IRAS All-Sky Survey m map of the region. These images reveal structures dominated by the Ophiuchus molecular cloud complex casting the dark ‘shadows’ in the ROSAT map (middle panel) and enhanced IR dust emission in the IRAS map (lower panel). The main Oph molecular cloud (L1688; Klose 1986) is the in the bright region in the upper-left part of the IRAS map. These data were used to estimate the column density in the cloud by comparing the column density estimates for the GRB position to those at locations ‘A’ and ‘B,’ chosen to be representative of nearby but off-cloud lines-of-sight.
The column densities were estimated in three independent ways, and the results are presented in Table 1. The first estimates comes from the Dickey & Lockman (1990) cm maps of . This shows little change in between the three positions (see Table 1), and this was confirmed by the cm map of the region shown by de Geus & Burton (1991; see their figure 5). The column density due to the intervening cloud in the direction of GRB 050724 was estimated from the difference between the column density towards the GRB and the mean of that measured for A and B. This gave cm-2 (where the uncertainty is a very rough estimate based on half the difference between A and B). In other words there is no excess H i in the direction of GRB 050724 due to the intervening dust cloud.
The second estimate comes from the IR reddening maps from Schlegel et al. (1998) This gave values, based on the COBE temperature and IRAS intensity at the position of interest, of , and for the GRB, A and B, respectively. These correspond to optical estinctions of , and , respectively, assuming as measured by Vrba, Coyne & Tapia (1993) in the direction of the Oph cloud. The reddening values were converted to hydrogen column densities assuming cm-2 (Diplas & Savage 1994). In this case the excess column density over the GRB was cm-2. However, as noted by Jura (1980), Vuong et al. (2003) and others, the dust-to-gas conversion factors in the direction of the Oph cloud are uncertain due to the complexity of modelling the cloud medium.
The third estimate was derived from RASS spectra extracted888 ROSAT count rates in different channels were extracted using the HEASARC “X-ray background tool” available via the following address: http://heasarc.gsfc.nasa.gov/ using radius regions centred on the positions of the GRB, A and B. These were fitted with the model developed by Willingale et al. (2003) but, due to the complexity of the model and low resolution of the data, most parameters were fixed at the values found from an analysis of nearby XMM-Newton fields (M. A. Supper, in prep.). The two parameters allowed to vary in the fit were the foreground absorption column density and the emission measure of the “Loop I super-bubble” (indicated by the large circle in the top panel of Figure 9). The excess column density towards GRB 050724 was estimated, by comparison with A and B, at cm-2. Given the systematic errors involved in modelling the complex X-ray spectrum, and converting from dust reddening factor to equivalent hydrogen column density, the X-ray and IR derived estimates are in reasonable agreement.
| Technique | Reference | [GRB] | [A] | [B] |
|---|---|---|---|---|
| ( cm-2) | ( cm-2) | ( cm-2) | ||
| cm | ||||
| IR map | ||||
| RASS |
REFERENCES: () Dickey & Lockman (1990), () Schlegel et al. (1998), () this work
6. Discussion
The X-ray halo around GRB 050724, as observed by the Swift XRT, has provided accurate information on the Galactic dust distribution in this direction. In particular, the narrow halo must be caused by a concentration of dust at a distance of pc from Earth, in a cloud or sheet with a thickness pc. The radial profile of the halo constrains the size of the largest grains to be m, but the contribution from smaller grains is unconstrained because the halo was not detected at scattering angles larger than . The estimated value of is higher than the often used value of m (MRN; see also Predahl & Schmitt 1995), although this is not without precedent as Jura (1980) previously noted that the non-standard optical extinction curves in the direction of Ophiuchus may signify the presence of unusually large grains.
The LoS to GRB 050724 includes the Upper Scorpius subgroup of the Scorpius-Centaurus OB association at a mean distance of pc (derived from HIPPARCOS data; de Zeeuw et al. 1999). There is considerable structure in the extinction maps around this region, including material belonging to the Ophiuchus molecular cloud complex (de Geus 1992). Knude & Høg (1998) detected a sharp rise in the reddening at pc in the direction of the Oph star forming region, which is consistent with the distance measured for the dust responsible for the X-ray halo. If the X-ray scattering dust is associated with part of the Oph molecular cloud complex, this gives the most accurate measurements to date for the distance to the cloud and its physical thickness.
The excess optical extinction in the direction of the GRB 050724, compared to the mean of the off-cloud positions ‘A’ and ‘B’, was mag (Section 5). In combination with the estimated halo scattering optical depth (Section 4.5) this gives at keV. This is lower than the value of estimated by Predehl & Schmitt (1995) using ROSAT observations of bright Galactic X-ray sources, and a factor of a few lower than the value derived from the model of Draine (2003). However, the halo around GRB 050724 was only observed at small angles () and so the flux contribution from smaller grains is largely unconstrained, meaning that the true halo flux, and hence , is probably larger.
As shown by Figure 9, the X-ray absorption and IR dust emission are well-correlated, demonstrating they are caused by the same medium. By contrast the cm map shows little correlation with these images (Figure 5 of de Geus & Burton 1991), suggesting the cloud medium has a comparatively low density of atomic H i. The most obvious explanation is that the hydrogen is molecular, although there is no obvious CO emission from this location in figure 3 of de Geus, Bronfman & Thaddeus (1990). The Ly- map of the region (see figure 13 of de Geus et al. 1990) shows two nearby H ii regions, known as S9 and RCW 129, around the stars Sco (B1 III) and Sco (B0 V), respectively. It is therefore also plausible that some fraction of the atomic hydrogen is ionised by these nearby young stars (with distances of pc; Shull & van Steenberg 1985). The total Galactic hydrogen column density along the LoS to GRB 050724 is therefore the sum of that revealed by the cm H i maps and that inferred from the molecular cloud (mostly H2 and/or H ii). The cm measurement of the total H i column density gave cm-2, whereas the column density in the dust cloud was measured at cm-2 from the excess IR emission and cm-2 from the excess soft X-ray absorption (Section 5). The total hydrogen column density is therefore in the range cm-2, slightly lower than that measured from the GRB X-ray spectrum ( cm-2; Section 3). It is of course possible that this extra X-ray absorption along the LoS to GRB 050724 ( cm-2) is caused by either a modest column of molecular or ionised gas on the far side of the Sco-Cen super-bubble, or due to cold gas in the GRB host galaxy, the formal constraint on which was cm-2 (Section 3).
Note added in proof: Since the completion of this paper Tiengo & Mereghetti (2005) have announced the detection of another dust-scattered X-ray halo around a GRB. This brings the total number of known GRB X-ray halos to three.
References
- (1) Alcock C., Hatchett S., 1978, ApJ, 222, 456
- (2) Arnaud K., 1996, in: Astronomical Data Analysis Software and Systems, Jacoby G., Barnes J., eds, ASP Conf. Series Vol. 101, p17
- (3) Barthelmy S. D., 2004 SPIE 5165, 175
- (4) Barthelmy S. D., et al. 2005, Nature, in press
- (5) Berger E., et al. , 2005, Nature, submitted (astro-ph/0508115)
- (6) Burrows D. N. et al. . 2004, SPIE, 5165, 201
- (7) Burrows D. N. et al. . 2005a, Sp. Sc. Rev., in press (astro-ph/0508071)
- (8) Burrows D. N., et al. 2005b, GCN 3697
- (9) Carrasco L., Strom S. E., Strom K. M., 1973, ApJ, 182, 95
- (10) Cash W., 1979, ApJ, 288, 939
- (11) Catura R. C., 1983, ApJ, 275, 645
- (12) Clark G. W., 2004, ApJ, 610, 956
- (13) Covino S. et al. 2005, GCN 3665
- (14) de Geus E. J., Burton W. B., 1991, A&A, 246, 559
- (15) de Geus E. J., 1992, A&A, 262, 258
- (16) de Zeeuw P. T., Hoogerwerf R., de Bruijne J. H. J., Brown A. G. A., Blaauw A., 1999; AJ, 117, 354
- (17) Dickey J.M., Lockman F.J. 1990, ARA&A, 28, 215
- (18) Diplas A., Savage B. D., 1994, ApJ, 427, 274
- (19) Draine B.T., 2003, ApJ, 598, 1026
- (20) Draine B.T., Bond N. A., 2004, ApJ, 617, 987
- (21) Gal-Yam A., et al. 2005, GCN 3681
- (22) Gehrels N., et al. 2004, ApJ 611, 1005.
- (23) Hayakawa S., 1970, Prog. Theor. Phys., 43, 1224
- (24) Hill J. E. et al. 2004, SPIE, 5165, 217
- (25) Jura M., 1980, ApJ, 235, 63
- (26) Klose S. 1986, ApSS, 128, 135
- (27) Klose S. 1994, A&A, 289, L1
- (28) Knude J., Høg E., 1998, A&A, 338, 897
- (29) Krimm H., et al. 2005, GCN 3667
- (30) Mauche, C.W., Gorenstein, P. 1986, ApJ, 302, 371 (MG86)
- (31) Mathis J. S., Rumpl W., Nordsieck K. H., 1977, ApJ, 217, 425 (MRN)
- (32) Miralda-Escudé 1999, ApJ, 512, 21
- (33) Moretti A., et al. 2004, SPIE, 5165, 232
- (34) Moretti A., et al. 2005, SPIE, in press
- (35) Overbeck J.W. 1965, ApJ, 141, 864
- (36) Predehl, P., Bräuniger, Burket, W., Schmitt, J.H.M.M. 1991, A&A, 246, L40
- (37) Predehl P., Schmitt J.H.M.M. 1995, A&A, 293, 889
- (38) Predehl P., Burwitz V., Paerels F., Trümper, J., 2000, A&A, 357, L25
- (39) Prochaska J. X., et al. 2005, GCN 3700
- (40) Rolf D.P. 1983, Nature, 302, 46
- (41) Romano P., et al. 2005, GCN 3685
- (42) Schlegel D. J., Finkbeiner D. P., Davis M., 1998, ApJ, 500, 525
- (43) Shull J. M., van Steenberg M. E., 1985, ApJ, 294, 599
- (44) Smith R. K., Dwek E., 1998, ApJ, 503, 831
- (45) Soderberg A. M., Cameron P. B., Frail D. A., 2005, GCN 3684
- (46) Tiengo A., Mereghetti S., 2005, A&A, in press (astro-ph/0511186)
- (47) Trümper J., Schönfelder V. 1973, A&A, 25 445
- (48) Tylenda R., 2004, A&A, 414, 223
- (49) Vaughan S. et al. 2004, ApJ, 603, L5
- (50) Vrba F., Coyne G., Tapia S., 1993, AJ, 105, 1010
- (51) Vuong M. H., Montmerle T., Grosso N., Feigelson E. D., Verstraete L., Ozawa H., 2003, A&A, 408, 581
- (52) Watson D., et al. 2005, ApJ, submitted
- (53) Willingale R., Hands A. D. P., Warwick R. S., Snowden S. L., Burrows D. N., MNRAS 343, 995, 2003
- (54) Wilms J., Allen A., McCray R., 2000, ApJ, 542, 914