Six Years of Chandra Observations of Supernova Remnants
Abstract
We present a review of the first six years of Chandra X-ray Observatory observations of supernova remnants. From the official ”first-light” observation of Cassiopeia A that revealed for the first time the compact remnant of the explosion, to the recent million-second spectrally-resolved observation that revealed new details of the stellar composition and dynamics of the original explosion, Chandra observations have provided new insights into the supernova phenomenon. We present an admittedly biased overview of six years of these observations, highlighting new discoveries made possible by Chandra’s unique capabilities.
1 Introduction
The Chandra X-ray Observatory was launched on July 23, 1999 using the Space Shuttle Columbia. Placement in its highly elliptical orbit was completed 15 days after launch. The orbit has a nominal apogee of 140,000 km and a nominal perigee of 10,000 km. With this orbit, the satellite is above the radiation belts for more than about 75% of the 63.5-hour orbital period and uninterrupted observations lasting more than 2 days are possible. The observing efficiency, which also depends on solar activity, is typically about 65%.
The spacecraft has been functioning superbly since launch. The specified design life of the mission was 5 years; however, the only perishable is gas for maneuvering and is sized to allow operation for much more than 10 years. The orbit will be stable for decades.
The heart of the Observatory is the X-ray telescope made of four concentric, precision-figured, superpolished Wolter-1 telescopes, similar to those used for both the Einstein and ROSAT observatories, but of much higher quality, larger diameter, and longer focal length.
The telescope’s on-axis point spread function, as measured during ground calibration, had a full-width at half-maximum less than 0.5 arcsec and a half-power diameter less than 1 arcsec. A relatively mild dependence on energy, resulting from diffractive scattering by surface microroughness, attests to the better than 3-angstroms-rms surface roughness measured with optical metrology during fabrication and confirmed by the ground X-ray testing. The on-orbit performance met expectations.
There are two focal plane cameras on the Observatory. The Pennsylvania State University (PSU, University Park, Pennsylvania) and the Massachusetts Institute of Technology (MIT, Cambridge, Massachusetts) designed and fabricated the Advanced CCD Imaging Spectrometer (ACIS) with CCDs produced by MIT’s Lincoln Laboratory. Made of a 2-by-2 array of front-illuminated (FI), 2.5-cm-square CCDs, ACIS-I provides high-resolution spectrometric imaging over a 17-arcmin-square field of view. ACIS-S, a 6-by-1 array of 4 FI CCDs and two back-illuminated (BI) CCDs mounted along the Chandra transmission grating dispersion direction, serves both as the primary read-out detector for the High Energy Transmission Grating (HETG), and, using the one BI CCD which can be placed at the aim point of the telescope, also provides high-resolution spectrometric imaging extending to lower energies but over a smaller (8-arcmin-square) field than ACIS-I.
The Smithsonian Astrophysical Observatory (SAO, Cambridge, Massachusetts), designed and fabricated the other focal plane camera the High Resolution Imager (HRC) (Murray et al. 2000). Made of a single 10-cm-square microchannel plate (MCP), the HRC-I provides high-resolution imaging over a 30-arcmin-square field of view. A second detector made of 3 rectangular MCP segments (3-cm 10-cm each) mounted end-to-end along the grating dispersion direction, the HRC-S, serves as the primary read-out detector for the Low Energy Transmission Grating (LETG).
More details as to the technical performance of the Observatory may be found in Weisskopf et al. (2003).
We note that the names of SNR are often given in papers using their galactic coordinates and a ”G” prefix. This prefix is, however, used by name resolvers such as Simbad for high proper motion stars appearing in the Giclas Catalog and it has been recommended 111see http://heasarc.gsfc.nasa.gov/docs/faq.html#nameresolvers that one use the SNR designation instead. We shall do so in this review.
Our review is representative of Chandra observations and is not intended to be exhaustive. Thus, if we have omitted a particular observation no slight to the work was intended. Finally, we emphasize that there are many excellent reviews and conference proceedings concerning the astrophysics associated with supernova remnants and, where relevant, the compact objects within them. These reviews and proceedings include: Becker and Pavlov (2001), Aschenbach (2002) Pavlov, Zavlin, and Sanwal (2002), Slane (2002), Canizares (2004), Decourchelle (2004), Slane (2005), and Rakowski (2005).
Our purpose here is to review the outstanding contributions that observations using Chandra have made to the discipline. We urge interested readers to include a careful reading of these reviews in addition to reading this paper.
2 The Point Sources in Supernova Remnants
An excellent introduction to the topic of compact central sources in supernova remnants may be found in Kaplan et al. (2004).
2.1 The Compact Central Objects
Although not originally discovered with Chandra, observations using the observatory have both clarified, and drawn further attention to, the existence of a group of compact objects associated with SNR that are radio quiet, unpulsed in X-rays, and have characteristic X-ray spectra described by a blackbody with characteristic temperatures of order 0.4 keV, without indication of a non-thermal component. The associated blackbody radii are smaller than the radii of canonical neutron stars. These objects have been aptly termed Compact Central Objects (CCOs) by Pavlov et al. (2002a). (Sources of this ilk have previously been referred to as “Radio Quiet Neutron Stars” by Caraveo, Bignami, & Trümper 1996.) Although several sources exhibit these properties, it is not clear that they form a class in the sense that there is an universally accepted explanation for their characteristics.
The prevailing, perhaps contradictory, interpretation is that the spectral properties of the CCOs are the result of hot spots on the surfaces of neutron stars formed during the supernova. The inability then to find any evidence for pulsations in the X-ray flux from the majority of these sources must be confronted. Many discussions leave one with the impression that new observations and more sensitive searches for pulsations will ultimately discover periodic behavior and thus validate the explanation. In general, detection of pulsations has not been forthcoming, and so perhaps deeper looks at other potential explanations might be in order. One possible explanation involves very long periods requiring some mechanism to carry off the angular momentum. One might also begin to question the interpretation of the spectral data. The tie between spectral fits and physical interpretations can be overdone. Thus, simply because a blackbody spectrum fits the data, this does not necessarily imply that the source is a blackbody emitter. Another spectrum, more representative of the true physical situation, may fit the data equally well. It is a challenge to the theorists to tell us just what this alternative spectrum might be.
2.1.1 Cas A
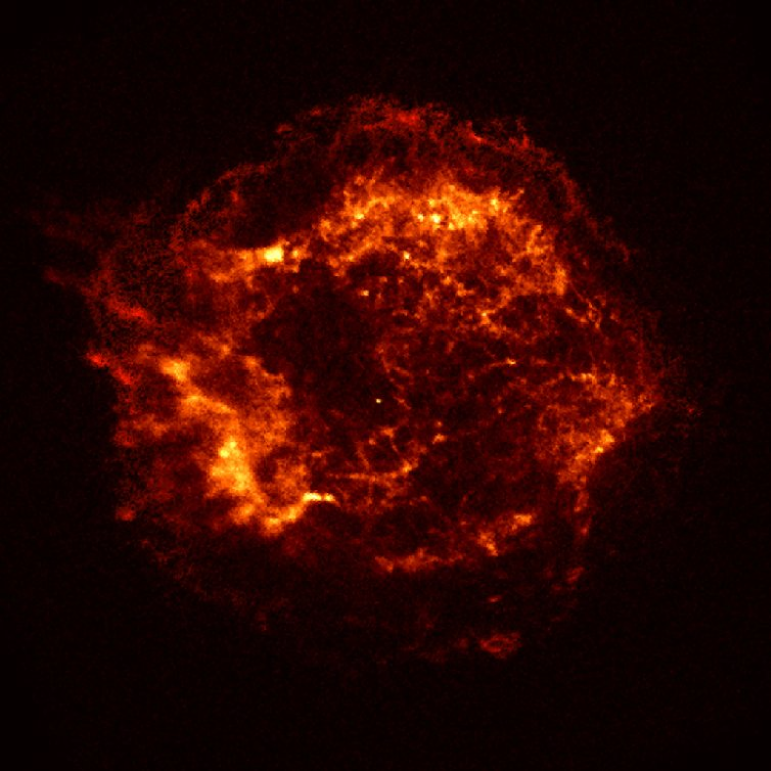
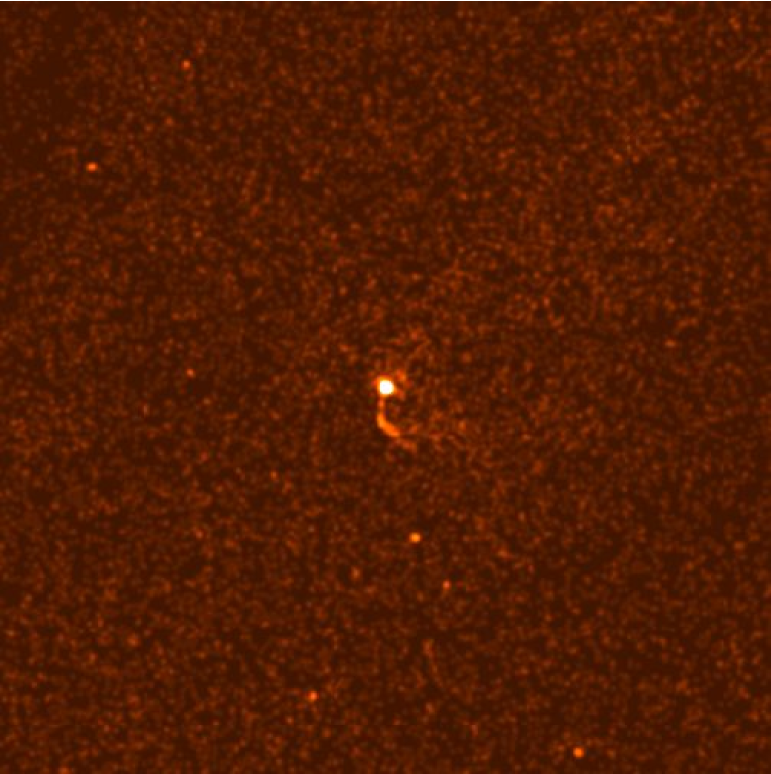
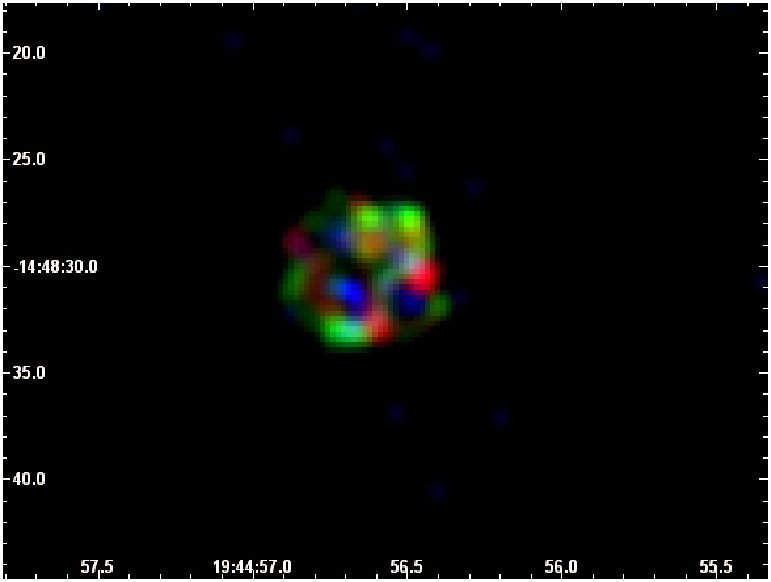
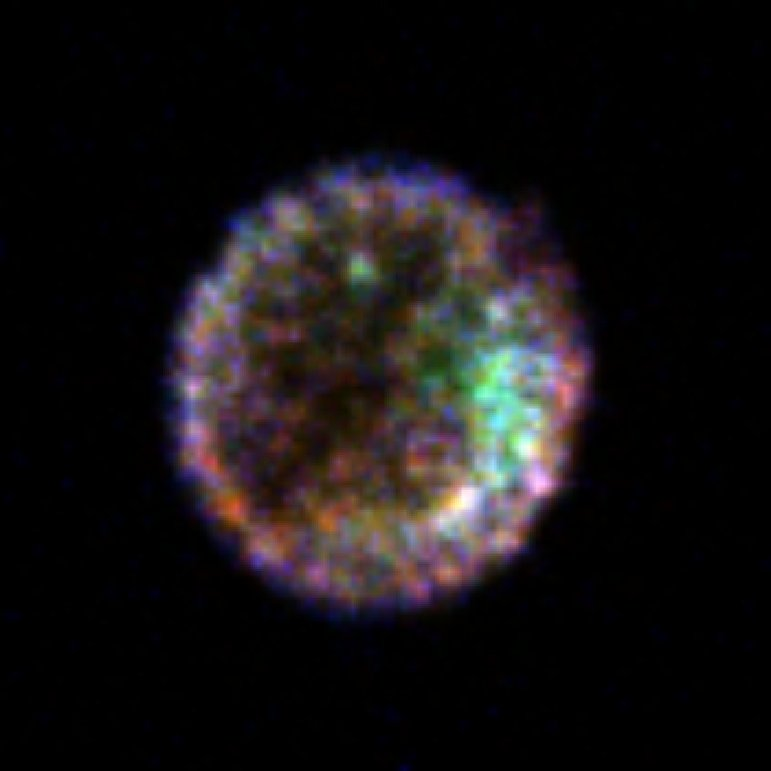
Cassiopeia A (Cas A) is often referred to as the “first light” observation made with Chandra. It is historically interesting that this is not quite accurate. The first X-rays that were observed with Chandra when the last door was opened took place on August 12-th, 1999 and led to the discovery of the z=0.32 AGN nicknamed “Leon X-1” (Weisskopf et al. 2005). The nickname honors the Chandra Telescope Scientist, Leon Van Speybroeck. The Observatory was next pointed at the radio-loud quasar PKS 0637752 (Schwartz et al. 2000) chosen as the target for which on-orbit optimization of the imaging properties of the Observatory were performed. After bore-sighting and focusing the telescope, only then was the official “first-light” image of Cas A obtained. One of the principal features of the first Cas A image, shown in Figure 1, was the clear presence of a point source (Tananbaum 1999) near the center of the remnant and apparent after only a few minutes of observing.
Pavlov et al. (2000) argued, convincingly, that the source was the compact object associated with the remnant. Pavlov et al. (2000) also established the nature of the spectral parameters, noting that no unique spectral fits were forthcoming from the data in hand at the time. Fits to a power law yielded high photon indices (of order 3 to 4) whereas fits to a blackbody led to temperatures of about 0.5 keV. As noted above, these authors coined the very apt description for this source — Compact Central Object (CCO) — and favored the interpretation that the CCO is a neutron star whose X-ray emission is primarily from a restricted region of the surface.
Subsequently, Chakrabarty et al. (2001) provided additional analyses of both spectral and timing data, setting a 3- upper limit to the pulsed fraction of less than 35% for periods longer than 20-ms. Additional period searches were performed by Murray et al. (2002a) utilizing HRC-S data in order to extend the period searches to shorter periods. Using a 50 ksec observation they also failed to detect any significant evidence for pulsations. More recently, and discussed in detail in [§ 4.1.2] a s ACIS-S3 observation has been performed. To our knowledge, no pulsations have thus far been detected in these data, although the search would be limited to periods longer than several seconds due to the time resolution in this mode.
2.1.2 SNR 266.21.2 (RX J09852.04622)
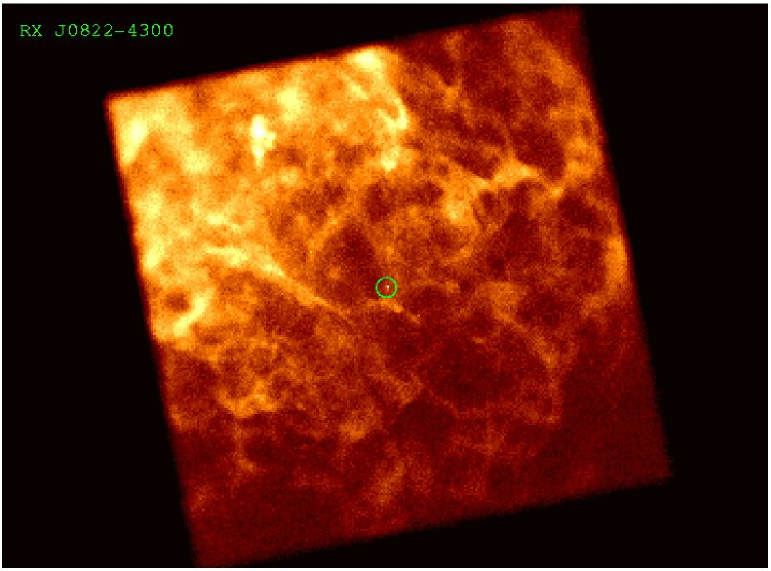
The SNR 266.21.2 (aka RX J09852.04622 and sometimes referred to as “Vela Junior”) was discovered with ROSAT by Aschenbach (1998). Prior to observations with Chandra, a number of X-ray observations had been performed with at least two, if not more, possible X-ray point sources being associated with this remnant – see the introduction to, and references in, Pavlov et al. (2001). Pavlov et al. (2001) used Chandra and the ACIS imaging array to pinpoint the location of a bright X-ray source (CXOU J085201.4461753) 4′ north of the SNR center. This was the only bright X-ray source they found near the center of the remnant. Using the Chandra-based position to refine and guide a search for optical counterparts, they found none and established stringent upper limits to the optical flux in both B and R. These authors then used the corresponding lower limit to the X-ray to optical flux ratio to argue that the source is the compact remnant of the SN. The quality of the X-ray spectra determined from this particular observation was limited by the short observing time (3 ksec) and by pulse pileup due to the brightness of the source coupled with the readout time (frame time) of the CCDs.
To refine the spectral parameters, and to provide moderately high time resolution data useful for searching for pulsations, the source was again observed with Chandra by Kargaltsev et al. (2002) using ACIS-I in the continuous-clocking mode. This mode provides only one-dimensional images but yields higher time resolution (2.85 ms in this case) especially useful for mitigating pulse pileup. This observation was also ten times longer than the previous Chandra observation. Spectral fits to a power law were found to be statistically unacceptable, whereas a blackbody model, with a temperature of 0.4 keV, provided a statistically acceptable fit. As with Cas A and the other CCOs, the radius of the emitting sphere was found to be much smaller than a canonical neutron star radius.
Kargaltsev et al. (2002) also attempted to constrain the temperature of the entire (putative) neutron star surface by fitting the spectral data with a two-component blackbody model where one of the two components was constrained to a radius of 10 km. They found an upper limit to the surface temperature (at infinity) of 89 eV (99% confidence) which would imply accelerated cooling compared to standard neutron star cooling models assuming an age of a few thousand years. (Inferring accelerated cooling is not exceptional, see, e.g. the discussion of 3C58 in § 2.3.3.) Kargaltsev et al. (2002) also searched for narrow spectral features and discussed the hint of a feature at 1.68 keV. It would be interesting to follow up on the possible spectral feature with XMM-Newton to see if this is similar to the feature(s) discovered using Chandra in 1E 1207.45209 (§ 2.3.1). A search for pulsations found no statistically significant periods with pulsed fractions in excess of 13% in the frequency range from 0.001 to 100 Hz.
We urge other observers to follow the example set by Kargaltsev et al. (2002) in their data analysis. In particular, use the data to establish an upper limit to a possible full-surface blackbody in order to constrain a neutron star temperature, and search for possible spectral features that appear as residuals to the continuum models. The results of these analyses are very useful in addressing some of the potentially interesting astrophysical questions concerning compact objects and in particular the CCOs.
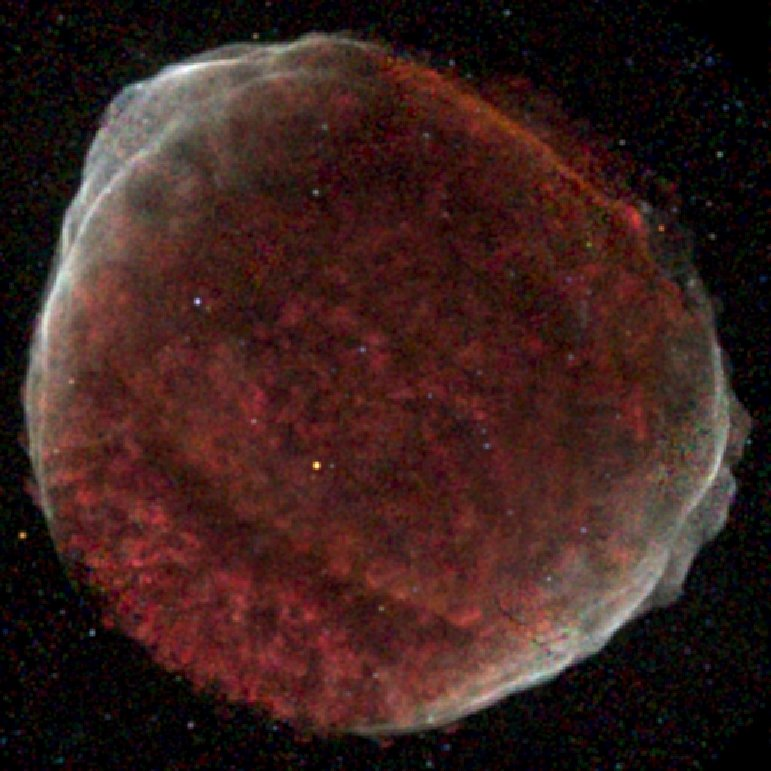
2.1.3 Puppis A
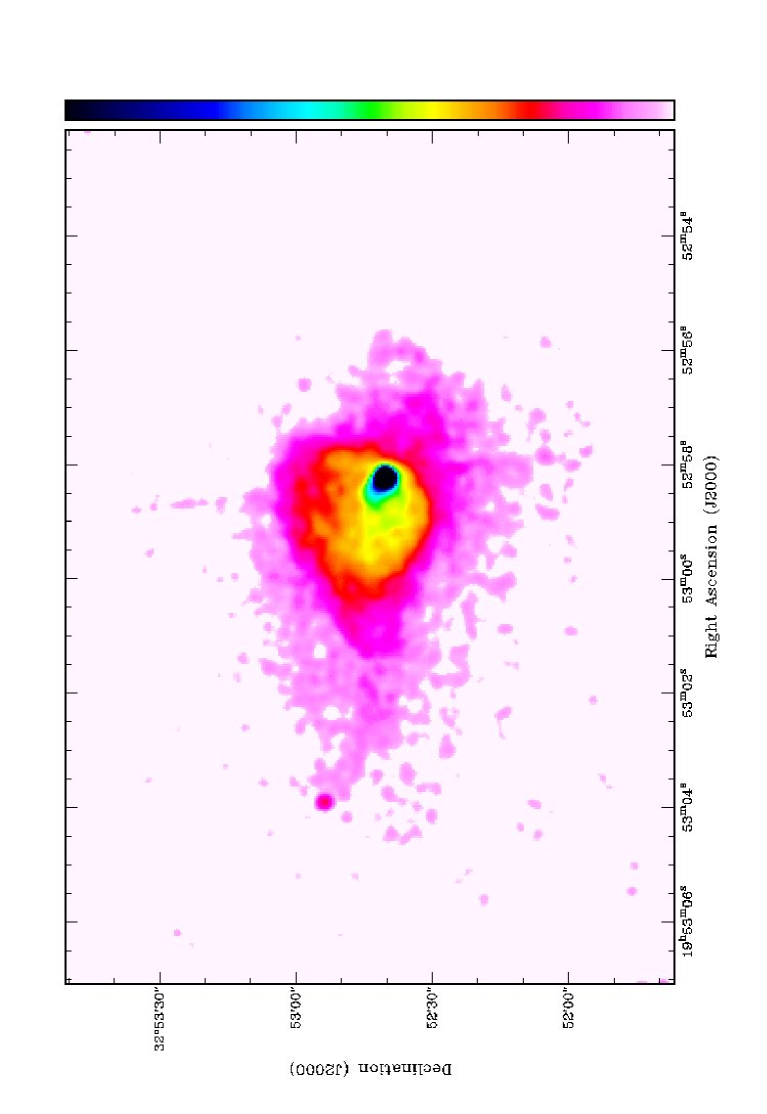
The bright point source at about 6′ from the dynamical center of Puppis A was discovered by Petre et al. (1982) using the Einstein Observatory. The object has been studied with numerous X-ray satellites and in other wavelength bands (see e.g. the introduction to Hui and Becker (2005) and references therein). The early Chandra ACIS observation discussed by Pavlov et al. (2002a) found a spectrum both consistent with previous X-ray observations and the CCO classification — namely that the data were described by a blackbody with an associated radius much less than that of a neutron star. In this case, spectral fitting with a neutron star hydrogen atmosphere yielded a radius more like that of a neutron star. The ACIS observations were followed by observations with the HRC designed to search both for pulsations and a pulsar wind nebula (PWN). The HRC image is shown in Figure 2 and clearly there is no obvious evidence for a PWN, however Pavlov et al. (2002a) gave no quantitative upper limits. Note that Gaensler, Bock and Stappers (2000) did provide quantitative upper limits as to the presence of a radio PWN (on scales greater than about 30” x 30 ” up to about 30’). Pavlov et al. (2002a) used the HRC-data to search for pulsations and found no evidence for pulsations for pulses with a pulsed fraction of greater than 10% in the period range from 0.003 to 300 seconds. Pavlov et al. (2002a) do not state the confidence level to be associated with this upper limit.
2.1.4 RCW 103 (SNR 332.40.4)
The source 1E 1613485055 was discovered using the Einstein Observatory by Tuohy and Garmire (1980) and is associated with the SNR RCW 103 (aka SNR 332.40.4). The central point source was considered to be the prototype of a cooling neutron star (Becker and Aschenbach 2002) prior to observations with Chandra. Interestingly, the RCW 103 source was also the first radio-quiet X-ray source found in a young SNR and, as such, may be considered to be the first detected CCO. The source’s detailed characteristics (see below) are, however, somewhat different from the majority of CCOs such as Cas A and, as has also been noted by others (e.g. Pavlov, Zavlin, and Sanwal 2002), it is not clear that all CCOs form a single class of objects.
Garmire et al. (2000) using Chandra reported a precise position and strong evidence for the detection of a significant portion of a potentially periodic light curve corresponding to a -hr period based on the 5.5-hr Chandra observation. These same authors reported finding a similar period in archival ASCA data, and speculated as to the possibility that a binary period had been detected. We note that accretion was also listed as one of many possible explanations for the long term variability observed prior to the Chandra observations (see e.g., Gotthelf, Petre, and Vasisht 1999).
Binarity may not be the only explanation for the periodicity. Heyl and Hernquist (2002) presented the case for a freely-precessing, short-period neutron star with hot spots as the possible explanation for the light curve. Their model predicted that the spin period should be detectable at minimum flux, but, to date, no detection has been reported. Subsequently Becker and Aschenbach (2002) reported the results of a 5.5-hr XMM-Newton observation which showed what appears to be clear evidence for an eclipse. If verified, this would the first clear case of an accreting binary in a SNR. Further observations of this interesting system are clearly called for.
Hui and Becker (2005) analyzed these Chandra data together with the data from XMM-Newton, fitting the data to two blackbodies and reporting on a “promising candidate”, albeit statistically weak, pulse period.
2.1.5 SNR 347.30.5
Prior to observations of SNR 347.30.5 with Chandra, an X-ray point source (1WGA J1713.43949) with no nearby optical counterpart (Slane et al. 1999) had been discovered with ROSAT by Pfeffermann and Aschenbach (1996). More interestingly, a radio source (PSR J17133945; Crawford et al. 2002) with a pulse period of 392 ms was also detected in the region. Chandra observations (Lazendic et al. 2003) played a key role as they were used to establish that the X-ray source was not at the same location as the radio pulsar.
Lazendic et al. (2003) found that the central X-ray source shares several characteristics with the CCO in Cas A, including an X-ray spectrum whose principal component is a blackbody with a temperature of about 0.4 keV and the absence of pulsations over the frequency ranges searched (0.01 – 128 Hz) with upper limits to the pulsed fraction of better than 25%.
2.2 Pulsars with Pulsar Wind Nebulae (PWNe)
Chandra has served more than ably in many cases as a tool to isolate and resolve the various spatial components that comprise the structure of pulsar-wind nebulae. We begin our discussion of the Chandra contributions to this particular type of study with the remarkable images that have revealed more observational detail of the complex interaction between the central pulsar and the surrounding medium than ever before. All of the Chandra PWN images appear to be consistent with a similar structure — one that is approximately axially symmetric and elongated along the symmetry or jet axis. The most common explanation identifies the jets with collimated outflows of relativistic particles along the rotation axis of the underlying pulsar. The ubiquitous presence of jets in astrophysical contexts including these associated with young pulsars and those found with active galactic nuclei is always worth comment and provides an over-riding motivation for gathering detailed information to help one learn about jet formation mechanisms. Observations with Chandra have provided not only spectacular images but also valuable and unique insights. One of the most important of these insights is the dynamic nature of the phenomena that take place in the PWN. This is particularly well illustrated in the case of the observations of the Vela pulsar (§ 2.2.2) described by Pavlov et al. (2003) that discovered the variability of the northeast outer jet.
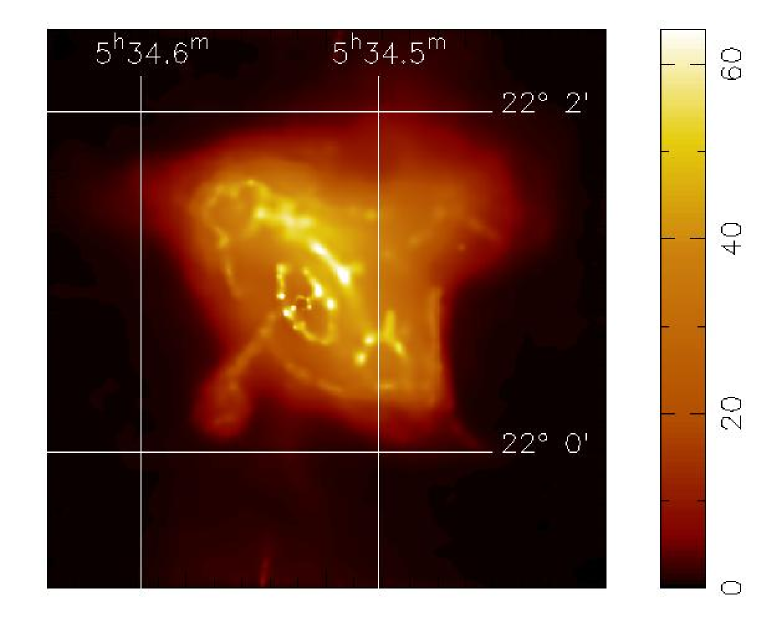
2.2.1 The Pulsar in the Crab Nebula
The Chandra X-Ray Observatory first observed the Crab Nebula and its pulsar during orbital calibration in 1999. Weisskopf et al. (2000) published the zeroth-order image obtained with the HETG and read out by ACIS-S that showed a striking richness of X-ray spatial structures. Figure 3 shows the original HETG–ACIS-S zeroth-order image. A number of features were observed for the first time: an X-ray inner ring within the X-ray torus; the suggestion of a hollow-tube structure for the torus; X-ray knots along the inner ring and (perhaps) along the inward extension of the X-ray jet. The Chandra image also clearly resolved the X-ray torus (Aschenbach and Brinkmann 1975) and jet and counterjet which are all features that had been previously observed (Brinkmann, Aschenbach, & Langmeier 1985; Hester et al. 1995; Greiveldinger & Aschenbach 1999) but never with such clarity. On somewhat larger scales, the image showed a sharply bounded notch (WSW of the Pulsar) into the X-ray nebular emission, earlier associated with the “west bay” of the Nebula (Hester et al. 1995). Visible-light polarization maps of the Crab Nebula (Schmidt, Angel, & Beaver 1979; Hickson & van den Bergh 1990) demonstrate that the magnetic field is parallel to the boundary of this notch, thus serving to exclude the X-ray-emitting relativistic electrons from the west bay.
The most striking feature of the X-ray image, of course, is the inner elliptical ring, lying between the pulsar and the torus. The existence of such a ring had been predicted, and corresponds to a shock in the pulsar wind (Rees and Gunn 1974; Kennel and Coroniti 1984). On the ring reside a few compact knots, and one can be seen in Figure 3 lying SE of the pulsar along the projected inward extension of the jet. The surface brightness of this knot is too high to be simply explained as the superposition of the ring’s and jet’s surface brightnesses. Ultimately the nature of these knots needs to be probed by means of high-resolution spectroscopy.
Subsequently, Tennant et al. (2001) observed the Crab Nebula and its pulsar with Chandra using the Low Energy Transmission Grating Spectrometer (LETGS). Time-resolved zeroth-order images were used to perform a most sensitive search for X-ray emission from the pulser as a function of pulse phase, including pulse phases that had been traditionally referred to as “unpulsed”. It has been common practice to denote any minimum in a pulse profile to be representative of the unpulsed flux; subtract these data from the remainder and then purport that the difference, represents the “pulsed” component. Of course this need not be the case. One can see from the Chandra image, for example, that such an approach may include the flux from the inner ring if not the entire PWN as a whole, depending on the angular resolution of the instrument. It is far more satisfactory to use high-resolution spatial imaging as is possible with Chandra to isolate the pulsar from any background that may be present.
Using this approach, Tennant et al. (2001) discovered that, as in the visible (Golden, Shearer, & Beskin 2000; Peterson et al. 1978), the pulsar emits X-rays at all pulse phases. They confirmed prior observations (Pravdo, Angellini, & Harding 1997; Massaro et al. 2000) that showed that the power law spectral index varied with pulse phase and extended the measurements into the pulse minima. Finally, and, assuming that all of the flux from the pulsar at pulse minimum is attributable to thermal emission, the authors used these data to set a new upper limit to the blackbody temperature. As a representative case, they took — for (e.g., and ) at — and . With these parameters, the blackbody temperature that would account for all the flux observed at the pulse minimum was , which bounds the actual temperature (). Subsequent Chandra-LETG observations and analyses of the spectrum as a function of pulse phase (Weisskopf et al. 2004) slightly improved this upper limit to MK.222These upper limits appear weaker than previous ROSAT-established upper limits set by Becker and Aschenbach (1995). The ROSAT limits were, however, “optimistic” as discussed in Tennant et al. (2001).
Weisskopf et al. (2004) also performed a detailed analysis of the pulse-averaged spectrum. They were able to study the interstellar X-ray extinction due primarily to photoelectric absorption and secondarily to scattering by dust grains in the direction of the Crab Nebula. They confirmed the findings of Willingale et al. (2001) that the line-of-sight to the Crab is under abundant in oxygen. Using the abundances and cross sections from Wilms, Allen and McCray (2000) they found [O/H] = (). Spectral studies such as this, where the abundances are allowed to vary, are important as it is unlikely that standard abundances apply equally well to all lines of sight, especially those that intersect large quantities of SN debris (for more on this point see the discussion in Serafimovich et al. 2004 and our comments in § 2.2.8).
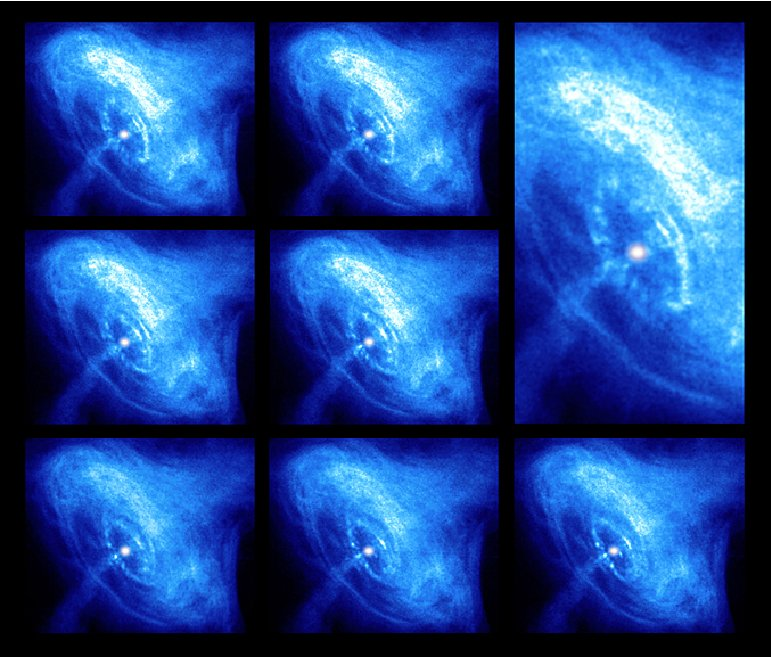
In 2002, Hester et al. (2002) completed one phase of a set of coordinated observations of the Crab’s PWN using Chandra (ACIS-S in sub-array mode) and the Hubble Space telescope. These spectacular observations revealed numerous dynamical features including wisps moving outward from the inner equatorial X-ray ring at about 0.5 c. The eight Chandra observations are shown in Figure 4.
Finally, Chandra (and XMM-Newton, see Willingale et al. 2001) has been used to study spectral variations as a function of position in the nebula. Weisskopf et al. (2000) first presented the variation of a hardness ratio (the ratio of flux in two energy bands) as a function of position as seen with Chandra using 5” x 5” pixels. Mori et al. (2004) followed this work with studies of the variation of the power law spectral index as a function of position using 2.5” x 2.5” pixels and the same data discussed in Hester et al. (2002). Despite the particular mode (subframe) used to obtain these data, the effects of pulse pileup plagued the data analysis and required the application of corrections. These corrections, at best, did not adequately correct for pileup when bright spatial structure was present within an analysis pixel — dealing with that particular situation was noted by the authors to be beyond the scope of the paper. One hopes this problem will be be addressed by some enterprising expert in pulse pileup in the future, since it is at the smallest spatial scales that the Chandra observations are most unique. Performing spectroscopy (perhaps even time-resolved spectroscopy) of the bright, compact features is necessary in order to understand their origin.
2.2.2 The Vela Pulsar and its remarkable external jet
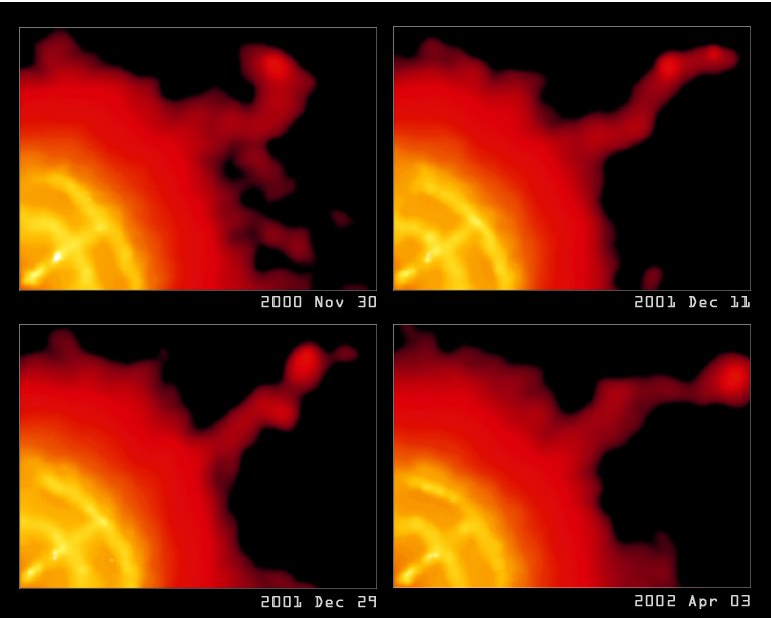
Chandra observations of the 89-ms period Vela pulsar (Helfand, Gotthelf, & Halpern 2001; Pavlov et al. 2003) and its surroundings have been most revealing. In addition to showing the complex and time variable spatial structure of the region immediately surrounding the pulsar itself — a structure that includes two sets of arcs, a jet in the direction of the pulsar’s proper motion and a counterjet — the Chandra images taken by Pavlov et al. (2003) also discovered that the continuation of the jet that extends to the NW is time variable in both intensity and position on scales of days to weeks as illustrated in Figure 5. The brightness variations are different along the extent of the jet, and Pavlov et al. (2003) inferred flow velocities of 0.3–0.7c. Finally, the apparent width of the outer jet appears to be constant, despite large variations in appearance, indicating confinement. The analogy to a fire hose being held at its base appears very appropriate.
The Chandra Observatory should be used to both to search for, and to study, such behavior in all cases where it is clear that jets from neutron stars are present.
2.2.3 PSR150958
The Chandra image of the young PWN powered by B150958 in SNR 230.41.2 (Gaensler et al. 2002) is shown in Figure 6. The pulsar is the bright source at the center of the nebula. A thin jet can be seen in the image to extend to the southeast. Just above the pulsar there is a small arc of X-ray emission, which seems to mark the location of the shock wave produced by the particles flowing away from the pulsar’s equator. The cloud near the top of the image may to be due to high temperature gas. This gas, possibly a remnant of the explosion associated with the creation of the pulsar, may have been heated by collisions with high-energy particles produced by the pulsar. See Yatsu et al. (2005) for a discussion of the interaction of the pulsar’s jet with this material.
2.2.4 SNR 292.20.5
SNR 292.20.5 contains the 407-ms radio pulsar J11196127 whose discovery (Camilo et al. 2000) led to the radio detection of the SNR by Crawford et al. (2001). The first of two Chandra observations with ACIS-S3 (Gonzalez and Safi-Harb 2003, 2005) provided unambiguous detection of the X-ray counterpart to the radio pulsar and strong evidence for the detection of a faint PWN. Gonzalez and Safi-Harb (2003, 2005) found that the combined X-ray emission from the pulsar and its associated nebula is described by an absorbed power law model with a photon index 2.2 (+0.6, 0.3) and an unabsorbed X-ray luminosity (0.5–10.0 keV) of - ergs s-1 assuming a 6 kpc distance. An interesting attribute is the source’s derived inefficiency in converting rotational energy into X-rays using the standard assumptions. Deeper observations are need to better establish the detailed attributes of the PWN, such as spectral variations as a function of position.
2.2.5 SNR 54.1+0.3
Lu et al. (2002) observed SNR 54.1+0.3 using ACIS-S3. The Chandra image is shown in Figure 7 and one sees a central bright pointlike source, a surrounding ring, jet-like elongations, and low surface brightness diffuse emission. All of these features emphasize the similarity to the Crab’s PWN. Lu et al. (2002) determined that the spectra of these components are all well described by power-law models (as with the Crab PWN); the spectral index steepens (softens) with increasing distance from the point source. The similarity of SNR 54.1+0.3 to the Crab nebula and its pulsar was further strengthened by the subsequent discovery (Camilo et al. 2002a) of a 136-ms radio pulsar at the location of the Chandra source. (These authors then also detected the pulsations in archival X-ray observations performed with the ASCA satellite.) The radio pulsar, PSR J1930+1852, is very weak with a period-averaged flux density at 1180 MHz of 60 -Jy. For a distance of 5 kpc, the corresponding luminosity is among the lowest for known young pulsars.
2.2.6 SNR 39.20.3 (3C 396)
Olbert et al. (2003) observed SNR 39.20.3 (3C 396) using ACIS-S3. The Chandra image (Figure 8) resolved an extended () X-ray nebula with a nonthermal energy spectrum ( at 90%-confidence) and detected what the authors refer to as a “pointlike” source at the center of the nebulosity. There is also diffuse radio emission in the same region. This discovery provided convincing evidence for the presence of a PWN, surely harboring an X-ray pulsar with a to-be-detected pulse period. The Chandra observations confirmed the conclusions as to the nature of this source — the existence of both thermal and non-thermal components and the possible presence of a rotating NS powering a synchrotron nebula — reached by Harrus and Slane (1999) based on observations with ASCA. The pulse period, if observable in our line of sight, is yet to be detected and Olbert et al. (2003) do not appear to have set upper limits over the admittedly long periods accessible using ACIS in its normal mode. A recent search (Zavlin 2005) of these data and covering the period range from 10 to 104 s uncovered no evidence for pulsations for pulses with a sinusoidal amplitude of greater than 34% (95%-confidence).
2.2.7 SNR 293.8+0.6
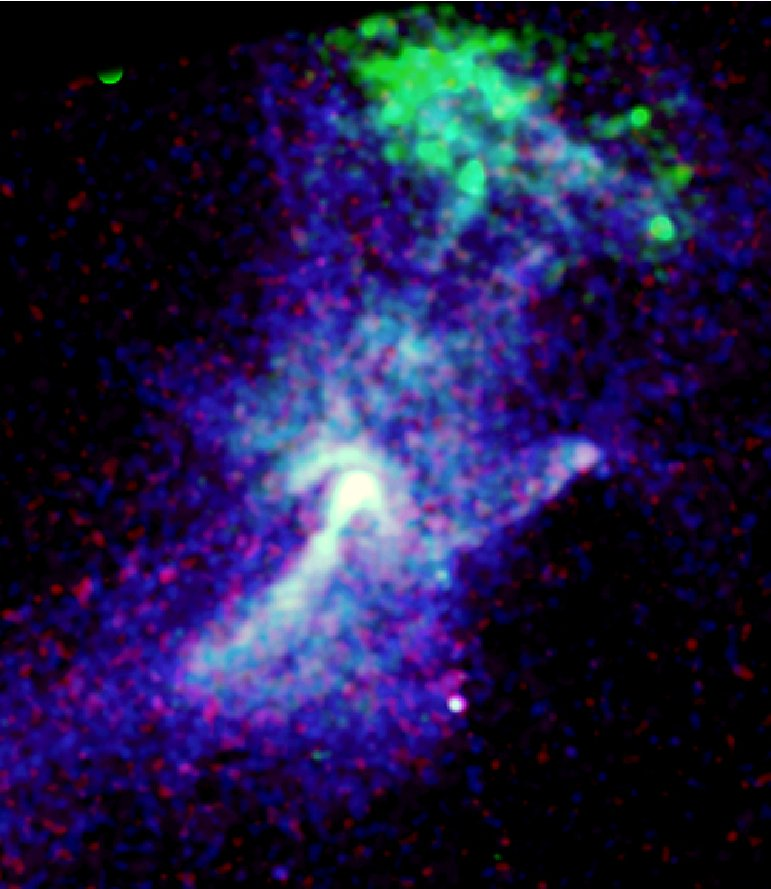
SNR 293.8+0.6 was observed with Chandra ACIS-S3 for 40 ksec by Olbert, Keohane, and Gotthelf (2003). There is no published reference to this observation other than the abstract referred to here. The abstract mentions the presence of a “soft” point source near the center of the remnant and the absence of a bright synchrotron nebula. The authors note that these results seem to be in contrast to the presence of a PWN that one might expect from the radio image. A quick glance at the Chandra and radio images together (shown in Figure 9) however, shows numerous X-ray sources in the region containing the SNR, any of which might be candidates for an associated compact object. The X-ray image in Figure 9 is rich in structure and clearly more work needs to be done before one adds SNR 293.8+0.6 to the list of SNR with established and identified compact objects.
2.2.8 N158A (SNR B054069 in the LMC)
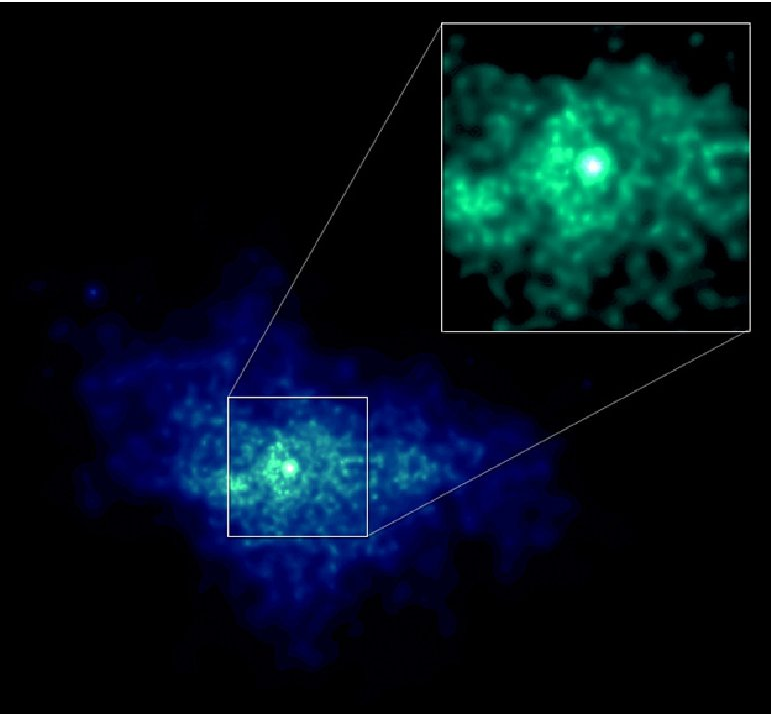
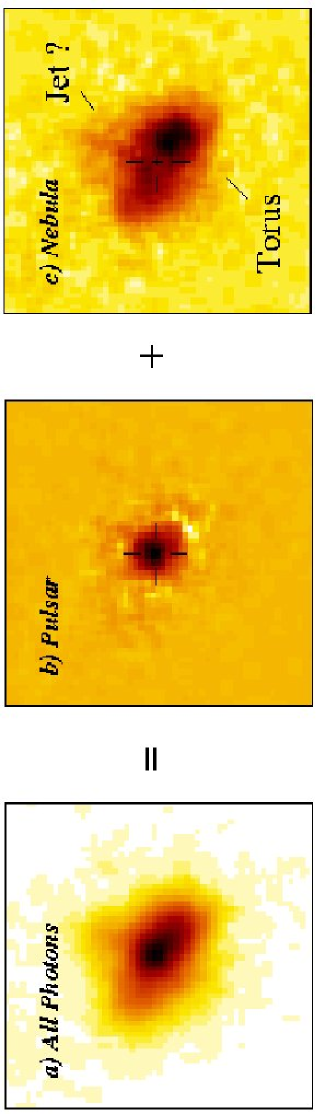
The 50-ms pulsar PSR B054069 is very “Crab-like” possessing a similar pulse period, spin-down age, and spin-down power. The pulsar was discovered by Seward, Harnden, and Helfand (1984) using the Einstein Observatory. A Chandra HRC observation, performed by Gotthelf and Wang (2000), was motivated by a desire to search for an X-ray plerion, expected based on the similarity to the Crab and previous observations in the optical, and radio (see e.g. the introduction in Gotthelf and Wang (2000) and references therein). Using the HRC allowed for precision timing and subsequent detection of the pulsed emission from the central, barely-resolved, extended emission. Defining the data at pulse minimum, which lasted about 0.5 in pulse phase, as “off-pulse” these authors separated the central image into that of the “pulsed” component and that for the “off-pulse” component. The former appeared point-like whereas the latter appeared extended as shown in Figure 10 revealing the presence of a PWN and even possibly a jet.
Kaaret et al. (2001), in addition to reanalyzing the HRC data and applying an improved aspect solution and improved HRC processing to remove spatial artifacts, also performed ACIS-I measurements in continuous clocking mode. As noted previously, this mode allows for higher time resolution albeit at the price of one spatial dimension in the image. Thus, the data available for spectral analysis had to contend with a significant contribution, not so much from the PWN but from the larger SNR. The spectrum of the pulsed component was found to be consistent with a power law with a photon index of 1.83 () fixing NH at cm-2. Spectral analyses of the nebula by Kaaret et al. (2001), again fixing NH, showed it to be softer than the pulsar with spectral indices varying from 1.85 to 2.26 although it is not totally clear that the variations are that statistically significant. The variation is in contrast to the lack of a spectral variation over the PWN measured in the visible (Serafimovich et al. 2004).
Serafimovich et al. (2004) also made important contributions to the study of this system analyzing both new (VLT) and archival (HST) observations. Moreover, these authors raised the important point, which to our knowledge has been neglected when analyzing spectra (except in the case of the Crab pulsar — as discussed in § 2.2.1) that the use of standard abundances may not be (is not) justified, perhaps even more so for an extragalactic source. Of general interest (although not necessarily directly applicable to B054069 as they noted) is their discussion of the potential impact of the absorption produced by the SN ejecta on the X-ray spectrum which can enhance the X-ray absorption at energies above the oxygen K-edge depending on the state of evolution of the SNR — the less evolved, the more possible that there is a significant contribution to the absorption from the ejecta. We strongly urge readers interested in understanding the spectra of X-ray sources in SNR to carefully examine the discussion in § 2.7.1 of Serafimovich et al. (2004).
Serafimovich et al. (2004) did note that the pulsar could well have a non-power-law (thermal?) spectrum at energies below 1 to 2 keV, although this conclusion must be tempered by the knowledge that the understanding of the ACIS response function decreases with decreasing energy. Serafimovich et al. (2004) concluded that a reanalysis of the X-ray spectrum of B054069 is called for, but noted that this was beyond the scope of their paper. The reanalysis should be done, and similar considerations such as allowing for absorbing effects of ejecta, allowing abundances to vary, etc. need to be applied in a systematic way to all spectral analyses performed in the Chandra era where not prevented by poor statistics. Indeed, it might be argued that spectral observations should not be performed unless there are sufficient statistics to pursue such studies — simply being able to differentiate between a power law and say a blackbody spectrum, all else being equal, may no longer be sufficient justification for establishing the length of such observations.
2.2.9 N157B (NGC 2060; SNR 0538691)
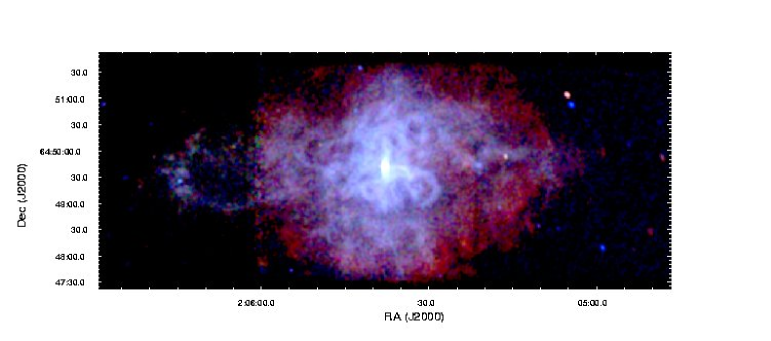
The supernova remnant N157B (aka NGC 2060, SNR 053869.1, and 20 Doradus B) contains the RXTE-discovered (Marshall et al. 1998) 16-ms-period X-ray pulsar, PSR J05376910 and is located in the LMC. Chandra observations using the HRC-I and HRC-S by Wang et al. (2001) served a number of purposes including obtaining a precise location for the pulsar. In addition they were able to spatially resolve the pulsar, a surrounding compact yet elongated ( pc) nebula, and an even larger-scale feature of diffuse emission trailing from the pulsar and oriented nearly perpendicular to the major axis of the nebula. These features, shown in Figure 11, indicate interesting interactions between the pulsar-powered nebula as it is moving through the surrounding medium. A subsequent ACIS-S observation (ObsID 2783) seems never to have been formally analyzed.
2.2.10 B0453685
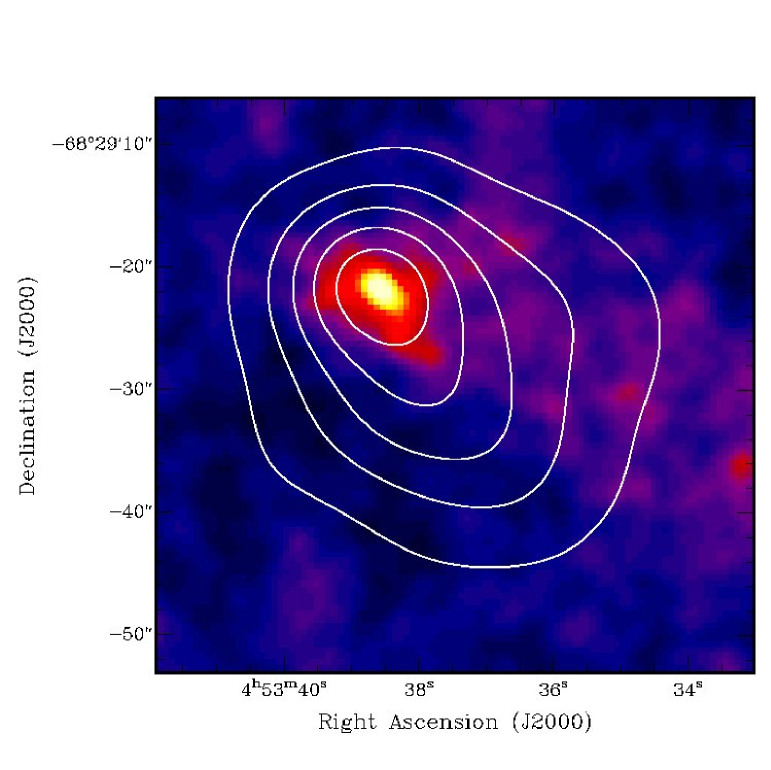
Gaensler et al. (2003) performed both radio and Chandra observations of the supernova remnant B0453685 in the Large Magellanic Cloud (LMC) and discovered a new PWN. Gaensler et al. (2003) detected a strongly linearly polarized (8% and 6% at 2.4 GHz and 1.4 GHz respectively) and elongated () central radio core, similar in morphology to the X-ray core () seen as part of a 40 ksec ACIS-S3 observation (Figure 12). They also found that the X-ray spectrum of the central core is fit by a power-law with number index of . Unfortunately no mention is made as to the quality of the fit. This is important as the statistical uncertainties (measured by extremes on the contours) get underestimated if the fit is poor. Based on the quoted uncertainties and the limited number of counts, we suspect that the fit to the power-law spectrum may not have been compelling in comparison to other models for the continuum. However, the radio and X-ray images, and their similarity leave little doubt that a PWN has been detected. The search for the underlying pulsar proved unrewarding, albeit not surprisingly so, as these authors found a scant 58-count upper limit to the contribution of a putative point source to the central image. The authors noted that the corresponding limits to the X-ray luminosity (0.5–10.0 keV) of ergs s-1 (assuming cm-2 and a power law index ) were hardly restrictive. It is worth emphasizing that Gaensler et al. (2003) propose an interesting approach to determining the properties of the system in contrast to the usual one where the equations for a pulsar’s age, spin-down luminosity, and surface magnetic field are written down in the dipole approximation and one assumes a braking index of 3, an initial period of 0, and a luminosity that is a carefully selected fraction of the spin-down luminosity in order to determine the pulse period, period derivative, and the neutron star’s surface magnetic field. We won’t repeat their discussion here, but refer interested readers to § 3.1 of their paper.
Deeper observations of this system, which would allow one to perform spatially resolved spectroscopy in addition to facilitating sensitive searches for pulsations, are clearly called for.
2.2.11 CTA 1 (SNR 119.5+10.2)
CTA 1 (aka SNR 119.5+10.2) is a radio shell SNR with emission from the center that appeared harder and brighter than the emission from the limb as seen with ROSAT (Seward, Schmidt, & Slane 1995). Of special interest is the fact that the position of 3EG J0010+7309, one of the brighter of the EGRET unidentified sources (Hartman et al. 1999), lies inside the boundary of CTA 1.
Halpern et al. (2004) used Chandra ACIS-S3 to image the central portion of the remnant. The Chandra image (Figure 13) reveals a point source, a compact nebula, and a (curved) “jet”. These characteristics, together with upper limits to the optical flux at the Chandra location of the point source which gives an X-ray-to-optical flux ratio in excess of 100, clearly establish the central object as as a rotation-powered pulsar, albeit pulsations are yet to be detected.
Slane et al. (2004a) using XMM-Newton set a rather unrestrictive upper limit of 61% pulsed fraction for periods between 1.2 ms and tens of ksec. Halpern et al. (2004) established a restrictive upper limit to a possible radio counterpart at both 1425 and 820 MHz (implying less than 0.02 mJy kpc2 at 1400 MHz). Halpern et al. (2004) also found that the X-ray spectrum of the point source is best fit by a power law plus blackbody model with , kT and R km. We wish to emphasize that the number of counts from the point source (and the PWN and the jet) were quite limited being only 187 (136 and 45) implying large uncertainties in the derived parameters, and indicting that a deeper Chandra observation is called for since the angular scale of the observed features is far to small to be adequately resolved with XMM-Newton.
Finally, Halpern et al. (2004) derived an upper limit to the surface temperature of the underlying neutron star. The upper limit was perhaps conservative in that it only made use of the data from the lowest energy bin rather than examining the full spectrum. On the other hand, the column was fixed and allowed variations of the column might possibly increase the upper limit of K.
In general there is a real need for a systematic presentation (e.g. was fixed or not, what is the confidence level associated with the limit? etc.) of upper limits to neutron star surface temperatures when confronting theory.
2.2.12 SNR 69.0+2.7 (CTB 80)
Moon et al. (2004) observed the SNR CTB 80 (aka SNR 69.0+2.7) with Chandra ACIS-S3 (see Figure 14) as part of a multi-wavelength study. The remnant contains the 40-ms radio pulsar PSR B1951+32 discovered by Kulkarni et al. (1988). The Chandra observations clarified the morphology of the X-ray emission and showed what appears to be a cometary PWN elongated (about 40”) along the direction of the pulsar’s proper motion and seemingly confined by a bow shock produced by that proper motion and thus confirming prior speculations (see e.g. Moon et al. 2004 and references therein).
More recently Li, Lu, and Li (2005) have further analyzed these same data with emphasis on providing spatially-resolved spectra. Li, Lu and Li (2005) find that a power-law plus blackbody model fits the spectrum of the pulsar better than a pure power-law model. In this case the blackbody comprises about 10% of the total flux (with large uncertainties) and a temperature of 0.13 keV. The accompanying power law index was about 1.6. The corresponding blackbody radius was small, about 2 km at the assumed distance of 2 kpc, perhaps implying emission from hot spots. These authors also fit the data to a blackbody plus power law, while fixing the blackbody radius to a value more appropriate to the entire star in an effort to set an upper limit to the surface thermal emission. This approach led to a temperature upper limit () of K, much below the predictions of standard neutron star cooling models (see Figures 8 and 9 of Li, Lu, and Li 2005) as with 3C58 (§ 2.3.3). The time resolution of the data did not permit an analysis for 40-ms pulsations.
2.2.13 SNR 359.230.82 (The Mouse)
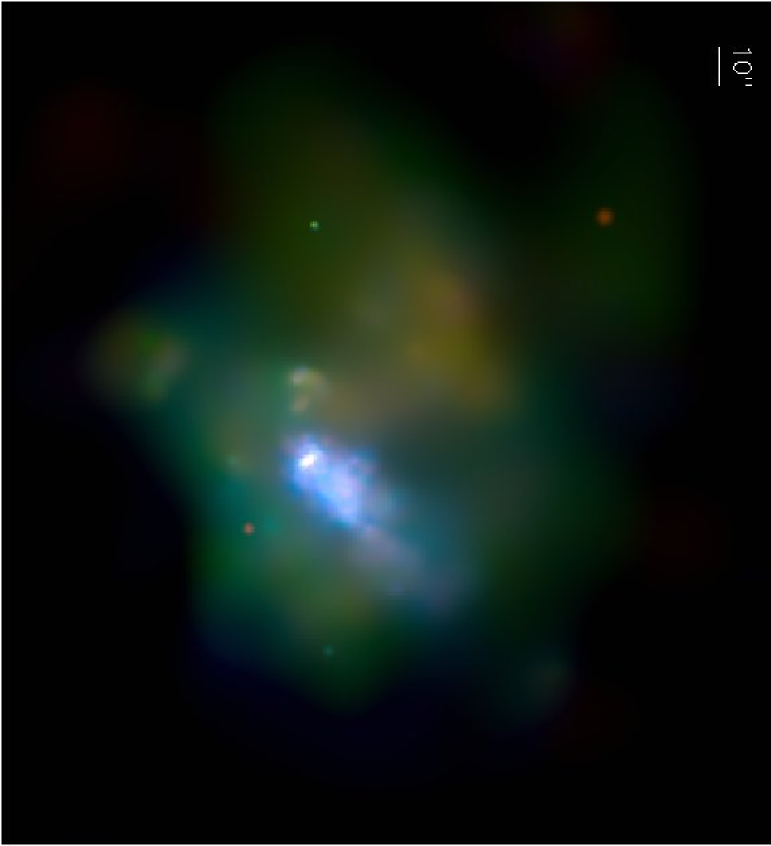
Gaensler et al. (2004) observed the unusually shaped radio source SNR 359.230.82, sometimes referred to as the “mouse”, using ACIS-S3. For a history of observations of this object in all wavelength bands see the introduction to Gaensler et al. (2004) and references therein. Observations with ROSAT by Predehl and Kulkarni (1995) had already detected X-ray emission and they correctly proposed that this source was a bow shock PWN. The Chandra observations confirmed this conclusion and, as shown in Figure 15, provided spectacular details resolving numerous components referred to as the “halo, head, tongue and tail” by Gaensler et al. (2004). We note that Gaensler et al. (2004) goes well beyond the presentation of new observational results and they combine theory and hydrodynamic simulations of bow shocks to unravel the implications of the data. The paper is must reading for those interested in the interaction of a PWN with the environment, especially when the pulsar has a moderately large velocity.
2.2.14 Geminga
Geminga was observed using ACIS-S3 by Sanwal, Pavlov and Zavlin (2004). The resulting image is shown in Figure 16 where one sees what Sanwal, Pavlov, and Zavlin (2004; 2005) term a “wake”, about 10′′ – 15′′ in projected length to the southwest of the pulsar. If one looks carefully, one can also see extended emission a few arc seconds away from the pulsar in the opposite direction, perhaps the head of a bow-shock.
2.3 Finding the pulsars
2.3.1 SNR 296.5+10.0 and 1E 1207.45209
Observations with Chandra have contributed at least two significant new insights into the source 1E 1207.45209 initially discovered with the Einstein Observatory (Helfand & Becker 1984) and located 6’ from the center of SNR PKS 120951/52 (aka SNR 296.5+10.0). The source was first observed with Chandra by Zavlin et al. (2000) using ACIS-S3. These observers used ACIS in continuous clocking mode which allows time resolution of 2.85 ms at the price of one dimension of spatial information and discovered a 424-ms period. The detection of the period, of course, provided compelling evidence that the source is a neutron star. Since the source appears to be radio-quiet (Mereghetti, Bignami, & Caraveo 1996; Kaspi et al. 1996), it may be either an active pulsar beamed out of our line of sight or a truly radio-quiet neutron star, where the X-ray pulsations are caused perhaps by hot spots rotating in and out of our line of sight.
Subsequent to the detection of pulsations, Sanwal et al. (2002) analyzed two ACIS-S3 continuous-clocking-mode observations including the data used to initially detect the pulse period. In addition to establishing a preliminary estimate for the period derivative, these authors also found two significant absorption features centered at 0.7 and 1.4 keV with equivalent widths of about 0.1 keV. Sanwal et al. (2002) discussed several possible interpretations for the absorption including cyclotron resonances and atomic features. They presented arguments favoring atomic transitions of once-ionized helium in the atmosphere of the neutron star assumed to be very strongly (G) magnetized. The exact cause of the Chandra-discovered features is not without different interpretations. For example Hailey and Mori (2002) argued that the absorption features were associated with He-like oxygen or neon in a field of G. More recent observations with XMM-Newton (e.g., Mereghetti et al. 2002; Bignami et al. 2003; De Luca et al. 2004) not only confirmed the Chandra-detected absorption features at 0.7 and 1.4 keV, but also seemed to have uncovered an additional feature at 2.1 and evidence for a fourth 2.8 keV. Taking all these latter data into account supports an explanation involving the fundamental and two, possibly three, harmonics of the electron cyclotron absorption in a field of order G. However, the two additional spectral features in the XMM-Newton data have not been unambiguously accepted. Mori, Chonko, and Hailey (2005) have cast severe doubt as to the reality of the spectral features at 2.1 and 2.8 keV. The arguments given seem compelling and it is thus unfortunate that the Chandra response is insufficient to weigh in on this question without expending significant amounts of observing time.
Zavlin et al. (2004) have continued to observe this target using both Chandra and XMM-Newton. They have detected significant variations in the spin period, which they interpreted in light of three hypotheses: a glitching pulsar; variations in an accretion rate from a fallback disc; and variations in accretion produced by being in a wide binary.
Thus the sequence of Chandra observations have provided important discoveries, especially the detection of the pulse period and firm detection of two absorption features. An important and unanswered question is what are the limits as to the presence of such spectral features for the other NSs in SNR. A systematic comparison, if not already in progress, should be performed.
Finally we note that 1E 1207.45209 is a source that, in some critical respects, is similar to Cas A in that it is in a SNR, is radio-quiet, and has a low-energy spectrum that may be fit by a blackbody with a temperature falling in the range from 0.2–0.6 keV, however it pulses. Thus, on the one hand, the source therefore can be used to give us confidence that all CCOs will ultimately be found to pulse. On the other, this source’s Chandra-revealed characteristics may be used to separate it from the CCO-group of objects.
2.3.2 SNR 292.0+1.8
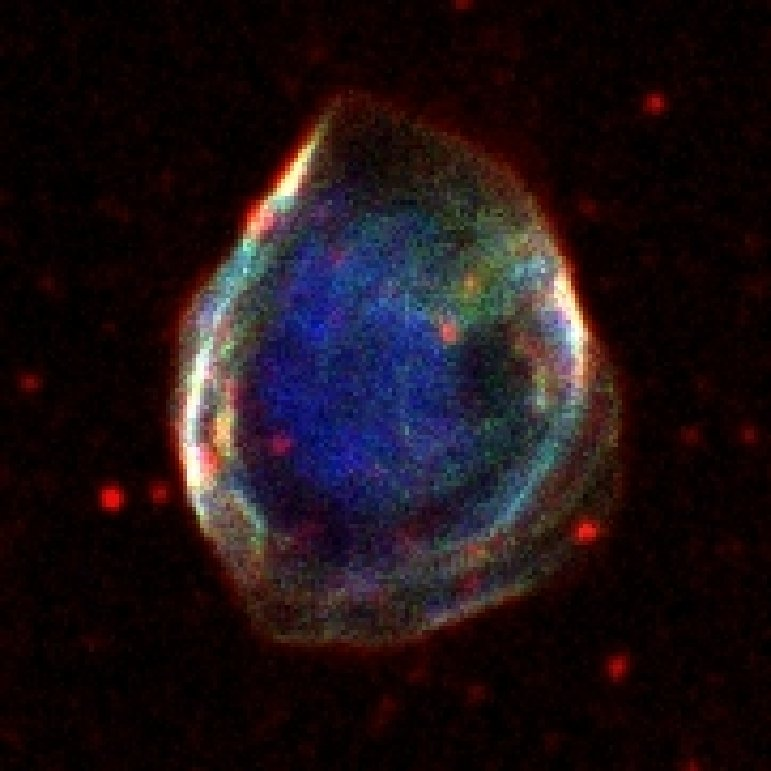
SNR 292.0+1.8 is, along with Cas A and Puppis, one of three known oxygen-rich supernova remnants in the Galaxy. Hughes et al. (2001) performed an observation with ACIS-S3 (Figure 17), detecting a bright, spectrally hard, point source within an apparently extended region. This detection suggested the presence of a pulsar and its pulsar-wind nebula. Radio observations (Camilo et al. 2002b) then found a 135-ms pulsar in SNR 292.0+1.8 localized to within the Parkes beam ( 14 arcmin FHWM). The detection by Hughes et al. (2003b) of X-ray pulses at the expected period from the compact X-ray star secured its identification. The X-ray spectrum is modeled with a simple power law, although, as with Vela, (and many other sources) the fit to the data is not unique. From the motions of oxygen-rich optical knots and the size of the remnant, Ghavamian, Hughes, and Williams (2005) recently estimated a kinematic age for SNR 292.0+1.8 of 3000–3400 years assuming a distance of 6 kpc. This value is in good agreement with the pulsar spin-down age of 2900 years.
2.3.3 3C58
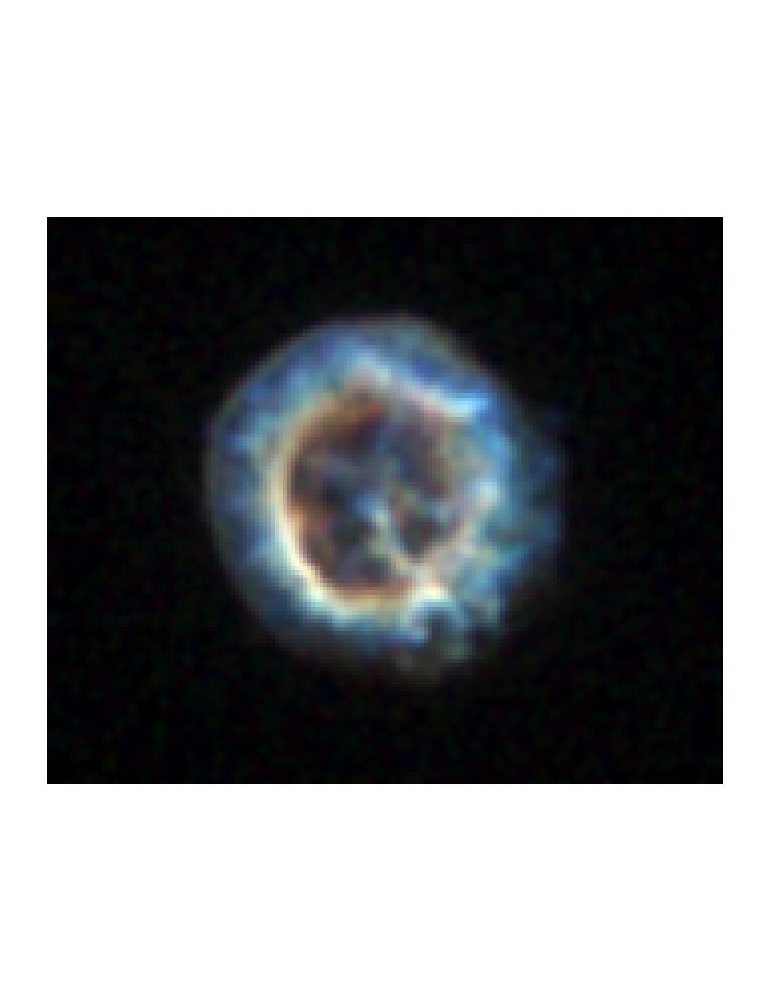
The Chandra observations of 3C58 (aka SNR 130.7+3.1) were first performed by Murray et al. (2002b) using the High Resolution Camera (HRC) which offers excellent time resolution but no spectral information. These data imaged the previously detected X-ray point source (Becker, Helfand, and Szymkowiak 1982) which is associated with the historical SN 1181 (see Stephenson & Green 2002 and references therein). The early Chandra data also revealed the extended PWN and the presence of 66 ms pulsations from the central point source (J0205+6449). Deeper Chandra observations using ACIS-S3 by Slane et al. (2004b) produced images such as that shown in Figure 18 showing the similarity of this PWN with the Crab and Vela.
One aspect of the Chandra-based research of 3C58 of special importance were the limits as to any thermal emission from the surface of this young cooling neutron star. The search for thermal emission was presented by Slane, Helfand, and Murray (2002) and then refined by Slane et al. (2004b) who found that as with SNR 266.21.2 (§ 2.1.2) their upper limit ( K) falls well below predictions of standard neutron star cooling. Yakovlev et al. (2002) discuss calculations of neutron star cooling in the context of 3C58 and concluded that the observations can be explained by the cooling of a superfluid neutron star where the direct Urca process is forbidden.
We note that it is far easier to derive a stringent upper limit to any thermal component for 3C58, in contrast for example to the Crab pulsar, because the flux of 3C58 is much lower. Of course neutron stars may be different, so that limits to the thermal components of both sources, indeed all the young neutron stars, are relevant to compare with theoretical predictions of neutron star cooling. In general, such analyses are not simple, requiring enhanced sensitivity for the detection of the putative thermal component often in the presence of a much stronger non-thermal flux from the magnetosphere of the pulsar, if one wants to measure the temperature — as opposed to setting an upper limit. Chandra is uniquely poised to provide the raw data for such studies due to its ability to maximally separate the pulsar from the surrounding nebulosity, yet often long observations are required.
2.3.4 IC443
Historically, the Chandra ACIS-I3 image of IC443 shown in Figure 19 was a publicity tour-de-force for the Chandra project as the first three authors of Olbert et al. (2001) were high school students at the time. This remnant had been previously well studied as there is a large variety of shocked molecules present due to the interaction with surrounding molecular clouds (see e.g., references in Olbert et al. 2001 and Bykov, Bocchino, & Pavlov 2005). IC 443 is also a candidate counterpart to the EGRET source, 3EG J0617+2238. The image (Figure 19) shows what appears to be a point source behind a bow shock and surrounded by a nebulosity that looks somewhat like a cometary tail. Olbert et al. (2001) also reported accompanying VLA observations which confirmed and complimented the X-ray spatial structure and exhibited varying degrees of polarization as strong as 25%. No pulsations were reported either from the X-ray or the flat spectrum radio observations. Subsequent observations with both Chandra and XMM-Newton (Bocchino and Bykov 2001; Bykov, Bocchino, Pavlov 2005) have also not detected pulsations.
2.4 Not finding the compact objects
In a number of cases high sensitivity searches with Chandra have been unable to specifically identify a compact object associated with a SNR, although often numerous candidate objects have been detected.
2.4.1 SN 1987A
Since launch, SN 1987A has been the focus of a series of repeated observations with Chandra (see Park et al. 2005 and references therein). One goal of these observations is to detect the emergence of the X-ray flux from a newly born compact object. To date, no such object has been detected and Park et al. (2005) assume a spectral form — a power law of photon index 1.7 — and use an absorbing column derived from their fit to the entire remnant to set a 90% confidence upper limit to the 3–10 keV luminosity of ergs s-1. As noted by the authors, the uncertainty as to the correct column to apply to this calculation could easily increase this upper limit.
2.4.2 -Cygni (SNR 78.2+2.1)
Becker et al. (2004) used Chandra to search for the X-ray counterpart to 3EG J2020+4017 (2CG078+2). In particular these authors were following up on the possibility (Brazier et al. 1996) that RX J2020.2+4026 was the counterpart. These observations, thanks to the precision with which X-ray sources in the field could be located, demonstrated conclusively that RX J is associated with a K field star and therefore an unlikely counterpart of the bright EGRET source.
This observation also demonstrated the difficulties one sometimes encounters in searching for compact objects associated with a SNR. Thus, 37 additional X-ray sources were detected in the field searched (which was only a fraction of the full size of the SNR). Radio observations reported by these authors, which covered the complete 99% EGRET likelihood contour of 3EG J2020+4017 with a sensitivity limit of , were unable to find a pulsar. The absence of radio pulsations suggests that if there is a pulsar operating in -Cygni, the pulsar’s emission geometry is such that the radio beam does not intersect with the line of sight. Alternatively, the pulsar is perhaps a CCO-like object which does not produce significant amounts of radio emission.
Without high-precision X-ray spectra of each of the candidate X-ray sources, and detailed follow up in other wavelength bands, there is essentially no satisfactory way in which to eliminate most of the candidates from consideration. In such cases, the principal and important Chandra contribution is to provide target lists with accurate positions as a basis for future studies.
2.4.3 SNRs 315.42.30, 093.3+6.9, 084.2+0.8, and 127.1+0.5
Gvaramadze and Vikhlinin (2003) analyzed archival ACIS-I observations of SNR 315.42.30 (aka MSH 1463, RCW 86) a bright, radio shell-like SNR (see the introduction to Gvaramadze & Vikhlinin 2003 and references therein; see also §5.2 of Kaplan et al. 2004 and references therein). They concentrated their study to a protrusion in the southwest of the remnant based on the hypothesis that the SNR resulted from an off-centered explosion of a moving and massive star. Two X-ray sources were detected in this region, one of which they identified with a foreground star. The second source they identified as a candidate for the compact remnant, in part because of the positional coincidence in support of their hypothesis, and in part because of the absence of an optical counterpart. The location implies a transverse velocity of over 1500 km s-1.
SNR 315.42.30 is also one of the four thoroughly-studied SNR by Kaplan et al. (2004). The additional targets are listed in the title of this section above. Kaplan et al. have embarked on a program to perform systematic studies to search for compact central objects in a distance-limited sample of 23 SNR that lie within 5 kpc. These authors include with their Chandra (and XMM-Newton) observations an accompanying optical/IR identification program taking account of the fact that any such counterparts are expected to be very faint. Using the brightness of the Chandra-discovered CCO in Cas A as a reference, they find no compact central objects associated with these four SNR to a limit of 0.1 Cas A or L ergs s-1. We eagerly await the subsequent papers covering the remainder of the observations.
2.4.4 SNR 41.10.3 (3C 397)
Safi-Harb et al. (2005) used a 66 ksec Chandra ACIS-S3 exposure to study 3C 397 (SNR 41.10.3). One goal of this study was to search the central X-ray hot spot for a compact remnant left by the original supernova. No viable counterpart was found, and these authors placed an upper limit to the 0.5–10.0 keV flux of ergs cm-2 s-1 (L keV) ergs s-1). Unfortunately there are some ambiguities as to how these numbers were obtained as the spectrum used and the confidence levels associated with the uncertainties are not mentioned.
2.4.5 N63A in the LMC
Warren, Hughes, and Slane (2003) observed the supernova remnant N63A in the LMC using ACIS-S3. No hard X-ray point-source was apparent in these data and these authors could rule out a young, energetic, Crab-like pulsar. They set a upper limit to the flux of a point source assuming a power law spectrum with a number index of . The 2.0–8.0 keV flux upper limit was ergs cm-2 s-1, or a luminosity of ergs s-1 (assuming a distance to the LMC of 50 kpc) and applied to the region anywhere in the interior of the SNR. The luminosity limit for a source extended over a diameter of 2 pc (appropriate to a pulsar wind nebula) was higher: ergs s-1.
2.4.6 1E 0102.272.2 in the SMC
This remnant was discovered during the Einstein Observatory survey of the Small Magellanic Cloud (SMC) (Seward and Mitchell 1981). Shortly after its discovery, Dopita, Tuohy, and Mathewson (1981) found oxygen-rich optical emission from the remnant extended over a diameter of 24′′. Subsequent optical spectroscopy (Tuohy and Dopita 1983) revealed that this material was moving rapidly (6500 km s-1 FWHM), identifying 1E 0102.272.2 as the first O-rich SNR in the SMC. Amy and Ball (1993) suggested that a compact feature near the remnant’s projected geometric center in their high resolution (3′′) radio image might be “plerionic” (i.e., emission from a pulsar or pulsar wind nebula). Using a 9 ks ACIS-S3 observation taken during Chandra’s orbital activation and checkout period, Gaetz et al. (2000) set a 3 upper limit to the luminosity of a hard power law component (with number index of 2.05) of erg s-1 (in the energy band above 3 keV).
1E 0102.272.2 is used as a Chandra calibration target and therefore a large number of observations are available in the archive. From a merged data set of on-axis ACIS-S3 observations with a total exposure time of 125 ks, we set a 3 count rate limit of s-1 (3-8 keV band) on the X-ray emission near the center of the SNR at the location of the central radio feature. For a Crab-like spectrum this rate corresponds to an unabsorbed flux of erg cm-2 s-1 (2–8 keV) or an X-ray luminosity of erg s-1 for a distance of 60 kpc.
2.5 Miscellaneous
2.5.1 Kes 73 and 1E 1841045
The anomalous X-ray pulsar 1E 1841045 is associated with the SNR Kes 73. See the introduction to Morii et al. (2003) and references therein for an overview of previous observations. The Chandra observations by Morii et al. (2003) using ACIS-S3 in both timed-exposure (30 ksec) and continuous-clocking (10 ksec) modes were the first for which the pulsar could be spatially separated from the surrounding SNR — totally for the timed-exposure observation and in one dimension for the continuous-clocking observation. The spatial advantage was partially mitigated by these authors, who chose to perform all analyses with the continuous-clocking mode data, no doubt in order to exploit the high time resolution (2.85 ms) for this 11.8 s pulsar. The spectral parameters they found from fitting the data to a power law plus black body were keV, and cm2. We note that the Chandra response function provided for the timed-exposure mode is not precisely transferable to continuous clocking mode data, especially the gain. Sophisticated users tend to let the gain be an additional free parameter when spectrally fitting continuous-clocking mode data. A further indication that an incorrect response function may been applied to these data may be indicated by a rather dramatic and large residual in the spectral fitting at about 1.6 keV, which the authors attributed to the aluminum in the ACIS filters. A similar feature, and at the same energy, was also seen in continuous-clocking mode data by Patel et al. (2003; their Figure 4) who also applied the timed-exposure mode response to continuous-clocking mode data. Since such a feature should not be present, given a proper response function, this coincidence may well indicate that the incorrect response function was used in both cases. If so, it is not clear, however, as to what impact (if any) this might have on the derived spectral parameters. Further work is needed to clarify this issue. It is also possible that the timed-exposure mode response functions used at the time were simply incorrect, leading to spurious features near the aluminum edge. A good check would have been (and is) to compare the phase-averaged pulsar spectrum determined from the data in both modes. Such a comparison would be meaningful if pileup had not been a problem — unfortunately in this case it was (Wachter et al. 2004). Even so, comparing timed-exposure mode and continuous-clocking mode spectra from sufficiently large regions, and well away from the pulsar, might have sufficed and would have been informative.
Wachter et al. (2004) used the timed-exposure mode data to achieve a precise position for 1E1841045. The location enabled them to accomplish a refined, and successful search for an infrared counterpart. The archival data from this observation should be also be analyzed both to establish the validity of the spectrum deduced by Morii et al. (2003) and for any insights that they might provide concerning the spectrum of the extended emission.
2.5.2 SNR 109.11.0 and 1E 2259+586
We include this Chandra observation of 1E 2259+586 and SNR 109.11.0 (aka CTB 109) as the anomalous X-ray pulsar 1E 2259+586 lies along the line of sight to the SNR and may well be associated with it. For a discussion of the AXP-SNR connection see Gaensler et al. (2001). Patel et al. (2001) used Chandra ACIS-S3 to, amongst other things, determine the most precise X-ray position of 1E 2259+586. The Chandra image also shows clear evidence for extended emission, extending from about to more than , which Patel et al. (2001) attributed to the SNR. The precise position enabled Hulleman et al. (2001) to perform deep optical and near-infrared observations with Keck and they found a faint (K mag) candidate counterpart.
Deeper observations, which might serve to establish a possible PWN, would seem called for.
2.5.3 N49
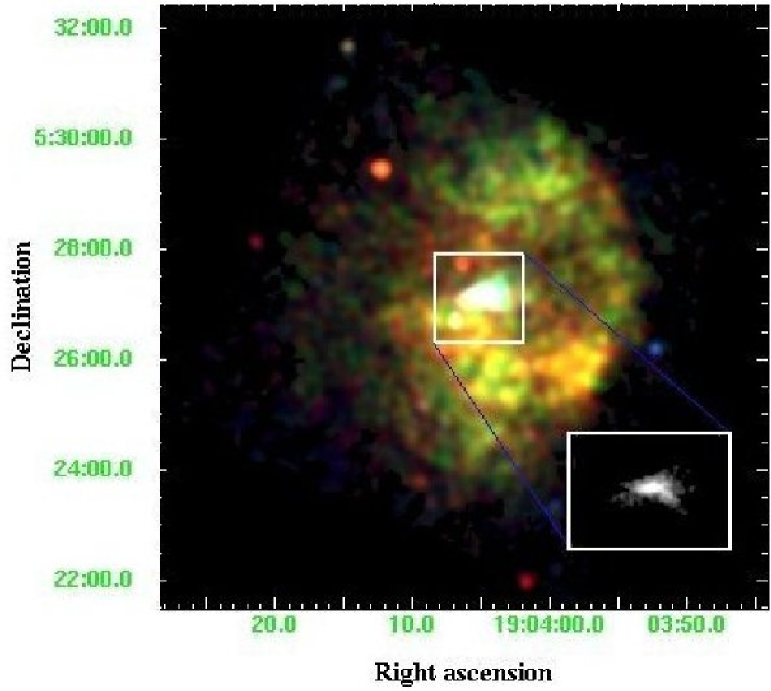
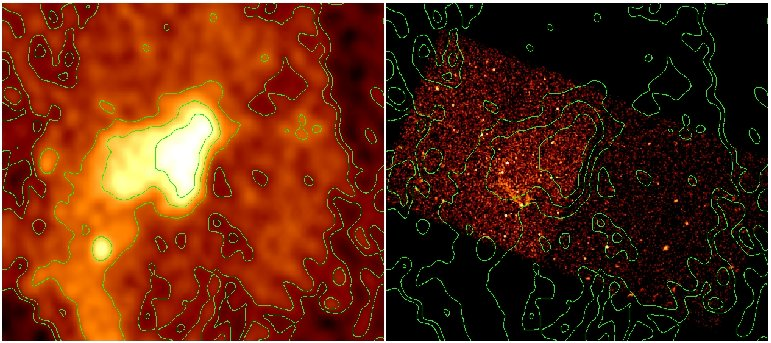
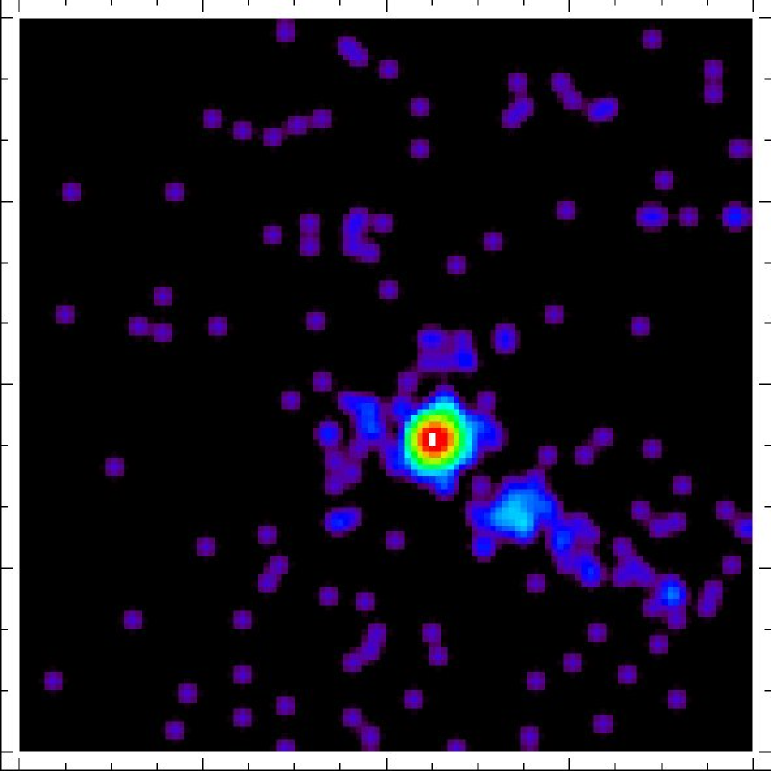
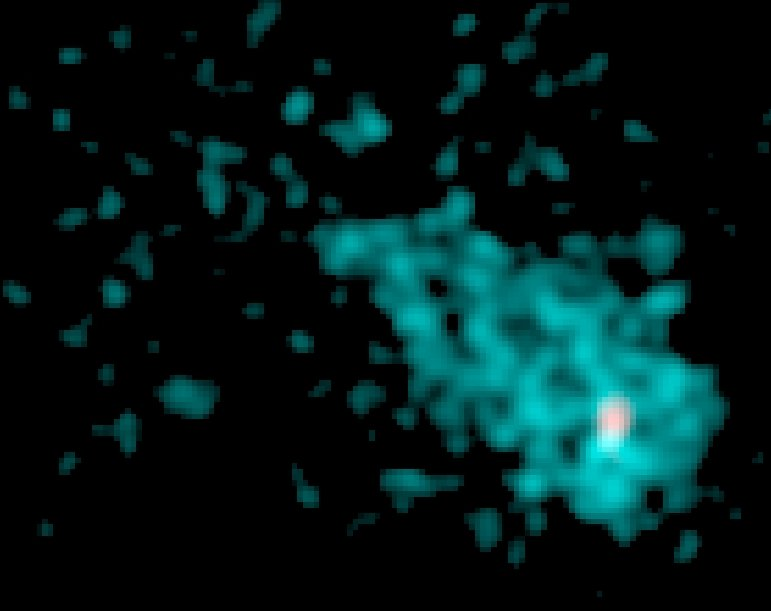
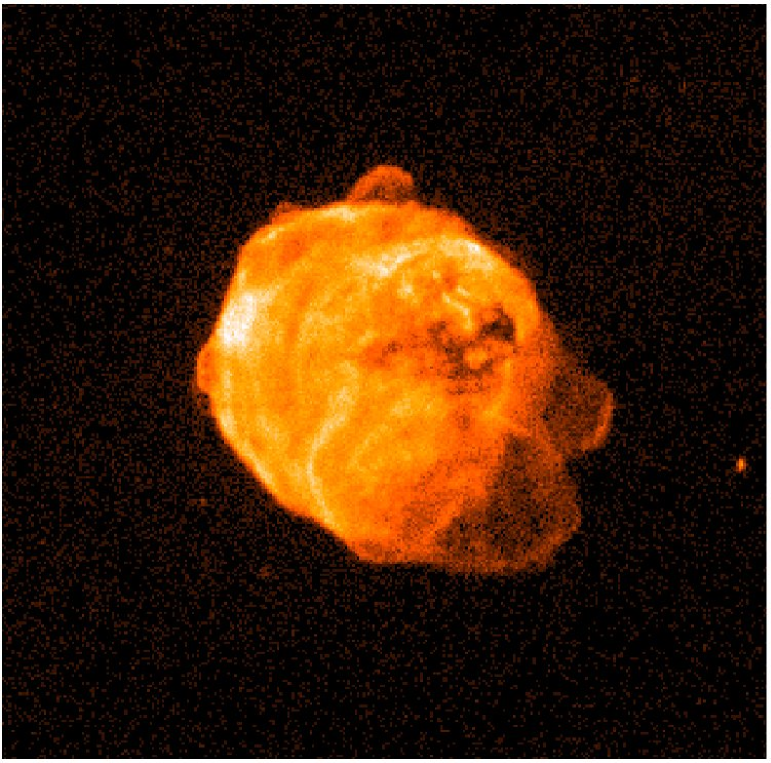
Park et al. (2003) analyzed two ACIS S-3 observations of SNR N49 (aka SNR 052566.0) in the LMC. These authors concentrate their discussion as to the X-ray properties of the gaseous remnant (see § 4.1.5 below), but do present a brief discussion of the point source located in the north-eastern portion of the remnant. This supernova is best known in the high-energy community as the probable site (Cline et al. 1982 — published in all seriousness on April 1) of the famous transient event of March 5, 1979, which has become to be known as the soft gamma-ray repeater (SGR 052666). The tie to N49 is as follows. First, Cline et al. (1982) used data from a network of satellites, including the Einstein Observatory, to provide a precise position described by a narrow rectangle which lay in the northern portion of N49. The association with N49 was compelling. Next, twelve years later, Rothschild, Kulkarni, and Lingenfelter (1994) using ROSAT discovered an X-ray source whose positional error circle intersected the error region associated with the gamma-ray repeater as indicated in their Figure 1. The Chandra image of the region containing the ROSAT source is shown in Figure 20. The Chandra point source lies within the ROSAT error circle and appears to be within the earlier positional uncertainty of the SGR.
The X-ray source would therefore seem to be the SGR in quiescence, and using Chandra ACIS-S3 data Kulkarni et al. (2003) claim a detection of 8-s periodic pulsations, as were observed during the original transient gamma-ray event. The statistical significance of the pulsed X-ray signal is only modest (99.98% confidence level) and suggests a spin-down rate of s s-1 based on two measurements separated by approximately a year and a half. The pulse fraction is low 10%. The characteristic age of the pulsar is 2000 yr, somewhat less than the estimated remnant age of 5000 yr (Vancura et al. 1992).
Kulkarni et al. (2003) and Park et al. (2003) also analyzed the spectral data for the point source. The spectrum was relatively featureless, in contrast to the line-dominated spectra from the rest of the remnant. Kulkarni et al. (2003) fit the spectral data with several models and found that a powerlaw or powerlaw with a blackbody produced acceptable fits. The significance associated with inclusion of the blackbody component, which required a temperature (at infinity) of 0.5–0.6 keV, was only 90%. The photon index of the powerlaw was 3.1 and the absorbing column to the point source, cm-2 is consistent with the absorption to the SNR. Park et al. (2003) fit the spectral data using power law models with to which provided statistically acceptable fits. They also noted that a BB model with a temperature of about 0.5 keV is not ruled out for the low energy data, especially if one also invokes a hard tail. The 0.5 keV BB is characteristic of what one finds for a CCO and it is tempting to speculate as to a possible tie in.
The inability to distinguish simple spectral models seems to be a characteristic of the Chandra and XMM-Newton era of CCD-resolution spectroscopy. In general, the observations are typically much too short to accomplish such an objective. It is also not clear that more sophisticated (admittedly unidentified) mathematical tools are needed to tackle this problem. For example, can one take advantage of the fact that the statistic used as a measure of goodness-of-fit is not distributed as when the model spectral distribution is not representative of the true, underlying, spectrum?
2.5.4 NGC 6822 (Ho 12)
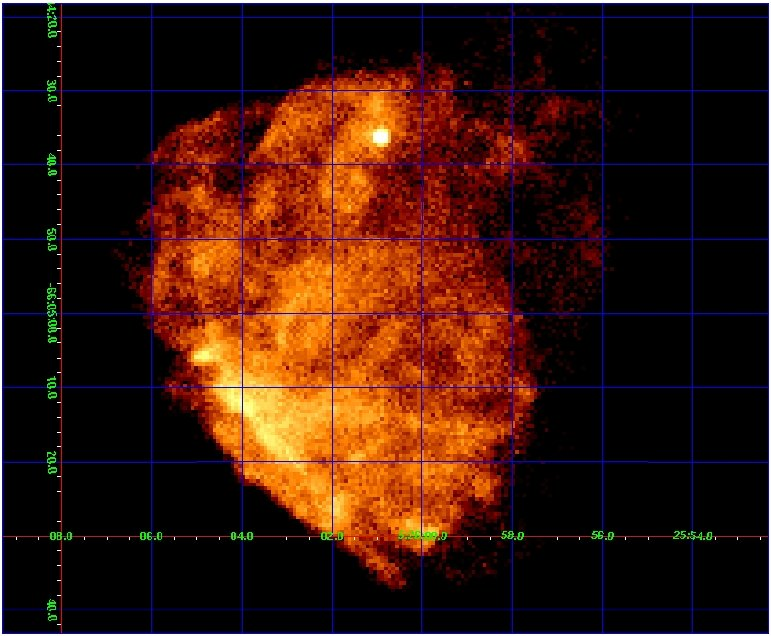
Kong, Sjouwerman, and Williams (2004) analyzed archival Chandra ACIS-I observations that included SNR Ho 12 in the nearby dwarf irregular galaxy NGC 6822. Ho 12 was known to be a SNR based on optical imaging and spectroscopy and an X-ray source had been associated with the SNR based on Einstein imaging — see the introduction to Kong, Sjouwerman, and Williams (2004) and references therein. The Chandra observation (Figure 21) resolves Ho 12 into what appears to be a shell-shaped object about (about 24 pc at 500 kpc) in diameter. The extended image, together with a comparison to optical and radio observations, unambiguously confirms the identification with the SNR. No evidence for, nor an upper limit to, the presence of a point source was presented. This object is an excellent candidate for further study and deeper observations.
3 Basic View of The Debris and Gaseous Parts of Remnants
Here we summarize the basic picture of the origin, development, and evolution of the gaseous remains of supernovae in order to provide some context for the succeeding discussion. We will see that Chandra observations have done much to confirm the basic scenario and also have revealed new complexities.
As the stellar ejecta stream from the site of the SN explosion, they expand and interact with the ambient medium (AM), ultimately evolving into a visible supernova remnant (SNR). A blast wave, which precedes the ejecta, forms in the AM, while a reverse shock propagates back though the ejecta. SNRs gradually become strong X-ray sources over the course of typically hundreds of years as progressively greater amounts of ejecta and AM are shock-heated to X-ray temperatures, a consequence of the high shock velocities (several thousand km s-1) during the early phases of evolution. Typically the X-ray emission is dominated by the SN ejecta at these early stages, a result of both the higher density and metal-rich composition of the reverse shocked ejecta. As the amount of swept-up AM grows, the ejecta tend to decrease in importance both in terms of producing X-ray emission and influencing the remnant’s dynamical evolution. According to theory in the adiabatic phase of evolution, the dynamics depend only on the initial SN explosion energy and the density of the AM (Taylor 1950; Sedov 1959). As a remnant ages further its blast wave velocity drops and radiative cooling at the shock becomes important. A dense cool shell of swept up AM forms as all newly shocked material loses its thermal energy to radiation. This shell surrounds a hot, low density cavity of previously shocked ejecta and AM.
The typically low densities and short evolutionary timescales introduce an important ingredient to the X-ray emission from SNRs, namely the effect of time-dependent or nonequilibrium ionization. A plasma with an electron density of 1 cm-3 and temperature keV takes of order yr to reach collisional ionization equilibrium. Thus the shocked plasma in remnants, which are almost all significantly younger than this, will be in a lower state of ionization than expected based on the plasma temperature. Departures from equilibrium ionization are characterized by the ionization timescale, , which is the product of the plasma electron density and the time since the material was heated.
The Rankine-Hugoniot (RH) relations (e.g., Shu 1992, p. 214ff) tell us about the properties of shocks in general, such as how the temperature and density jump across the shock front depend on the shock velocity, ratio of specific heats, and other properties of the shocked medium. However these relations fail to tell us about a number of astrophysically interesting questions, such as whether individual species in the fluid (electrons, protons, heavy elements) are heated to the same temperatures, or how much of the shock energy might be diverted into a population of relativistic particles (i.e., cosmic rays). These complications remain open to investigation, even though the basic properties of SNR shocks are well established. In the case of an ideal gas with a ratio of specific heats equal to 5/3, the RH relations say that a strong shock moving at speed will heat the gas to a characteristic temperature . This clearly corresponds to emission in the X-ray band, where Chandra has significant sensitivity.
4 Studying Ejecta in Supernova Remnants with Chandra
4.1 Remnants of Young Core Collapse SNe
The most secure way to identify the remnant of a core collapse SNe is through the presence of an associated compact object. In lieu of this we consider oxygen-rich ejecta to be the likely indicator of a core collapse SN. In the following we discuss a selection of remnants that satisfy these requirements. Objects are ordered by approximate chronological age.
4.1.1 SN 1987A
During the six years covered by this review SN1987A has been monitored at least yearly by Chandra. From Oct 1999 until Jan 2004 the 0.5–2 keV X-ray flux of the SNR has increased by a factor of 5 and appears to be growing brighter exponentially (Park et al. 2005). Even from the earliest Chandra observations, deconvolved ACIS images have shown a ring-like geometry. That ring is expanding radially at 4000 km s-1 (Park et al. 2004b). The ACIS-S3 spectra are consistent with circumstellar matter; there is no evidence yet for X-ray emitting ejecta in SN198A.
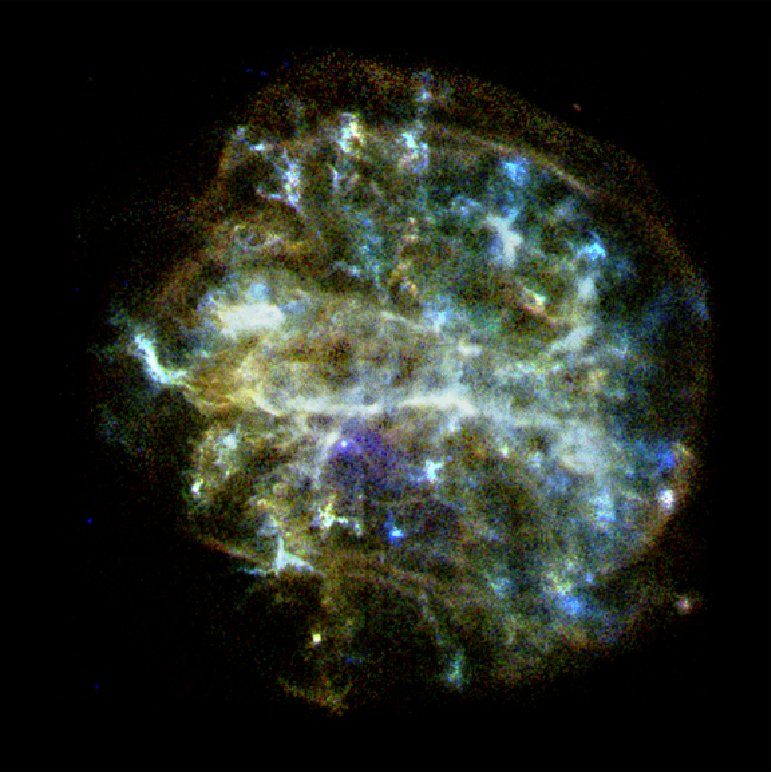
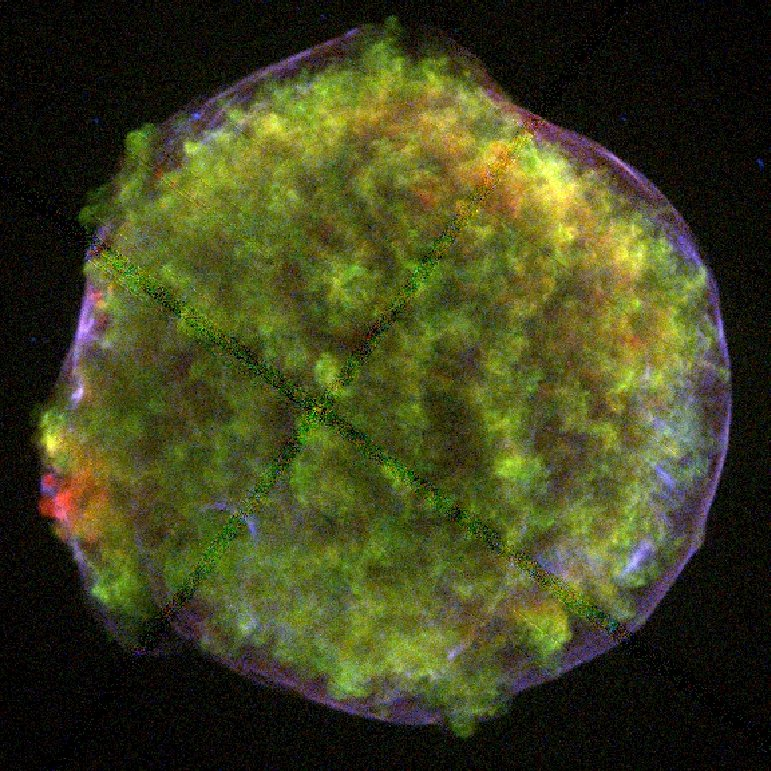
4.1.2 Cas A
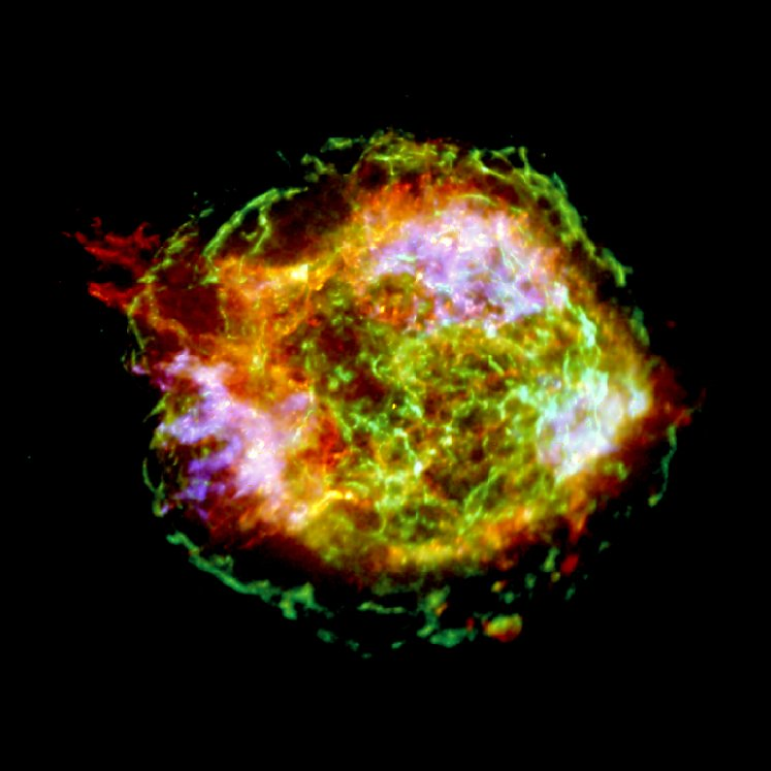
Cas A (Figure 22) was the subject of the first refereed publication on Chandra observations (Hughes et al. 2000a) and has remained an intense focus of study through the subsequent years. This article laid out evidence for three clearly distinct spectral types in Cas A: Si-rich thermal emission, Fe-rich thermal emission, and featureless continuum emission. The Si-rich spectra were dominated by emission from Si and S with little Fe, with a composition similar to that expected from explosive oxygen burning. The Fe-rich spectra showed strong Fe-L and Fe-K shell emission with much weaker Si and S lines, consistent with explosive silicon burning. A further and perhaps more remarkable finding was that the Fe-rich material along the eastern edge of Cas A lay outside the Si-rich material, an inversion of the relative ordering in which these species should have been produced during the SN explosion. This argues for an energetic process of mixing or overturning of the ejecta possibly from neutrino-driven convection. The spectrum of the northeast jet was shown to be less Fe-rich than the knots toward the east. The filaments showing featureless continuum emission are possibly due to synchrotron radiation from relativistic electrons (see §5.2.1 below).
Willingale et al. (2002) used XMM-Newton data to measure the radial velocities of the Si and Fe emission in Cas A. The southeastern knots are generally blueshifted while the northern ones are redshifted and their total velocity range covers 5000 km s-1. The Si velocity results are consistent with earlier measurements (Markert et al. 1983; Hwang et al. 2001) while the results on the velocity of Fe are new. The velocities of the southeastern Si and Fe knots are consistent with each other and confirm that the inversion of the relative ordering between the Si and Fe emission in this region seen in the Chandra images is not a result of some strange velocity structure in the ejecta. In addition Willingale et al. (2002) show that the Fe emission in the northern region is separated from the Si in terms of velocity, with the Fe showing higher speeds. This suggests that the Si and Fe ejecta experienced a spatial inversion of their original locations in the north as well.
Laming & Hwang (2003) and Hwang & Laming (2003) present a sophisticated analysis of the X-ray ejecta in Cas A. Temperature and ionization timescales determined from spectral fits to individual X-ray knots were compared to self-similar hydrodynamic models that incorporate effects of time-dependent ionization, radiative losses, and the exchange of energy between electrons and ions through Coulomb collisions. Several sequences of O-rich knots selected from different parts of the remnant are analyzed in Laming & Hwang (2003) to infer variations in the amount of explosion energy directed into different azimuthal directions. The asymmetry they determine is as much as a factor of two with more energy going into the polar regions (near the jet) than into equatorial regions. This level of asymmetry is, however, less than that expected from asymmetric core collapse explosion models. Hwang and Laming (2003) study the Fe-rich knots in Cas A to obtain important constraints on the extent of mixing in the ejecta. Several Fe-rich knots along the eastern edge that lie beyond the Si-rich ejecta are at a mass coordinate of approximately 2 measured from the center. An extremely Fe-rich feature in the same general vicinity is identified as a possible site of rich freeze-out (when complete Si-burning occurs at low density). This material is produced closest to the center of the exploding star and is therefore most sensitive to the explosion mechanism and the position of the mass cut between the ejecta and compact remnant.
Gotthelf et al. (2001) locate the forward and reverse shocks in Cas A. The position of the forward shock was determined by the set of thin tangential wisps of X-ray continuum emission that extend to a radius of . An increase in radio intensity as well as a large jump in radio polarization angle are coincident with the (local) peak in X-ray continuum emission at this radius. This appears to be the location of the forward shock in Cas A. These authors deproject the Si-line image and radio continuum to estimate the location of the reverse shock, which they determine to be at a radius of . Under the assumption of standard adiabatic shock models (e.g., Truelove and McKee 1999), the relative positions of the forward shock and reverse shock were used to infer that the forward shock in Cas A has swept-up roughly as much mass as was ejected. The location of the contact discontinuity should be determined in order to assess whether the assumption of standard adiabatic shock models should be revised by, for example, including the dynamical effects of cosmic ray acceleration (see § 5.2.2 below).
Delaney and Rudnick (2003) determine the average expansion rate of the forward shock in Cas A to be 4900 km s-1 with a range from place to place that covers 4000–6000 km s-1. In a subsequent article Delaney et al. (2004) carry out an extended study of the kinematics of Cas A as a function of the spectral character of the X-ray emission. They identify four spectrally distinct classes of emission that they designate as Si-dominated, Fe-dominated, low-energy–enhanced, and continuum-dominated. The first two “ejecta-dominated” classes show a mean X-ray expansion rate of 0.2% yr-1, less than the 0.3% yr-1 of the optical ejecta. This discrepancy is posited to be due to a greater deceleration of the lower density X-ray knots compared to the higher density optical knots. The low-energy–enhanced component has a low mean expansion rate 0.05% yr-1 and likely corresponds to the clumpy circumstellar medium. Continuum-dominated filaments in the interior of the remnant also show a low mean expansion rate, although they are spread over a wide range of expansion rates that include some large inward motions. The continuum-dominated filaments around the rim of Cas A are expanding at the same rate as the Si- and Fe-rich ejecta.
Hwang et al. (2004) introduce the Megasec observation of Cas A taken in 2004 (Figure 22). These data reveal clearly a bipolar jet-like structure extending from the northeast to the southwest. The jet was mostly likely produced in the SN explosion process itself rather than being the result of the interaction of the ejecta with the projenitor’s axisymmetric stellar wind. We expect to learn much over the next years from this rich data set.
4.1.3 1E 0102.272.2
In the Chandra ACIS-S3 data of 1E 0102.272.2 (see Figure 23) Gaetz et al. (2000) identify a bright, clumpy, incomplete ring of emission prominent in X-ray lines from He- and H-like oxygen and neon that correlates well with the optically-emitting ejecta. Beyond the ejecta, the Chandra data show a faint shelf of emission, identified as the blast wave interacting with the AM and extending to a diameter of 44′′. The rim of the remnant shows a very sharp, smooth edge, while the outer edge of the ejecta are “scalloped” likely as a result of Rayleigh-Taylor instabilities acting at the contact discontinuity.
Although there is a hint in the ACIS data of spectral variation as a function of radius through the shock-heated ejecta, this effect is most clearly seen in the Chandra High Energy Transmission Grating (HETG) Spectrometer observation presented by Flanagan et al. (2004). The size of 1E 0102.272.2 is well matched to the dispersion scale of the grating, so that images of the remnant in individual lines (e.g., O VIII and Ne X Ly ) are cleanly resolved. Furthermore the prominence of the remnant’s O, Ne and Mg line emission, especially as compared to Fe, significantly reduces the amount of line-blending in the 0.7–1 keV band and allows for the derivation of quantitative results. Constraints on the global plasma properties were obtained from measured O and Ne line fluxes (principally the H-like Ly and He-like resonance and forbidden lines). The global temperature values obtained ( keV for O and keV for Ne) are consistent with those from the XMM-Newton RGS observation Rasmussen et al. (2001).
However, as has been know since the time of ASCA (Hayashi et al. 1994), the global spectrum of this remnant cannot be adequately described by a single component plasma model. The HETG data provide keen insight into why this so. There are azimuthal variations in the relative brightnesses of HETG spectral line images that suggest large scale variations in the plasma properties (for example, the ionization state toward the north is more advanced than the south). But perhaps of greater import is the clear evidence for differences in size of the various spectral line images. The sense of these differences is that lines preferentially produced at lower ionization timescales have images that are smaller, while higher ionization-timescale lines have larger images. This trend is fully compatible with a reverse shock origin, where the innermost visible ejecta are the most recently shocked, while the outermost has been shocked for the longest time. These observational results provide important constraints on the profiles of temperature and ionization timescale throughout the shocked ejecta.
There are systematic distortions in the spectral line images between the + and arms of the HETG spectrum due to Doppler shifts that indicate internal velocity differences within the SNR. The inferred bulk matter flows are of order 1000 km s-1. Additionally the ejecta appear to be distributed in a nonspherical manner (toroidal or cylindrical geometry). This type of study appears to be one that only Chandra is capable of pursuing.
4.1.4 SNR 292.0+1.8
The ejecta and shocked ambient medium of SNR 292.0+1.8 were first studied by Park et al. (2002) using an ACIS-S3 observation (§2.2.4). The remnant is bright in thermal emission from O, Ne, and Mg, but weak in Fe, in strong contrast to the other young Galactic O-rich SNR Cas A. The Chandra image (Figure 17) shows a complex set of knots and filaments, as well as more diffuse, extended emission. Equivalent width maps were used to identify metal-rich ejecta, which are preferentially distributed around the periphery. A prominent feature in the broadband image is a narrow, twisted belt of emission running approximately east-west across the center of the SNR. It is composed of solar-abundance material and hence plausibly is shocked circumstellar gas. Park et al. (2002) argue that it is the relic of the axisymmetric dense stellar wind lost by the progenitor star during its red supergiant phase of evolution. Another feature noted by these authors was a set of narrow filaments with normal composition located around nearly the entire circumference of the SNR. It was suggested that these filaments might be a relic structure in the circumstellar (perhaps related to the progenitor’s stellar wind) being overrun by the blast wave. The more conventional explanation presented by these authors that the narrow, thermal rims represent the outer blast wave may be supported by the presence of similar features at the outer edge of 1E 0102.272.2 (Figure 23).
In a subsequent study Park et al. (2004a) examine in more detail the ACIS-S3 spectra of a number of small-scale emission features that cover a representative range of spectra from across the SNR. A spectrum from the central belt is shown to have abundances that, within a factor of two, are consistent with solar. Other regions, chosen for their prominent line emission, are clearly from SN ejecta and display greatly enhanced abundances of O, Ne, and Mg compared to Si, S and Fe. These abundance patterns are similar to those in 1E 010272.2, while they are quite unlike those in Cas A, which is dominated by Si- and Fe-rich ejecta. Additionally SNR 292.0+1.8 and 1E 010272.2 did not appear to undergo the same sort of extensive overturning of their ejecta that Cas A experienced. The origin for these differences among the class of O-rich SNRs in not understood.
4.1.5 N49
Toward the southwest corner of the SNR N49 Park et al. (2003a) found a spectrally hard X-ray knot beyond the main boundary of the remnant. This feature shows a metal-rich spectrum with apparently enhanced abundances of O, Mg, Si, S, and perhaps Fe. Park et al. (2003a) argue that it is a fragment of ejecta. Since this remnant hosts the famous soft -ray repeater SGR 052666, insights into the nature of the progenitor star based on the properties of the ejecta would be important to obtain. Unfortunately no other metal rich ejecta fragments have been reported and the statistical quality of the knot just described was barely adequate to reveal its metal-rich nature. Deeper insights into the nature of the progenitor will require a considerably longer observation of N49.
4.1.6 N63A and the Vela Bullets
A dramatic example of an LMC remnant where ejecta fragments, bullets, or shrapnel may extend beyond the main shock boundary is the case of N63A (Warren, Hughes, & Slane 2003). The crescent-shaped features seen around the rim here (Figure 24) are very reminiscent of similar features discovered by ROSAT surrounding the Vela SNR (Aschenbach et al. 1995). In N63A none of the outlying regions shows strongly enhanced abundances, so if the features are driven by high speed ejecta clumps, at this point they must have been mixed with considerable amounts of ambient medium. Support that the Vela fragments are in fact SN ejecta have come from Chandra observations by Miyata et al. (2001) of the feature called shrapnel A. Their ACIS-S3 spectrum from the head of the fragment required twice the solar abundance of Si. Shrapnel D is a more definitive case: Katsuda & Tsunemi (2005) find factors of 5-10 enhancements in the O, Ne, and Mg abundances from their XMM-Newton observations. Confidently identifying the site (or sites) in the exploding star where these fragments originated based on the observed nucleosynthetic products is a very important next step.
4.1.7 SNR 004973.6
This object and the one we discuss next are surprisingly similar in many respects and both appear to be mature versions of 1E 0102.272. SNR 004973.6 is 72′′ in diameter (21 pc at the distance of the SMC, 60 kpc). The Chandra ACIS-S3 data show a central ring-like zone of relatively bright emission within a faint, circular shell (Hendrick, Reynolds, and Borkowski 2005). The outer limb-brightened emission is consistent with an adiabatic shock model with equal electron and ion temperatures ( keV) and a preshock hydrogen density of cm-3. The remnant’s inferred age and explosion energy are 14000 yr and ergs, respectively. The central bright emission is enhanced in O and Ne and contains of order 0.35 of O, which suggests a progenitor with a mass of at least 13 . The authors claim that the observed radius of the ejecta shell (6 pc) is inconsistent with the expected location based on 1D hydrodynamical simulations of a 15 progenitor evolving into a uniform AM. To explain the apparent discrepancy Hendrick, Reynolds, and Borkowski (2005) propose the “Ni bubble” effect (i.e., the dynamical effect of the energy deposited within the center of the SN by the radioactive decay of56 Ni). This is an intriguing idea, but needs to be developed more fully, in addition to alternative explanations, such as evolution into a stellar wind density profile.
No mention is made of a compact remnant. We inspected the Chandra data and note the presence of a compact source in the hard band ( 3 keV) about two-thirds of the way out from the center to the outer limb of the remnant. Although this is likely to be an unrelated extragalactic background source we use it to set a limit on the presence of an associated X-ray pulsar. The 3 count rate upper limit for this source is s-1 (3-8 keV band), which for a Crab-like spectrum corresponds to an unabsorbed flux of erg cm-2 s-1. This yields an X-ray luminosity upper limit of erg s-1 (2–8 keV band).
4.1.8 SNR 010372.6
Park et al. (2003b) observed SNR 010372.6, the second brightest X-ray remnant in the SMC, with ACIS-S3. This observation resolved the remnant into a nearly complete, remarkably circular shell of emission 85′′ in diameter (25 pc at the SMC distance) surrounding a smaller region with bright clumpy O- and Ne-rich emission. The fitted O and Ne abundances of the central ejecta emission are significantly enhanced above the SMC values, while Fe is rather low. The relative abundances of O, Ne, Mg, and Si are reasonably consistent with the nucleosynthetic yields from an 18 star. The outer zone is consistent with blast wave emission from a remnant in the adiabatic stage of evolution. The preshock hydrogen density of the AM is cm-3, the SN explosion energy is ergs, and the age of the remnant is 18000 yrs. This is the oldest known example of an O-rich SNR and was the first one discovered by its X-ray emission.
Park et al. (2003b) state that all the remnant’s emission lies below 3 keV, but give no quantitative upper limit on the flux of a compact source with a hard power-law spectrum. The brightest point source within the extent of the SNR (according to our own inspection of the Chandra data) provides a 3 count rate upper limit of s-1 (3-8 keV band), which for a Crab-like spectrum corresponds to an unabsorbed flux of erg cm-2 s-1 or a luminosity of erg s-1 (2-8 keV band).
4.2 Remnants of Type Ia SNe
Other than with an optical spectrum from near the time of optical maximum, there is no definitive way to identify the remnant of a Type Ia SN (SN Ia). (In a remarkable advance it may become possible to use light echoes to obtain optical spectra from ancient SN; see Rest et al. 2005.) In some cases, historical light curves have been used, although this can only be suggestive. Several other methods have been proposed based on the expected properties of the progenitor or its environment, such as (1) a Chandrasekhar mass of ejecta, (2) partially neutral surrounding ambient medium (Tuohy et al. 1982), or (3) the X-ray emission from the shocked ejecta (Hughes et al. 1995). An additional factor, although not definitive, is the absence of a compact remnant. One final introductory note is that, because the ejecta in SN Ia remnants are essentially invisible in the optical band, the best way to study it is in the X-ray band.
4.2.1 Tycho
It was Hamilton, Sarazin, and Szymkowiak (1986b), who presented the first detailed argument that this bright remnant, observed as a SN by Tycho Brahe and others in 1572, had a SN Ia origin. They demonstrated consistency between the global X-ray spectra available at the time and a model of 1.4 solar masses of layered SN Ia ejecta interacting with a uniform ambient medium. Much of the Fe in their model was interior to the reverse shock and hence unshocked. Since this study, our understanding of Tycho’s SNR has advanced in several areas. The ejecta are clumpy (see Figure 25), although nowhere near as inhomogenous as the core collapse remnants Cas A and SNR 292.0+1.8, and reach to the very edge of the rim in places (Hwang et al. 2002). Spectral inhomogeneities throughout the ejecta are generally modest, with two important exceptions. There is a radial variation in the line intensities: Si, S, and Fe-L shell line emission reach their peak surface brightness at larger radii than does the Fe K line emission (Hwang and Gotthelf 1997; Hwang et al. 2002). Toward the eastern limb are a few knots that bulge out beyond the rim; the spectral differences between these knots (the northern one is Si-rich, like the bulk of the ejecta, while the southern one is Fe-rich) were first noted by Vancura, Gorenstein, and Hughes (1995). The origin of these small-scale spectral inhomogenities is not yet explained, although an interesting idea is that they may be related to the SN Ia ignition process (Hughes et al. 2005a). Based on the analysis of a 150 ksec ACIS-I observation, Warren et al. (2005) found the contact discontinuity to be considerably more structured than the blast wave, indicating the action of the Rayleigh-Taylor instability there.
Badenes et al. (2003), following firmly in the footsteps of Hamilton, Sarazin, and Szymkowiak (1986b), have developed a detailed model for the X-ray emission from remnants of SN Ia. Starting from realistic SN models that span the range of proposed explosion models, the ejecta are evolved to the remnant stage with attention to relevant heating, ionization and thermal effects. Comparison of their model to an XMM-Newton spectrum of the Tycho SNR (Decouchelle et al. 2001) suggests the delayed detonation model as the best choice. Badenes, Borkowski, & Bravo (2005) further utilize their model to explain the radial variation in the X-ray spectrum of Tycho spectra as being due to the temperature profile through the ejecta. They require a region of higher temperature and lower ionization timescale in the Fe-rich zone near the reverse shock, which can result from a modest amount of collisionless electron heating at the reverse shock. They also argue that SN Ia ejecta need to be stratified to some extent which puts serious constraints on current three-dimensional SN Ia deflagration explosion models which tend to produce well-mixed ejecta.
4.2.2 050967.5
Like the Tycho SNR this remnant (Figure 26) has provided valuable clues to the SN Ia explosion process. Warren & Hughes (2004) show that the integrated ACIS-S spectrum is dominated by emission from ejecta. The integrated abundances of O, Ne, Mg, Si, S Ar and Ca from their fits are consistent with yields from SN Ia models, with some preference for a delayed detonation model (Iwamoto et al. 1999). There is considerably less hot Fe than expected, arguing that most of the Fe in the ejecta is cold and lies interior to the reverse shock. The mass of Si inferred from the spectral analysis is 0.2 when clumping is taken into account, which is in line with SN Ia models.
4.2.3 N103B
N103B was first suggested to have a SN Ia origin by Hughes et al. (1995) based on qualitative inspection of its ASCA X-ray spectrum. This was somewhat of a surprise given the remnant’s relative proximity to the young star cluster NGC 1850, only about 40 pc away in projection (Chu & Kennicutt 1988). Optically, N103B consists of several small bright knots that show the usual set of emission lines seen in radiative shocks: [O iii] 5007, [S ii] 6716, 6731, H, and so on (Danziger & Leibowitz 1985). The abundances of N103B inferred from optical spectroscopy are consistent with the swept-up interstellar medium of the LMC (Russell & Dopita 1990). These characteristics suggested a massive star progenitor and a dense ambient medium.
In their analysis of the N103B XMM-Newton data van der Heyden et al. (2002) argue for a massive star progenitor. They base this conclusion on abundances derived from RGS data integrated over the entire SNR. They find more total O compared to Si and Fe than expected from a SN Ia and suggest a core collapse SN as a viable alternative. Unfortunately in their comparison to the model yields they do not include a swept-up component (which would contribute a significant mass of O) in addition to the ejecta and so their conclusion on the originating SN type cannot be considered definitive.
According to Lewis et al. (2003), who studied the Chandra ACIS-S3 data, N103B consists of several spectrally distinct spatial regions. These include a centrally located region of hot Fe with low ionization timescale surrounded by a shell-like region dominated by the Si-group elements, features that resemble those of the Tycho SNR. On the other hand the O, Ne, Mg, and continuum emission, which are clearly required by the spectra, do not show a definitive radial trend and, in particular, are not distributed in a shell-like geometry. It was suggested that this emission could be clumpy foreground or background ambient material overrun by the forward shock. Based on the estimated masses of the Si-group elements and Fe, Lewis et al. (2003) argued that a SN Ia interpretation was preferred.
N103B bears similarities to the Kepler SNR, which also shows an Fe-rich X-ray spectrum (Cassam-Chenaï et al. 2004), a large asymmetry in brightness from one hemisphere to the other, more centrally located Fe emission, and evidence for interaction with a dense ambient medium. If, at some point, these remnants are confidently identified with SN Ia events, they might be able to shed light on the still poorly understood properties of the environment and/or companion star.
4.2.4 SN1006
Hamilton, Sarazin, and Szymkowiak (1986a) attempted to model the global spectrum of SN1006 in terms of an exploded white dwarf as they suceeded in doing for the Tycho SNR. However, unbeknowest to them, the global spectrum of SN1006 is dominated by nonthermal X-ray emission coming from the northeast and southwest rims as first demonstrated by Koyama et al. (1995) using ASCA. These appear as the whitish rims in Figure 27, which is a complete Chandra image of SN1006 from a mosaic of eleven individual 22 ksec long ACIS-I pointings (Hughes et al. 2005b).
The thermal emission from SN1006 is dominated by O emission as shown by Long et al. (2003) in their analysis of two deep Chandra observations (O emission appears reddish in Figure 27). Toward the northwest there is a long thin feature, coincident with an H optical filament, whose spectrum is consistent with shocked ambient medium. Elsewhere the ejecta dominate. SN1006’s ejecta display a fluffy structure that is similar in appearance and physical scale to the fluff seen in Tycho. Ejecta clumps in SN1006 also appear to extend to the forward shock. ACIS-S3 spectral fits to the ejecta emission near the northwest filament require enhanced abundances of O, Mg, Si, and Fe according to Long et al. (2003). In an analysis of XMM-Newton RGS grating data Vink et al. (2003) find no evidence for Fe XVII emission and can fit the EPIC data with emission only from the species N, O, Ne, Mg, and Si, as well as a hydrogen continuum.
It has been known for some time that SN1006 contains signficant amounts of cold Fe in its interior based on UV absorption lines in the continuum emission of a background star (Wu et al. 1983). This has been one of the strongest arguments in support of its SN Ia origin. The presence of Fe in the shocked ejecta is therefore of some importance, since it would tell us about the extent of radial mixing in these explosions.
4.2.5 DEM L71 and other older SN Ia SNRs
The LMC SNR DEM L71 is some 4000 yr old (Ghavamian et al. 2003). The Chandra ACIS-S3 data (Figure 28) show a clear double shock morphology: an outer rim present in both the broadband X-ray and H optical emission and a central excess only seen in the X-ray band, predominantly above 0.7 keV (Hughes et al. 2003). The outer rim is the blast wave in the ambient medium, while the central excess corresponds to Si and Fe-rich ejecta. The ratio of Fe to O in the ejecta is at least 5 times the solar ratio. From the relative locations of the contact discontinuity and the blast wave shock an estimate of the total ejecta mass of 1.5 was obtained. Masses estimated from the X-ray emission are generally consistent with this value and further show that the mass of Fe is some 6 times that of Si. These properties are fully consistent with the picture that DEM L71 is a middle-aged SN Ia remnant.
It is possible that even older SN Ia remnants may have been identified. Hendrick, Borkowski, & Reynolds (2003) report on the discovery of metal-rich ejecta in the LMC SNRs 054870.4 and 053469.9, which are estimated to be 10,000 yr old. Their spectral analysis yields a value for the ratio of O/Fe in the ejecta that is intermediate between the typical SN Ia and core collapse SN. On the other hand the mass limits they derive are of order 1 or less, supportive of the SN Ia hypothesis.
5 Shock Properties
5.1 Electron-ion temperature equilibration
For a current review of this topic see Rakowski (2005). In the following we highlight studies that utilize X-ray emission to investigate the heating of electrons, protons, and heavier ions at high Mach number shocks.
In a pair of papers on the LMC SNR DEM L71, Rakowski, Ghavamian, and Hughes (2003) and Ghavamian et al. (2003) use optical and X-ray observations to separately measure the post-shock proton and electron temperatures. The proton temperature comes from the width of the broad H line component (for details see Ghavamian et al. 2001 and references therein) and corresponds to a very thin region (10-3 pc) right behind the shock front. The X-ray emission constrains the electron temperature. Since even Chandra’s spatial resolution is insufficient to resolve the post-shock region, modeling was required in order to infer the immediate post-shock electron temperature. Model effects included the temporal evolution in temperature and ionization timescale as well as equilibration due to Coulomb collisions between the electron and protons. Using this technique it was possible to constrain the initial post-shock ratio of electron to proton temperatures over a factor of two in shock velocity (500–1000 km s-1). Lower velocity shocks were found to have nearly equal post-shock electron and proton temperatures, while the higher velocity ones showed significantly lower levels of temperature equilibration. These results are in good agreement with the published estimates of the electron to proton temperatures (done with a different method using only the optical data) from four other SNRs: SN1006, Tycho, RCW 86, and the Cygnus Loop (Ghavamian et al. 2001).
In their Chandra HETG study of SN1987A, Michael et al. (2002) investigated electron-ion temperature equilibration using X-ray line widths from a combined line profile including emission from N, O, Ne, Mg, and Si. The widths are due to thermal and turbulent broadening as well as the bulk motion expansion of the remnant. The first two effects should produce symmetric, Gaussian profiles, while the latter profile will depend on the detailed geometry of the expanding source. Michael et al. (2002) tried several different geometries for this and arrived at a shock velocity, km s-1, that is consistent with the radio and X-ray expansion rates. Their measured electron temperature, keV, is much lower than the post-shock temperature, 17 keV inferred from the line widths. After accounting for Coulomb equilibration between the electron and ions, the immediate post-shock ratio of electron to shock temperature can only be 10%.
Vink et al. (2003) also use line widths to estimate ion temperatures. They observed a bright knot along the northwestern limb of SN1006 with XMM-Newton and extracted a spectrum using the RGS. They found that the O lines were broadened by eV, which, if interpreted as a thermal broadening, indicated an O temperature of keV. The observed electron temperature from this knot was only 1.5 keV, which argues for incomplete electron-ion heating.
Hwang et al. (2002) observed the forward shock region in the Tycho SNR with Chandra ACIS-S3 and set a limit of 2 keV on the electron temperature there. This was shown to be significantly less than the shock temperature inferred from the radio (Reynoso et al. 1997) and X-ray (Hughes 2000) expansion rates. A limit of 0.03–0.12 was set on the amount of collisionless electron heating at the forward shock of Tycho. We also note that Badenes, Borkowski, & Bravo (2005) require roughly the same amount of collisionless electron heating (10%) at the reverse shock to explain the X-ray properties of the Fe-rich ejecta in the Tycho SNR.
5.2 Cosmic Ray Acceleration
One of the most important and possibly paradigm-shifting results from Chandra observations has come in demonstrating that SNRs are the sites for the shock acceleration of high energy (TeV range) cosmic rays. Our discussion of this is divided in two broad categories: evidence for the electron component and evidence for the hadronic component. Again we focus on results from the 0.2–10 keV X-ray band.
5.2.1 Evidence for the Electron Component
Prior to Chandra there were three shell-like remnants whose emission in the 0.5-10 keV band was dominated by featureless powerlaw continuum: SN1006 (Koyama et al. 1995), SNR 347.30.5 (aka RX J1713.73946) (Koyama et al. 1997, Slane et al. 1999), and SNR 266.21.2 (Slane et al. 2001). Other young SNRs (Cas A, Tycho, RCW 86, and Kepler) showed evidence for hard power-law emission at energies beyond 10 keV (Allen, Gotthelf, & Petre 1999). These featureless power-law spectra, widely believed to arise from synchrotron radiation, suggested the presence of highly energetic (TeV range) electrons in these remnants.
Chandra has contributed to this area in several important ways. First was the discovery of geometrically thin, spectrally featureless filaments in remnants with predominantly thermal emission in the Chandra X-ray energy band. Examples include Cas A, where these filaments are visible as the green-colored network in Figure 22 (Hughes et al. 2000, Gotthelf et al. 2001), and Tycho, where the thin bluish rim in Figure 25 displays a featureless X-ray spectrum (Hwang et al. 2002; Warren et al. 2005). Similar thin, spectrally featureless filaments are present in RCW 86 (Rho et al. 2002) and Kepler (Bamba et al. 2005b). In these cases as well as SN1006 (Long et al. 2003; Bamba et al. 2003), SNR 347.30.5 (Uchiyama et al. 2003; Lazendic et al. 2004) and SNR 266.21.2 (Bamba et al. 2005a), the structure of the featureless rims are consistent with thin sheets of X-ray emission, with widths in most cases significantly less than a parsec.
Synchrotron cooling of the high energy electrons accelerated at the shock front is one widely discussed interpretation for the origin of the thin featureless X-ray filaments (Vink & Laming 2003; Berezhko, Ksenofontov, & Völk 2003; Berezhko & Völk 2004; Völk, Berezhko, & Ksenofontov 2005; Warren et al. 2005). These studies provide estimates for the magnetic field within the filaments of order 100 G, far above the Galactic value and evidently requiring magnetic field amplification at the shock front. An alternate view (Pohl, Yan, & Lazarian 2005) posits that the X-ray filaments are actually magnetic filaments. In this case the X-ray emission falls off rapidly behind the shock because the magnetic field, initially enhanced, is efficiently damped over a post-shock distance of some – cm. Careful comparison of radio and X-ray observations of young remnants might be able to discriminate between the two interpretations presented here.
Chandra has also discovered new cases of shell-like SNRs with powerlaw continuum. In the case of the ejecta-dominated SNR 050967.5, Warren & Hughes (2004), based on dynamical arguments, propose that the continuum emission is likely to have a nonthermal origin. Bamba et al. (2004) report the discovery of nonthermal X-ray emission from a portion of the shell of the LMC superbubble 30 Dor C. The spectral index of the emission is consistent with the other cases mentioned here. These objects, both in the LMC, are too distant for even Chandra to provide useful constraints on the thickness of the nonthermal emission regions.
5.2.2 Evidence for the Hadronic Component
Direct detection of the hadronic component of cosmic rays in SNRs is a critical apect of the overall scenario that remains to be demonstrated. A prime method for doing this relies on observing TeV -rays from the decay of pions produced when cosmic ray protons accelerated at the SNR shock interact with local interstellar gas. Such emission has not yet been confidently detected.
If the acceleration process is efficient, a significant fraction of the SNR shock energy can be diverted from the thermal gas and end up in the relativistic component. In a study of the SMC SNR 1E 0102.272.2, Hughes, Rakowski, & Decourchelle (2000b) measured the expansion rate (proper motion) of the SNR to determine a blast wave velocity of 6000 km s-1. From this value they determined a range of electron temperatures 2.5–45 keV, dependent on the degree of collisionless electron heating. Their measured electron temperature from Chandra ACIS-S3 spectroscopy ( keV) was significantly lower than the range expected from the shock velocity. They argued that the only plausible way to reconcile the different electron temperature values was if a significant fraction of the shock energy, rather than contributing to the heating of the post-shock electrons and ions, had gone into generating cosmic rays.
It should also be possible to rely on the dynamical effects that cosmic ray protons have on the evolution of SNRs (Decourchelle, Ellison, & Ballet 2000). The softer equation of state of a relativistic fluid and the possibility that cosmic ray particles may escape from the shock result in a compression factor that is larger than the typical value of 4. This results in a shrinking of the gap between the contact discontinuity and forward shock. Warren et al. (2005) measure the relative locations of the forward shock, contact discontinuity, and reverse shock in the Tycho SNR using Chandra observations. The observed distance between the contact discontinuity and forward shock is too small to be explained by hydrodynamic models that ignore cosmic ray acceleration. The authors show that the energy density in relativistic electrons alone is insufficient to alter the dynamics of the forward shock, which points to the requirement for a signficant component of relativistic ions. The energy density of the cosmic ray ions needs to be 50 times or more that of the electrons, close to the well-established ratio of 100 for Galactic cosmic rays.
6 Acknowledgments
Images labeled “courtesy NASA/…” are publicly available at http://chandra.harvard.edu/. Other contributors of figures are acknowledged in the figure captions. MCW appreciates a thorough reading of, and comments to, a draft of this manuscript by V. Zavlin. JPH acknowledges C. Badenes, G. Cassam-Chenaï, and J. Warren for helpful discussions related to this article.
References
- Allen et al. (1999) Allen, G., Gotthelf, E. V., & Petre, R. 1999, in Proc. of the 26th International Cosmic Ray Conference, edited by D. Kieda, M. Salamon, and B. Dingus, vol. 3, p. 480
- Amy & Ball (1993) Amy, S. W., & Ball, L. 1993, ApJ, 411, 761
- Aschenbach & Brinkmann (1975) Aschenbach, B., & Brinkmann, W. 1975, A&A, 41, 147
- Aschenbach (1998) Aschenbach, B. 1998, Nature, 396, 141
- Aschenbach (2002) Aschenbach, B. 2002, in Proceedings of the 270. WE-Heraeus Seminar on Neutron Stars, Pulsars, and Supernova Remnants. MPE Report 278. Edited by W. Becker, H. Lesch, and J. Trümper. Garching bei München: Max-Plank-Institut für Extraterrestrial Physik, 13
- Aschenbach et al. (1995) Aschenbach, B., Egger, R., & Trumper, J. 1995, Nature, 373, 587
- Badenes et al. (2005) Badenes, C., Borkowski, K. J., & Bravo, E. 2005, ApJ, 624, 198
- Badenes et al. (2003) Badenes, C., Bravo, E., Borkowski, K. J., & Domínguez, I. 2003, ApJ, 593, 358
- Bamba et al. (2004) Bamba, A., Ueno, M., Nakajima, H., & Koyama, K. 2004, ApJ, 602, 257
- Bamba et al. (2005a) Bamba, A., Yamazaki, R., & Hiraga, J. S. 2005a, ApJ, 632, 294
- Bamba et al. (2003) Bamba, A., Yamazaki, R., Ueno, M., & Koyama, K. 2003, ApJ, 589, 827
- Bamba et al. (2005b) Bamba, A., Yamazaki, R., Yoshida, T., Terasawa, T., & Koyama, K. 2005b, ApJ, 621, 793
- Becker, Helfand, and Szymkowiak (1982) Becker, R. H., Helfand, D. J., & Szymkowiak, A. E. 1982, ApJ, 255, 557
- Becker & Aschenbach (1995) Becker, W., & Aschenbach, B. 1995, in The Lives of Neutron Stars, Kluwer Academic Publishers, 47
- Becker & Aschenbach (2002) Becker, W., & Aschenbach, B. 2002, in Proceedings of the 270. WE-Heraeus Seminar on Neutron Stars, Pulsars, and Supernova Remnants. MPE Report 278. Edited by W. Becker, H. Lesch, and J. Trümper. Garching bei München: Max-Plank-Institut für extraterrestrische Physik, 64
- Becker & Pavlov (2001) Becker, W., & Pavlov, G.G. 2001, in The Century of Space Science, eds. J. Bleeker, J. Geiss & M. Huber, Kluwer Academic Publishers, 721 (also astro-ph/0208356).
- Becker et al. (2004) Becker, W,, Weisskopf, M, C., Arzoumanian, Z., Lorimer, D., Camilo, F., Elsner, R. F., Kanbach, G., Reimer, O., Swartz, D. A., Tennant, A. F., & O’Dell, S. L. 2004, ApJ, 615, 897
- Berezhko et al. (2003) Berezhko, E. G., Ksenofontov, L. T., & Völk, H. J. 2003, A&A (Letters), 412, L11
- Berezhko & Völk (2004) Berezhko, E. G., & Völk, H. J. 2004, A&A, 419, L27
- Bignami et al. (2003) Bignami, G. F., Caraveo, P. A., De Luca, A., & Mereghetti, S. 2003, Nature, 423, 725-727
- Bocchino & Bykov (2001) Bocchino, F., & Bykov, A. M. 2001, A&A, 376, 248
- Brazier et al. (1996) Brazier, K.T.S., Kanbach, G., Carraminana, A., Guichard, J., & Merck, M. 1996, MNRAS, 281, 1033
- Brinkmann, Aschenbach, & Langmeier (1985) Brinkmann, W., Aschenbach, B., & Langmeier, A. 1985, Nature, 313, 662
- Bykov, Bocchino, & Pavlov (2005) Bykov, A. M., Bocchino, F., & Pavlov, G. G. 2005, ApJ (Letters), 624, L41
- Camilo et al. (2000) Camilo, F., Kaspi, V. M., Lyne, A. G., Manchester, R. N., Bell, J. F., D’Amico, N., McKay, N. P. F., & Crawford, F. 2000, ApJ, 541, 367
- Camilo et al. (2002a) Camilo, F., Lorimer, D. R., Bhat, N. D. R., Gotthelf, E. V., Halpern, J. P., Wang, Q. D., Lu, F. J., & Mirabal, N. 2002a, ApJ (Letters), 574, L71
- Camilo et al. (2002b) Camilo, F. Manchester, R.N., Gaensler, B.M., Lorimer, D.R. & Sarkissian, J. 2002b, ApJ (Letters), 576, L71
- Canizares (2004) Canizares, C. R. 2004, In Frontiers of X-ray astronomy. Edited by A. C. Fabian, K. A. Pounds, R. D. Blandford. Cambridge (UK): Cambridge University Press, 107
- (29) Caraveo, P. A., Bignami, G. F., & Trümper, J. E. 1966, The Astronomy and Astrophysics Review, 7, 209
- Cassam-Chenaï et al. (2004) Cassam-Chenaï, G., Decourchelle, A., Ballet, J., Hwang, U., Hughes, J. P., & Petre, R. 2004, A&A, 414, 545
- Chakrabarty et al. (2001) Chakrabarty, D., Pivovaroff, M. J., Hernquist, L. E., Heyl, J. S., Narayan, R. 2001, ApJ, 548, 800
- Chu & Kennicutt (1988) Chu, Y.-H., & Kennicutt, R. C., Jr. 1988, AJ, 96, 1874
- Cline et al. (1982) Cline, T. L., Desai, U. D., Teegarden, B.J., Evans, W.D., Klebesadel, R.W., Laros, J. G., Barat, C., Hurley, K., Niel, M., Vedrenne, G., Estuline, I.V., Kurt, V.G., Mersov, G.A., Zenchenko, V.M., Weisskopf, M.C., & Grindlay. J. 1982, ApJ (Letters), 255, L45
- Crawford et al. (2001) Crawford, F., Gaensler, B. M., Kaspi, V. M., Manchester, R. N., Camilo, F., Lyne, A. G., & Pivovaroff, M. J. 2001, ApJ, 554, 152
- Crawford et al. (2002) Crawford, F., Pivovaroff, M. J., Kaspi, V. M., & Manchester, R. N. 2002, in Neutron Stars in Supernova Remnants, ASP Conference Series, Vol. 271, held in Boston, MA, USA, 14-17 August 2001. Ed. P. O. Slane and B. M. Gaensler (San Francisco), 37
- Danziger & Leibowitz (1985) Danziger, I. J., & Leibowitz, E. M. 1985, MNRAS, 216, 365
- Decourchelle (2004) Decourchelle, A. 2004, New Astronomy Review, 48, 75
- Decourchelle et al. (2000) Decourchelle, A., Ellison, D. C., & Ballet, J. 2000, ApJ (Letters), 543, L57
- Decourchelle et al. (2001) Decourchelle, A., Sauvageot, J. L., Audard, M., Aschenbach, B., Sembay, S., Rothenflug, R., Ballet, J., Stadlbauer, T., & West, R. G. 2001, A&A, 365, L218
- De Luca et al. (2004) De Luca, A., Mereghetti, S., Caraveo, P. A., Moroni, M., Mignani, R. P., & Bignami, G. F. 2004, A&A, 418, 625
- DeLaney & Rudnick (2003) DeLaney, T., & Rudnick, L. 2003, ApJ, 589, 818
- DeLaney et al. (2004) DeLaney, T., Rudnick, L., Fesen, R. A., Jones, T. W., Petre, R., & Morse, J. A. 2004, ApJ, 613, 343
- Dopita et al. (1981) Dopita, M. A., Tuohy, I. R., & Mathewson, D. S. 1981, ApJ, 248, L105
- Flanagan et al. (2004) Flanagan, K. A., Canizares, C. R., Dewey, D., Houck, J. C., Fredericks, A. C., Schattenburg, M. L., Markert, T. H., & Davis, D. S. 2004, ApJ, 605, 230
- Gaensler, Bock, &Stappers (2000) Gaensler, B. M., Bock, D. C.-J., & Stappers, B. W. 2000, ApJ (Letters), 537, L35
- Gaensler et al. (2001) Gaensler, B. M., Slane, P. O., Gotthelf, E. V., & Vasisht, G. 2001, ApJ, 59, 963
- Gaensler et al. (2002) Gaensler, B. M., Arons, J., Kaspi, V. M., Pivovaroff, M. J., Kawai, N., & Tamura, K. 2002, ApJ, 569, 878
- Gaensler et al. (2003) Gaensler, B. M., Hendrick, S. P., Reynolds, S. P., & Borkowski, K. J. 2003, ApJ (Letters), 594, L111
- Gaensler et al. (2004) Gaensler, B. M., van der Swaluw, E., Camilo, F., Kaspi, V. M., Baganoff, F. K., Yusef-Zadeh, F., & Manchester, R. N. 2004, ApJ, 616, 383
- Gaetz et al. (2000) Gaetz, T. J., Butt, Y. M., Edgar, R. J., Eriksen, K. A., Plucinsky, P. P., Schlegel, E. M., & Smith R. K. 2000, ApJ, 534, L47
- Garmire et al. (2000) Garmire, G. P., Pavlov, G. G., Garmire, A. B., & Zavlin, V. E. 2000, IAU Circ., 7350, 2
- Ghavamian, Hughes, and Williams (2005) Ghavamian, P., Hughes, J. P., and Williams, T. B. 2005, ApJ, in press (astro-ph/0509309)
- Ghavamian et al. (2003) Ghavamian, P., Rakowski, C. E., Hughes, J. P., and Williams, T. B. 2003, ApJ, 590, 833
- Ghavamian et al. (2001) Ghavamian, P., Raymond, J., Smith, R. C., & Hartigan, P. 2001, ApJ, 547, 995
- Golden, Shearer & Beskin (1985) Golden, A., Shearer, A. & Beskin, G.M. 2000, ApJ, 535, 373
- Gonzalez & Safi-Harb (2003) Gonzalez, M., & Safi-Harb, S. 2003, ApJ (Letters), 591, 143
- Gonzalez & Safi-Harb (2005) Gonzalez, M. & Safi-Harb, S. 2005, ApJ, 619, 856
- Gotthelf, Petre, & Vasisht (1999) Gotthelf, E. V., Petre, R., & Vasisht, G. 1999, ApJ (Letters), 514, L107
- Gotthelf & Wang (2000) Gotthelf, E. V., & Wang, Q. D. 2000, ApJ (Letters), 532, L117
- Gotthelf et al. (2001) Gotthelf, E. V., Koralesky, B., Rudnick, L., Jones, T. W., Hwang, U., & Petre, R. 2001, ApJ, 552, L39
- Greiveldinger & Aschenbach (1999) Greiveldinger, C., & Aschenbach, B. 1999, ApJ, 510, 305
- Gvaramadze & Vikhlinin (2003) Gvaramadze, V. V., & Vikhlinin, A. A. 2003, A&A, 401, 625
- Hailey & Mori (2002) Hailey, C. J. & Mori, K. 2002, ApJ (Letters), 578, L133
- Hamilton et al. (1986) Hamilton, A. J. S., Sarazin, C. L., & Szymkowiak, A. E. 1986a, ApJ, 300, 698
- Hamilton et al. (1986) Hamilton, A. J. S., Sarazin, C. L., & Szymkowiak, A. E. 1986b, ApJ, 300, 713
- Halpern et al. (2004) Halpern, J. P., Gotthelf, E. V., Camilo, F., Helfand, D. J., & Ransom, S. M. 2004, ApJ, 612, 398
- Harrus and Slane (1999) Harrus, I. M. & Slane, P. O. 1999, ApJ, 516, 811
- Hayashi et al. (1994) Hayashi, I., Koyama, K., Masanobu, O., Miyata, E., Tsunemi, H., Hughes, J. P., & Petre, R. 1994, PASJ, 46, L121
- Helfand & Becker (1984) Helfand, D. J. & Becker, R. H. 1984, Nature, 307, 215
- Helfand, Gotthelf and Halpern (2001) Helfand, D. J., Gotthelf, E. V., & Halpern, J. P. 2001, ApJ, 556, 380
- Hendrick, Borkowski, and Reynolds (2003) Hendrick, S. P., Borkowski, K. J., & Reynolds, S. P. 2003, ApJ, 593, 370
- Hendrick, Reynolds, and Borkowski (2005) Hendrick, S. P., Reynolds, S. P., & Borkowski, K. J. 2005, ApJ (Letters), 622, L117
- Hester et al. (1995) Hester, J.J., Scowen, P. A., Sankrit, R., Burrows, C.J., Gallagher, J.S., III, Holtzman, J.A., Watson, A., Trauger, J.T., Ballester, G.E., Casertano, S., Clarke, J.T., Crisp, D., Evans, R.W., Griffiths, R.E., Hoessel, J.G., Krist, J., Lynds, R., Mould, J.R., O’Neil, E.J.,Jr., Stapelfeldt, K.R., & Westphal, J.A. 1995, ApJ, 448, 240
- Hester et al. (2002) Hester, J. J., Mori, K., Burrows, D., Gallagher, J. S., Graham, J. R., Halverson, M., Kader, A., Michel, F. C., & Scowen, P. 2002, ApJ (Letters), 577, L49
- Heyl and Hernquist (2002) Heyl, J. S., & Hernquist, L. 2002, ApJ, 567, 510
- Hickson & van den Bergh (1990) Hickson, P. & van den Bergh, S. 1990, ApJ, 365, 224
- Hughes (2000) Hughes, J. P. 2000, ApJ (Letters), 545, L53
- Hughes et al. (1995) Hughes, J. P., Hayashi, I., Helfand, D., Hwang, U., Itoh, M., Kirshner, R., Koyama, K., Markert, T., Tsunemi, H., & Woo, J. 1995, ApJ (Letters), 444, L81
- Hughes et al. (2000b) Hughes, J. P., Rakowski, C. E., & Decourchelle, A. 2000b, ApJ (Letters), 543, L61
- Hughes et al. (2000a) Hughes, J. P., Rakowski, C. E., Burrows, D. N., & Slane, P. O. 2000a, ApJ (Letters), 528, L109
- Hughes et al. (2001) Hughes, J. P., Slane, P. O., Burrows, D. N., Garmire, G., Nousek, J. A., Olbert, C. M., & Keohane, J. W. 2001, ApJ (Letters), 559, L153
- Hughes et al. (2003a) Hughes, J. P., Ghavamian, P., Rakowski, C. E., & Slane, P. O. 2003a, ApJ (Letters), 582, L95
- Hughes et al. (2003b) Hughes, J. P., Slane, P. O., Park, S., Roming, P. W. A., & Burrows, D. N. 2003b, ApJ (Letters), 591, L139
- Hughes, et al. (2005b) Hughes, J. P., et al. 2005b, ApJ, in preparation
- Hughes, Warren, & Badenes (2005) Hughes, J. P., Warren, J. S., & Badenes, C. 2005a, ApJ, in preparation
- Hui & Becker (2005) Hui, C.Y. & Becker, W. 2005, submitted to A&A, astro-ph/0508655
- Hulleman et al. (2001) Hulleman, F., Tennant, A. F., van Kerkwijk, M. H., Kulkarni, S. R., Kouveliotou, C., & Patel, S. K. 2001, ApJ (Letters), 563, L49
- Hwang & Gotthelf (1997) Hwang, U., & Gotthelf, E. V. 1997, ApJ, 475, 665
- Hwang et al. (2004) Hwang, U., et al. 2004, ApJ (Letters), 615, L117
- Hwang et al. (2000) Hwang, U., Holt, S., & Petre, R. 2000, ApJ (Letters), 537, L119
- Hwang et al. (2001) Hwang, U., Szymkowiak, A. E., Petre, R., & Holt, S. S. 2001, ApJ (Letters), 560, L175
- Hwang et al. (2002) Hwang, U., Decourchelle, A., Holt, S. S., & Petre, R. 2002, ApJ, 581, 1101
- Hwang & Laming (2003) Hwang, U., & Laming, J. M. 2003, ApJ, 597, 362
- Iwamoto et al. (1999) Iwamoto, K., Brachwitz, F., Nomoto, K., Kishimoto, N., Umeda, H., Hix, W. R., & Thielemann, F.-K. 1999, ApJ (Supplement), 125, 439
- Kaaret et al. (2001) Kaaret, P., Marshall, H. L., Aldcroft, T. L., Graessle, D. E., Karovska, M., Murray, S. S., Rots, A. H., Schulz, N. S., & Seward, F. D. 2001, ApJ, 546, 1159
- Kaplan et al. (2004) Kaplan, D. L., Frail, D. A., Gaensler, B. M., Gotthelf, E. V., Kulkarni, S. R., Slane, P. O., & Nechita, A. 2004, ApJ (Supplement), 153, 269
- Kargaltsev et al. (2002) Kargaltsev, O., Pavlov, G. G., Sanwal, D., & Garmire, G. P. 2002, ApJ, 580, 1060
- Kaspi et al. (1996) Kaspi, V. M., Manchester, R. N., Johnston, S., Lyne, A. G., & D’Amico, N. 1996, AJ, 111, 2028
- Katsuda & Tsunem (2005) Katsuda, S., & Tsunem, H. 2005, PASJ, 57, 621
- Kennel & Coroniti (1984) Kennel, C.F., & Coroniti, F.V. 1984, ApJ, 283, 694
- Kong et al. (2004) Kong, A. K. H., Sjouwerman, L. O., & Williams, B. F. 2004, AJ, 128, 2783
- Koyama et al. (1995) Koyama, K., Petre, R., Gotthelf, E. V., Hwang, U., Matsuura, M., Ozaki, M., & Holt, S. S. 1995, Nature, 378, 255
- Koyama et al. (1997) Koyama, K., Kinugasa, K., Matsuzaki, K., Nishiuchi, M., Sugizaki, M., Torii, K., Yamauchi, S., & Aschenbach, B. 1997, PASJ, 49, L7
- Kulkarni et al. (1988) Kulkarni, S. R., Clifton, T. C., Backer, D. C., Foster, R. S., & Fruchter, A. S. 1988, Nature, 331, 50
- Kulkarni et al. (2003) Kulkarni, S. R., Kaplan, D. L., Marshall, H. L., Frail, D. A., Murakami, T., & Yonetoku, D. 2003, ApJ, 585, 948
- Laming & Hwang (2003) Laming, J. M., & Hwang, U. 2003, ApJ, 597, 347
- Lazendic et al. (2003) Lazendic, J. S., Slane, P. O., Gaensler, B. M., Plucinsky, P. P., Hughes, J. P., Galloway, D. K., & Crawford, F. 2003, ApJ (Letters), 593, L27
- Lazendic et al. (2004) Lazendic, J. S., Slane, P. O., Gaensler, B. M., Reynolds, S. P., Plucinsky, P. P., & Hughes, J. P. 2004, ApJ, 602, 271
- Lewis et al. (2003) Lewis, K. T., Burrows, D. N., Hughes, J. P., Slane, P. O., Garmire, G. P.,& Nousek, J. A. 2003, ApJ, 582, 770
- Li, Lu, and Li (2005) Li, X. H., Lu, F. J., & Li, T. P. 2005, ApJ, 628, 931
- Long et al. (2003) Long, K. S., Reynolds, S. P., Raymond, J. C., Winkler, P. F., Dyer, K. K., & Petre, R. 2003, ApJ, 586, 1162
- Lu et al. (2002) Lu, F. J., Wang, Q. D., Aschenbach, B., Durouchoux, P., & Song, L. M. 2002, ApJ (Letters), 568, L49
- Markert et al. (1983) Markert, T. H., Canizares, C. R., Clark, G. W., & Winkler, P. F. 1983, ApJ, 268, 13
- Marshall et al. (1998) Marshall, F. E., Gotthelf, E. V., Zhang, W., Middleditch, J., & Wang, Q. D. 1998, ApJ (Letters),499, L179
- Massaro et al. (2000) Massaro, E., Cusumano, G., Litterio, M., & Mineo, T. 2000, A&A,361, 695
- Mereghetti, Bignmai, & Caraveo (1996) Mereghetti, S., Bignami, G. F., & Caraveo, P. A. 1996, ApJ, 464, 842
- Mereghetti et al. (2002) Mereghetti, S., De Luca, A., Caraveo, P. A., Becker, W., Mignani, R., & Bignami, G. F. 2002, ApJ, 581, 1280
- Miyata et al. (2001) Miyata, E., Tsunemi, H., Aschenbach, B., & Mori, K. 2001, ApJ (Letters), 559, L45
- Michael et al. (2002) Michael, E., Zhekov, S., McCray, R., Hwang, U., Burrows, D. N., Park, S., Garmire, G. P., Holt, S. S., & Hasinger, G. 2002, ApJ, 574, 166
- Moon et al. (2004) Moon, D.-S., Lee, J.-J., Eikenberry, S. S., Koo, B.-C., Chatterjee, S., Kaplan, D. L., Hester, J. J., Cordes, J. M., Gallant, Y. A., & Koch-Miramond, L. 2004, ApJ (Letters), 610, L33
- Mori et al. (2004) Mori, K., Burrows, D, N., Hester, J. J., Pavlov, G. G., Shibata, S., & Tsunemi, H. 2004, ApJ, 609, 186
- Mori, Chonko, & Hailey (2005) Mori, K., Chonko, J. C., & Hailey, C. J. 2005, ApJ, 631, 1082
- Morii et al. (2003) Morii, M., Sato, R., Kataoka, J., & Kawai, N. 2003, Publications of the Astronomical Society of Japan, 55, L45
- Murray et al. (2002a) Murray, S. S., Ransom, S. M., Juda, M., Hwang, U., & Holt, Stephen S. 2002a, ApJ, 566, 1039
- Murray et al. (2002b) Murray, S. S., Slane, P. O., Seward, F. D., Ransom, S. M., & Gaensler, B. M. 2002b, ApJ, 568, 226
- Olbert et al. (2001) Olbert, C. M., Clearfield, C. R., Williams, N. E., Keohane, J. W., & Frail, D. A. 2001, ApJ (Letters), 554, L205
- Olbert et al. (2003) Olbert, C. M., Keohane, J. W., Arnaud, K. A., Dyer, K. K., Reynolds, S. P., & Safi-Harb, S. 2003, ApJ (Letters), 592, L45
- Olbert, Keohane, and Gotthelf (2003) Olbert, C. M., Keohane, J. W., & Gotthelf, E. V. 2003, BAAS, 203, 39.07
- Park et al. (2002) Park, S., Roming, P. W. A., Hughes, J. P., Slane, P. O., Burrows, D. N., Garmire, G. P., & Nousek, J. A. 2002, ApJ (Letters), 564, L39
- Park et al. (2003a) Park, S., Burrows, D. N., Garmire, G. P., Nousek, J. A., Hughes, J. P., & Williams, R. M. 2003a, ApJ, 586, 210
- Park et al. (2003b) Park, S., Hughes, J. P., Burrows, D. N., Slane, P. O., Nousek, J. A., & Garmire, G. P. 2003b, ApJ (Letters), 598, L95
- Park et al. (2004a) Park, S., Hughes, J. P., Slane, P. O., Burrows, D. N., Roming, P. W. A., Nousek, J. A., & Garmire, G. P. 2004a, ApJ (Letters), 602, L33
- Park et al. (2004b) Park, S., Zhekov, S. A., Burrows, D. N., Garmire, G. P., & McCray, R. 2004b, ApJ, 610, 275
- Park et al. (2005) Park, S., Zhekov, S. A., Burrows, D. N., Garmire, G. P., & McCray, D. 2005, Advances in Space Research, 35, 991
- Patel et al. (2001) Patel, S. K., Kouveliotou, C., Woods, P. M., Tennant, A. F., Weisskopf, M. C., Finger, M. H., Göğüş, E., van der Klis, M., Belloni, T. 2001, ApJ (Letters), 563, L45
- Patel et al. (2003) Patel, S. K., Kouveliotou, C., Woods, P. M., Tennant, A. F., Weisskopf, M. C., Finger, M. H., Wilson, C. A., Göğüş, E., van der Klis, M., & Belloni, T. 2003, ApJ, 587, 367
- Pavlov et al. (2000) Pavlov, G. G., Zavlin, V. E., Aschenbach, B., Trümper, J., & Sanwal, D. 2000, ApJ (Letters), 531, L53
- Pavlov et al. (2001) Pavlov, G. G., Sanwal, D., Kızıltan, B., & Garmire, G. P. 2001, ApJ (Letters), 559, L131
- Pavlov et al. (2002) Pavlov, G. G., Zavlin, V. E., Sanwal, D., & Trümper, J. 2002, ApJ (Letters), 569, L95
- (140) Pavlov, G. G., Sanwal, D., Garmire, G. P., & Zavlin, V. E. 2002a, in Neutron Stars in Supernova Remnants, ASP Conference Series, 271, held in Boston, MA, USA, 14-17 August 2001. Eds. P. O. Slane & B. M. Gaensler. San Francisco: ASP, 247
- Pavlov, Zavlin, & Sanwal (2002) Pavlov, G. G., Zavlin, V. E., & Sanwal, D. 2002, Proceedings of the 270. WE-Heraeus Seminar on Neutron Stars, Pulsars, and Supernova Remnants. MPE Report 278. Ed. W. Becker, H. Lesch, and J. Trümper. Garching bei München: Max-Plank-Institut für extraterrestrische Physik, 273
- Pavlov et al. (2003) Pavlov, G. G.,Teter, M. A., Kargalstev, O., & Sanwal, D., 2003, ApJ, 591, 1171
- Peterson et al. (1978) Peterson, B.A., Murdin, P., Wallace, P., Manchester, R.N., Penny, A.J., Jorden, A., Hartley, K.F. & King, D. 1978, Nature, 276, 475.
- Petre et al. (1982) Petre, R., Kriss, G. A., Winkler, P. F., & Canizares, C. R. 1982, ApJ, 258, 22
- Pfeffermann and Aschenbach (1996) Pfeffermann, E. & Aschenbach, B. 1996, in Röntgenstrahlung from the Universe, eds. H.U. Zimmermann, J. Trümper, & and H. Yorke (MPE Report 263, Garching: MPE) 267
- Pohl et al. (2005) Pohl, M., Yan, H., & Lazarian, A. 2005, ApJ (Letters), 626, L101
- Predehl & Kulkarni (1995) Predehl, P., & Kulkarni, S. R. 1995, A&A, 294, L29
- Pravdo, Angelini, & Harding (1977) Pravdo, S. H., Angelini, L., & Harding, A. K. 1997, ApJ, 491, 808
- Rasmussen et al. (2001) Rasmussen, A. P., Behar, E., Kahn, S. M., den Herder, J. W., & van der Heyden, K. 2001, A&A, 365, L231
- Rakowski et al. (2003) Rakowski, C. E., Ghavamian, P., & Hughes, J. P. 2003, ApJ, 590, 846
- Rakowski (2005) Rakowski, C. E. 2005, Advances in Space Research, 35, 1017
- Rees & Gunn (1974) Rees, M. J., & Gunn, J. E. 1974, MNRAS, 167, 1
- Rest et al. (2005) Rest, A., Suntzeff, N. B., Olsen, K., Prieto, J. L., Smith, R. C., Welch, D. L., Becker, A., Bergmann, M., Clocchiatti, A., Cook, K., Garg, A., Huber, M., Miknaitis, G., Minniti, D., Nikolaev, S., & Stubbs, C. 2005, Nature, in press (astro-ph/0510738)
- Reynoso et al. (1997) Reynoso, E. M., Moffett, D. A., Goss, W. M., Dubner, G. M., Dickel, J. R., Reynolds, S. P., & Giacani, E. B. 1997, ApJ, 491, 816
- Rho et al. (2002) Rho, J., Dyer, K. K., Borkowski, K. J., & Reynolds, S. P. 2002, ApJ, 581, 1116
- Rothschild, Kulkarni, & Lingenfelter (1994) Rothschild, R. E., Kulkarni, S. R., & Lingenfelter, R. E. 1994, Nature,368, 432
- Russell & Dopita (1990) Russell, S. C., & Dopita, M. A. 1990, ApJ (Supplement), 74, 93
- Sanwal et al. (2002) Sanwal, D., Pavlov, G. G., Zavlin, V. E., & Teter, M. A. 2002, ApJ, 574, L61
- (159) Sanwal, D., Pavlov, G. G., & Zavlin, V. E. 2004, BAAS, HEAD meeting #8, 11.06
- (160) Sanwal, D., Pavlov, G. G., & Zavlin, V. E. 2005, in preparation
- Safi-Harb et al. (2005) Safi-Harb, S., Dubner, G., Petre, R., Holt, S. S., & Durouchoux, P. 2005, ApJ, 618, 321
- Schmidt, Angel, & Beaver (1979) Schmidt, G. D., Angel, J. R. P., & Beaver, E. A. 1979, ApJ, 227, 113
- Schwartz et al. (2000) Schwartz, D. A., Marshall, H. L., Lovell, J. E. J., Piner, B. G., Tingay, S. J., Birkinshaw, M., Chartas, G., Elvis, M., Feigelson, E. D., Ghosh, K. K., Harris, D. E., Hirabayashi, H., Hooper, E. J., Jauncey, D. L., Lanzetta, K. M., Mathur, S., Preston, R. A., Tucker, W. H., Virani, S., Wilkes, B. & Worrall, D. M. 2000, ApJ, 540, 69
- Sedov (1959) Sedov, L. I. 1959, Similarity and Dimensional Methods in Mechanics, (New York: Academic Press)
- Serafimovich et al. (2004) Serafimovich, N. I., Shibanov, Yu. A., Lundqvist, P., & Sollerman, J. 2004, A&A, 425, 1041
- Seward, Harnden, & Helfand (1984) Seward, F. D., Harnden, F. R., Jr., & Helfand, D. J. 1984, ApJ (Letters), 287, L19
- Seward, Schmidt,& Slane (1995) Seward, F. D., Schmidt, B., & Slane, P. 1995, ApJ, 453,.284
- Seward & Mitchell (1981) Seward, F. D., & Mitchell, M. 1981, ApJ, 243, 736
- Shu (1992) Shu, F. H. 1992, The Physics of Astrophysics, Volume II, Gas Dynamics, (Mill Valley: University Science Books)
- Slane et al. (1999) Slane, P., Gaensler, B. M., Dame, T. M., Hughes, J. P., Plucinsky, P. P., & Green, A. 1999, ApJ, 525, 357
- Slane et al. (2001) Slane, P., Hughes, J. P., Edgar, R. J., Plucinsky, P. P., Miyata, E., Tsunemi, H., & Aschenbach, B. 2001, ApJ, 548, 814
- Slane (2002) Slane, P. 2002, In Neutron Stars in Supernova Remnants, ASP Conference Series, Vol. 271, held in Boston, MA, USA, 14-17 August 2001. Edited by Patrick O. Slane and Bryan M. Gaensler. San Francisco: ASP, 165
- Slane, Helfand, & Murray (2002) Slane, P. O., Helfand, D. J., & Murray, S. S. 2002, ApJ, 571, L45
- Slane et al. (2004b) Slane, P., Helfand, D. J., van der Swaluw, E., & Murray, S. S. 2004b, ApJ, 616, 403
- Slane et al. (2004a) Slane, P., Zimmerman, E. R., Hughes, J. P., Seward, F. D., Gaensler, B. M., & Clarke, M. J. 2004a, ApJ, 601, 1045
- Slane (2005) Slane, P. 2005, Advances in Space Research, 35, 1092
- Stephenson & Green (2002) Stephenson, F.R., & Green, D.A. 2002, Historical Supernovae and their Remnants (Oxford: Clarendon)
- Tananbaum (1999) Tananbaum, H. 1999, IAU Circ. 7246
- Taylor (1950) Taylor, G. 1950, Royal Society of London Proceedings Series A, 201, 159.
- Tennant et al. (2001) Tennant, A. F., Becker, W., Juda, M., Elsner, R. F., Kolodziejczak, J. J., Murray, S. S., O’Dell, S. L., Paerels, F., Swartz, D. A., Shibazaki, N., & Weisskopf, M. C. 2001, ApJ (letters), 554, L173
- Truelove & McKee (1999) Truelove, J. K., & McKee, C. F. 1999, ApJ (Supplement), 120, 299
- Tuohy and Dopita (1983) Tuohy, I. R., & Dopita, M. A. 1983, ApJ (Letters), 268, L11
- Tuohy and Garmire (1980) Tuohy, I. & Garmire, G. 1980, ApJ (Letters), L107
- Tuohy et al. (1982) Tuohy, I. R., Dopita, M. A., Mathewson, D. S., Long, K. S., & Helfand, D. J. 1982, ApJ, 261, 473
- Uchiyama et al. (2003) Uchiyama, Y., Aharonian, F. A., & Takahashi, T. 2003, A&A, 400, 567
- Vancura et al. (1992) Vancura, O., Blair, W. P., Long, K. S., & Raymond, J. C. 1992, ApJ, 394, 158
- Vancura et al. (1995) Vancura, O., Gorenstein, P., & Hughes, J. P. 1995, ApJ, 441, 680
- van der Heyden et al. (2002) van der Heyden, K. J., Behar, E., Vink, J., Rasmussen, A. P., Kaastra, J. S., Bleeker, J. A. M., Kahn, S. M., & Mewe, R. 2002, A&A, 392, 955
- Vink & Laming (2003) Vink, J. & Laming, J. M. 2003, ApJ, 584, 758
- Vink et al. (2003) Vink, J., Laming, J. M., Gu, M. F., Rasmussen, A., Kaastra, J. S. 2003, ApJ Letters, 587, L31
- Völk et al. (2005) Völk, H. J., Berezhko, E. G., & Ksenofontov, L. T. 2005, A&A, 433, 229
- Wachter et al. (2004) Wachter, S., Patel, S. K., Kouveliotou, C., Bouchet, P., Özel, F., Tennant, A. F., Woods, P. M., Hurley, K., Becker, W., & Slane, P. 2004, ApJ, 615, 887
- Wang et al. (2001) Wang, Q. D., Gotthelf, E. V., Chu, Y.-H., & Dickel, J. R. 2001, ApJ, 559, 275
- Warren & Hughes (2004) Warren, J. S., & Hughes, J. P. 2004, ApJ, 608, 261
- Warren et al. (2003) Warren, J. S., Hughes, J. P., & Slane, P. O. 2003, ApJ, 583, 260
- Warren et al. (2005) Warren, J. S., Hughes, J. P., Badenes, C., Ghavamian, P., McKee, C. F., Moffett, D., Plucinsky, P. P., Rakowski, C., Reynoso, E., and Slane, P. 2005, ApJ, 634, 376 (astro-ph/0507478)
- Weisskopf et al. (2000) Weisskopf, M.C., Hester, J. J., Tennant, A. F., Elsner, R. F., Schulz, N. S., Marshall, H. L., Karovska, M., Nichols, J. S., Swartz, D. A., Kolodziejczak, J. J., O’Dell, S. L. 2000, ApJ, 536, 81
- Weisskopf et al. (2003) Weisskopf, M. C., Aldcroft, T. L., Bautz, M., Cameron, R. A., Dewey, D., Drake, J. J., Grant, C. E., Marshall, H. L., Murray, S. S. 2003, Experimental Astronomy, 16, 1
- Weisskopf et al. (2004) Weisskopf, M.C., O’Dell, S. L., Paerels, F., Elsner, R. F., Becker, W., Tennant, A. F., Swartz, D. A. 2004, ApJ, 601, 1050
- Weisskopf et al. (2005) Weisskopf, M.,C., Aldcroft, T.L., Cameron, R.A., Gandhi, P., Foellmi, C., Elsner, R.F., Paterl, S.K., & O’Dell, S.L. 2005, ApJ, accepted.
- Willingale et al. (2001) Willingale, R., Aschenbach, B., Griffiths, R. G., Sembay, S., Warwick, R. S., Becker, W., Abbey, A. F., & Bonnet-Bidaud, J.-M. 2001, A&A, 365, L212
- Willingale et al. (2002) Willingale, R., Bleeker, J. A. M., van der Heyden, K. J., Kaastra, J. S., & Vink, J. 2002, A&A, 381, 1039
- Wilms, Allen, & McCray (2000) Wilms, J., Allen, A., & McCray, R. 2000, ApJ, 542, 914
- Wu et al. (1983) Wu, C.-C., Leventhal, M., Sarazin, C. L., & Gull, T. R. 1983, ApJ (Letters), 269, 5
- Yakovlev et al. (2002) Yakovlev, D. G., Kaminker, A. D., Haensel, P., & Gnedin, O. Y. 2002, A&A, 389, L24
- Yatsu et al. (2005) Yatsu, Y., Kataoka, J., Kawai, N., Tamura, K., & Brinkmann, W. 2005, Advances in Space Research, 35, 1066
- Zavlin et al. (2000) Zavlin, V. E., Pavlov, G. G., Sanwal, D., & Trümper, J. 2000, ApJ (Letters), 540, L25
- Zavlin, Pavlov and Sanwal (2004) Zavlin, V. E., Pavlov, G. G., Sanwal, D. 2004, ApJ, 606, 444
- Zavlin (2005) Zavlin, V. 2005, private communication