Dust in Resonant Extrasolar Kuiper Belts — Grain Size and Wavelength Dependence of Disk Structure
Abstract
This paper considers the distribution of dust which originates in the break-up of planetesimals that are trapped in resonance with a planet. The effect of radiation pressure on small dust grains causes their orbits and so their spatial distribution to be significantly different to that of the parent planetesimals which previous work has shown to be clumpy. It is shown that there are three distinct grain populations: (I) large grains ( a few mm) have the same clumpy resonant distribution as the planetesimals; (II) moderate sized grains (a few m to a few mm) are no longer in resonance and have an axisymmetric distribution; (III) small grains ( a few m) are blown out of the system by radiation pressure immediately on creation and so have a density distribution which falls off as , however the structure of these grains can be further divided into two subclasses: (IIIa) grains produced in the destruction of population I grains that exhibit trailing spiral structure which emanates from the resonant clumps; and (IIIb) grains produced from population II grains that have an axisymmetric distribution. Since observations in different wavebands are sensitive to different sized dust grains, multi-wavelength imaging of debris disks provides a valuable observational test of models which explain structure seen in sub-mm observations as due to resonant trapping of planetesimals. For example, a disk with a collisional cascade dust size distribution with no blow-out grains would appear clumpy in the sub-mm (which samples population I grains), and smooth at mid- to far-IR wavelengths (which sample population II grains). The wavelength of transition from clumpy to smooth structure is indicative of the mass of the perturbing planet. The size distribution of Vega’s disk is modeled in the light of the recent Spitzer observations showing that collisions with the large quantities of population III grains seen in the mid- to far-IR may be responsible for the low levels of population II grains in this system. The origin of these population III grains must be in the destruction of the grains seen in the sub-mm images, and so at high resolution and sensitivity the far-IR and mid-IR structure of the Vega disk is predicted to include spiral structure emanating from the sub-mm clumps. Such structure could be detected with MIRI on the JWST and, if so, would confirm the presence of a planet at 65 AU in the Vega disk as well as determine the direction of its orbit.
Subject headings:
celestial mechanics — circumstellar matter — planetary systems: formation — stars: individual (Vega)1. Introduction
Debris disks are the dust disks that are fed by the collisional grinding down of extrasolar planetesimal belts that are analogous to the Kuiper Belt in the Solar System (Backman & Paresce 1993; Wyatt et al. 2003). One of the most defining features of the debris disks that have been imaged is that most of these disks are not smooth, but clumpy. Such clumps are seen in sub-mm and mm images of the dust disks around Vega (Holland et al. 1998; Koerner, Sargent & Ostroff 2001; Wilner et al. 2002), Eridani (Greaves et al. 1998; Greaves et al. 2005) and Fomalhaut (Holland et al. 2003), as well as in optical and mid-IR images of Pictoris (Kalas et al. 2000; Telesco et al. 2005).
The origin of these clumps has been widely debated. One possible interpretation is that the clumps are in fact unrelated, and are the chance superposition of background objects. However, this has been ruled out on statistical grounds based on number counts of such objects (e.g., Holland et al. 1998; Telesco et al. 2005). Another possibility that has been considered is that the clumps were created relatively recently in collisions between large planetesimals; features in the structure of the zodiacal cloud have been interpreted in this way (Dermott et al. 2002; Nesvorný et al. 2003). However, the high mass of material seen in the clumps in disks imaged at long wavelengths indicates that such an event would have to have involved two planetesimals at least the size of Pluto, which given the expected frequency of such events again rules out this interpretation on statistical grounds (Wyatt & Dent 2002; see also Kenyon & Bromley 2005). This mechanism remains a possibility for clumps seen at shorter wavelengths, for which smaller colliding planetesimals are required to create detectable clumps, for clumps seen at small orbital radii, and for those seen toward relatively young systems like Pictoris (Telesco et al. 2005; Kenyon & Bromley 2005).
The favoured interpretation for the clumps seen in sub-mm and mm images is that they are associated with material that is trapped in resonance with a planet orbiting in the disk. Two classes of model invoke planetary resonances to explain the clumps, and they differ in the mechanism by which material ends up in the resonances. In one model, dust migrates inward due to Poynting-Robertson (P-R) drag and upon encountering a resonance, resonant forces temporarily halt the migration causing a concentration of dust in the resonances. This is the mechanism by which the Earth’s clumpy resonant ring is thought to have formed (Dermott et al. 1994). The clumpy structures of the disks of Vega, Eridani and Fomalhaut, have all been modeled in this way indicating the presence of planets more massive than Saturn oribitng at several tens of AU from these stars (Ozernoy et al. 2000; Wilner et al. 2002; Quillen & Thorndike 2002; Deller & Maddison 2005). However, these models suffer from the problem that, unlike dust in the zodiacal cloud, inward migration due to P-R drag is not significant in these systems because their disks are so dense that collisions occur on much shorter timescales. This means planetesimals are ground into dust fine enough to be removed by radiation pressure before P-R drag has a chance to act (Wyatt 2005). This is not the case for dust coming from the asteroid belt which is much less dense meaning that collisions are much less frequent.
In the other model, the parent planetesimals of the dust were trapped in resonance with a planet which migrated outward early in the history of the system, in the same way Kuiper Belt objects were trapped in resonance with Neptune when it migrated outward (e.g. Malhotra 1995; Levison & Morbidelli 2003). Such migration could have been caused by angular momentum exchange when the planetary system scattered the residual planetsimal disk (Fernandez & Ip 1984; Malhotra 1993; Hahn & Malhotra 1999; Ida et al. 2000). Wyatt (2003; W03) used numerical simulations to model the dynamical and spatial structure of a planetesimal disk resulting from the outward migration of a planet. W03 also showed how comparing this structure with that seen in sub-mm images of the Vega disk not only explained the observed structure without having to invoke P-R drag, but also allowed constraints to be set on the planet causing the structure, since only a specific range of planet mass and migration rate can cause the observed structure. A Neptune-mass planet which migrated from 40-65 AU over 56 Myr was proposed which resulted in planetesimals being captured predominantly into the planet’s 2:1(u) and 3:2 resonances. One of the limitations of the W03 model though was that the dust seen in the sub-mm images was assumed to have the same distribution as the planetesimals. Small dust grains generally have different orbital parameters to their parent planetesimals because radiation pressure causes them to effectively see a lower mass star than did their parents. This means that the dust distribution may be significantly different to that of the planetesimals.
This paper considers how the distribution of dust arising from a population of planetesimals previously trapped into resonance by a migrating planet differs from that of the planetesimals themselves. The distributions of two different types of grains are treated separately: in §2, numerical simulations are used to consider the distribution of grains that remain gravitationally bound to the star; §3 models the collisional evolution of the disk to determine the distribution of grains that are put on hyperbolic orbits by radiation pressure as soon as they are created. The findings are summarised in §4 which shows how the disk can be divided into three grain populations sorted by grain size, each of which exhibiting a distinct structure. This section also considers which populations will dominate observations in different wavebands and discusses the implications for interpretation of the Vega disk in the light of the recent Spitzer images of its structure (Su et al. 2005). The conclusions are given in §5.
2. Distribution of Bound Grains
Small dust grains are acted on by a radiation force that can be parametrised by a factor which is the ratio of the radiation force to that of stellar gravity (Burns, Lamy, & Soter 1979). The factor is a function of particle diameter with smaller particles having larger values of which for large grains falls off . There are two components to the radiation force: radiation pressure, which is the radial component that means that the particle effectively sees a smaller mass star by a factor ; and Poynting-Robertson (P-R) drag, which is the tangential component that makes the particle’s orbit spiral in toward the star at a rate . While it is included in the following numerical simulations, the P-R drag force is not dominant in causing dust grains to have different distributions to their parent planetesimals. Rather that change in structure is caused by the fact that on creation the dust grains have the same positions as their parents, and similar velocities, but see a smaller mass star. This causes the parameters describing their orbits to be different to those of the parent planetesimal. Dust grains created in the break-up of a planetesimal that had , and for which orbital elements at the time of the collision were , and , move in the same orbital plane as the parent, and , but on orbits with semimajor axes, , eccentricities, , and pericenter orientations, , that are given by (Burns et al. 1979; Wyatt et al. 1999):
| (1) | |||||
| (2) | |||||
| (3) |
Two types of dust grains are created: those (large grains) with that remain on bound orbits; and those (small grains) with that are blown out of the system on hyperbolic orbits as soon as they are created. For the former, the important question to ask is how a particle’s new orbital elements affect its subsequent evolution; i.e., if the parent planetesimal was in a planet’s resonance, is the particle still in resonance, and if so how are the parameters describing the resonant libration affected, which in turn tells us about the spatial distribution of such dust grains (e.g., W03). For the latter, the particles’ subsequent evolution is not so important, since these orbits are hyperbolic. The more important issue is where those dust grains are most often created, and so where their hyperbolic orbits start, and that is an issue which depends on the collision rate of the parent planetesimals. The former bound grains are considered in the remainder of this section, while the latter hyperbolic (blow-out) grains are considered in §3.
2.1. Numerical Technique
To derive the orbital parameters of small dust grains created in the destruction of planetesimals previously trapped in resonance by a migrating planet a three step process was used: (i) first a population of parent planetesimals that were trapped in resonance by a migrating planet was defined; (ii) then the orbital elements of dust particles created in collisions between those planetesimals was worked out; (iii) then the dynamical evolution of those particles was followed to quantify the effect of radiation pressure on their resonance libration parameters. This process was repeated until the libration parameters could be determined for any size of dust grain associated with planetesimals trapped in a planet’s 3:2 and 2:1(u) resonances. The new dust libration parameters were then used to work out the spatial distribution of these grains.
The numerical technique employed in this paper is similar to that of W03. That is, numerical simulations were performed in which the dynamical evolution of 200 massless objects and 1 planet of mass was followed using the RADAU fifteenth order integrator program (Everhart 1985). All bodies are assumed to orbit a star of mass . For some runs the adjustment described in W03 was employed that results in a constant planet migration, ; this adjustment was modified so that the migration rate decreased at a linear rate to zero at the end of a migration. The ”objects” were either planetesimals or dust particles for which their dynamical evolution is also affected by radiation pressure and the P-R drag force characterised by the parameter .
2.1.1 Parent Planetesimal Distribution
To define a population of planetesimals trapped in resonance, runs were performed in which a planet was made to migrate through a disk of 200 planetesimals at a rate starting at but decreasing to 0 after a time . At the start of the integration the planetesimals had eccentricities, , chosen randomly from the range 0 to , and were randomly distributed in semimajor axis between a narrow range and . Their inclinations, , were chosen randomly from the range 0 to rad, and their arguments of periastron, , longitudes of ascending node, , and longitudes, , were each chosen randomly from the range 0 to .
The planet had all of these angles set to zero at the start of the integration, with a semimajor axis . This meant that the planet ended up at a semimajor axis of . The planet’s migration rate was chosen so that all of the planetesimals were trapped in the resonance being studied. Trapping probabilities are a strong function of migration rate, with slower migrations resulting in higher probabilities, and these were derived in W03. Since it was the strongest 3:2 and 2:1(u) resonances that were being studied in this paper, the migration rate was chosen so that it was as high as possible while still trapping all of the planetesimals into the appropriate resonance; slower migrations could have resulted in trapping into higher order resonances. The relationship between and was determined by the requirement that the resonance being studied was in front of the planetesimals at the start of the integration; the location of the resonance is given by:
| (4) |
although the finite width of the resonance also had to be taken into consideration. The width of the initial planetesimal distribution, , was set to ensure that the planetesimals did not encounter the resonance at the same phase, thus biasing the distribution of resonant angles, (W03). The extent of the migration is best described by its impact on the mean semimajor axes and eccentricities of the planetesimal population. Higher eccentricities mean that more migration has taken place by an amount that can be determined from the eccentricity-semimajor axis relation (W03).
2.1.2 Initial Dust Distribution
The initial dust distribution was taken directly from the orbits of the planetesimal population at the end of the run. In general each of these planetesimals would have a different collision rate and so some of the 200 planetesimals could contribute more to the overall dust population, however this effect was not taken into account and 200 dust particles were produced with exactly the same positions and velocities as the parent population. Different sets of runs were then performed for dust particles all of which have the same radiation pressure coefficient, . The initial orbital elements of the dust grains in each set of runs was determined from equations (1)-(3). No further planet migration was assumed when considering the evolution of the dust grains’ orbits.
2.1.3 Dust Orbital Evolution
Even though the parent planetesimals were in resonance with , the dust particles may no longer be in exact resonance for two reasons. First, the location of the resonance has changed because a dust particle moves slower than a planetesimal at the same semimajor axis because it sees a less massive star. Thus to get the same ratio of orbital periods a dust particle must be orbiting at:
| (5) |
Second, the semimajor axis of the particle has changed as described in eq. 1. Taking only terms to first order in eccentricity and , it is possible to show that the particle is at a semimajor axis which is offset from the resonance by a factor
| (6) |
where the term indicates whether the particle was created when the planetesimal was at pericentre () or apocentre () respectively. In other words, smaller particles end up further from resonance by a factor , and particles released at pericentre also end up further from resonance than those released at apocentre. This does not necessarily mean that the particles are no longer in resonance, however, since resonances have finite width.
A particle is said to be in resonance if its resonant argument is librating rather than circulating, where
| (7) |
and libration can be characterised by a sinusoidal oscillation
| (8) |
of period and amplitude , about a centre . Upon creation, the resonant argument of the dust particle is different to that of the parent, since both the pericentres of the orbits, and the longitudes of the particles within those orbits have changed (although in practise the change in pericentre has the larger effect on the change in ). Overall the change in is small unless a particle’s is close to, or larger than the eccentricity of the planetesimal . Since must be non-negligible to cause observable structure (W03), and particles with even moderate values of are found to no longer be in resonance (see later), this effect is not considered further.
It is also worth pointing out that the action of P-R drag is expected to cause the resonant argument of the dust particle to librate about a centre that is slightly offset from (or the appropriate centre for the case of the 2:1 resonance, W03), since this is required for the resonant forces to impart angular momentum to the particle to prevent its inward orbital decay. The new centre can be derived by making the sum of the inward decay due to P-R drag (eq. 23 of Wyatt et al. 1999) and the semimajor axis variation due to resonant forces (eq. 14 of W03) to zero, giving
| (9) |
where and . The parameter is equivalent to the parameter in W03 in that it is the ratio of the dust particle’s migration rate to its orbital velocity, which determines the angle at which the resonance is encountered.111To put the angle into perspective, a particle with at 1 AU from a star would meet the orbital velocity at an incident angle of 0.4 arcsec (and would have ).
To ascertain the impact of radiation pressure on the particles’ resonant arguments, the particles orbits were integrated for a sufficient amount of time for several libration periods to be completed, and so for the libration parameters to be fitted for each particle, and the mean parameters for each population of 200 dust grains to be determined, i.e., , , and . Again the libration periods of the parent planetesimals were derived in W03, and while the periods of the dust grains do differ from that of the parents, this provides a good enough idea to determine the required integration times. Since the oscillation also results in an oscillation of the particles’ semimajor axes, the amplitude of this oscillation was also determined, , as was the mean for the population of planetesimals, .
2.2. Results
| 0.005 | 0.01 | 0.02 | ||
|---|---|---|---|---|

|

|

|

|

|

|

|

|

|

|
2.2.1 3:2 Resonance
| , AU | ||||
|---|---|---|---|---|
| 2.5 | 10 | 78.6 | 0.28 | 0.0001 - 0.004 |
| 2.5 | 10 | 69.0 | 0.20 | 0.0001 - 0.004 |
| 2.5 | 10 | 64.4 | 0.13 | 0.0001 - 0.004 |
| 2.5 | 30 | 78.6 | 0.28 | 0.0001 - 0.005 |
| 2.5 | 100 | 78.6 | 0.28 | 0.0001 - 0.007 |
| 2.5 | 300 | 78.6 | 0.28 | 0.0001 - 0.01 |
| 0.5 | 10 | 78.6 | 0.28 | 0.0001 - 0.006 |
| 1.0 | 10 | 78.6 | 0.28 | 0.0001 - 0.004 |
| 1.5 | 10 | 78.6 | 0.28 | 0.0001 - 0.004 |
| 2.5 | 10 | 39.3 | 0.28 | 0.0001 - 0.006 |
| 2.5 | 10 | 196.5 | 0.28 | 0.0001 - 0.004 |
The parameters used in the runs to characterise the libration parameters of dust grains created in the destruction of planetesimals previously trapped in the 3:2 resonance of a migrating planet are given in Table 1. In this paper, a set of runs means those with the same star, planet and planetesimals parameters, but different values of (corresponding to different sized dust grains). The first result is that for each set of runs, as is increased, all of , , and also increase, while decreases (see Fig. 1). That is, for low (large grains) the dust particles remain in resonance, but one with a libration centre that is further from , and with a higher libration width and range. All of the increases are linear with , although there is a turnover in for large . The runs found that particles remain in resonance as long as . Larger particles (those with higher ) are no longer in resonance and for such grains circulates, i.e., undergoes a monotonic decrease.
| (a) |

|
|---|---|
| (b) |

|
| (c) |

|
Different sets of runs were made varying each of the star, planet and planetesimal parameters in turn to show the way the libration of the dust grains was affected by each of these parameters (e.g., W03). This showed that the displacement of the libration centre from depends on as predicted in equation (9). There is a turnover for high , however the linear portion of the curve can be well fitted by:
| (10) |
where is in units of , and this line is shown on Fig. 2a along with the results of all the runs. Since the libration width is also high for high , the significance or meaning of the turnover is not clear, and may be an artifact of the numerical method e.g., due to deviations from perfect sinusoidal oscillation in this regime.
The increase in libration width could also be parametrised to explain the results of all runs:
| (11) |
and this line is shown on Fig. 2b along with the results of all the runs. In other words, the increased libration width is not dependent on radial distance of the planet from the star, or on the star’s mass except in the ratio of the planet mass to the stellar mass, . The constant in this equation is indicative of the libration width inherent in the planetesimal population (W03). The increased libration range could also be explained by the relation derived in equation (6) with the modification that higher libration ranges result from different planet masses according to:
| (12) |
and this result is represented in Fig. 2c. A libration range above that given in equation (6) is expected if the particle’s new semimajor axis is not the peak in its libration. This is more likely to be the case for higher planet masses, since the libration range is higher for such planets (Murray & Dermott 1999).
The most important relationship in this paper is that given in equation (11), since this can be used to estimate the above which particles fall out of resonance, which occurs when particles have . In other words, grains are still in resonance as long as , where:
| (13) |
Since this corresponds to large grains, the black body approximation can be used to estimate the grain size this corresponds to using the relation in m (assuming a density of kg m-3; Wyatt et al. 1999) to give:
| (14) |
in m. For example, dust grains arising from the destruction of the Plutino population in the Kuiper Belt (objects in 3:2 resonance with Neptune) remain in the resonance as long as they are larger than m.
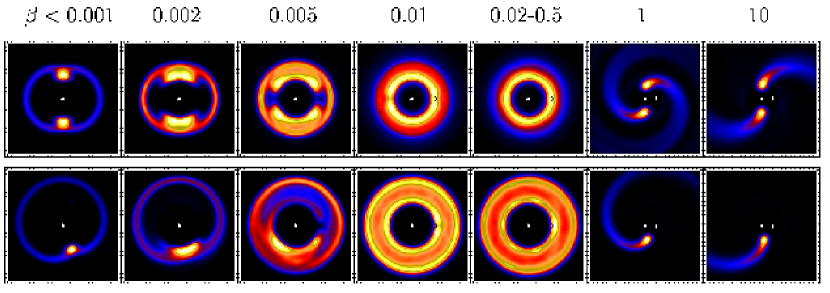 |
Equations (10) and (11) also specify the spatial distribution of dust grains of different sizes, since Fig. 6 of W03, a modified version of which is reproduced here in Fig. 1, showed how the angle determines the orientation of the loopy pattern that a resonant object’s orbit makes in the frame rotating with the planet. For this paper the only important parameter describing the distribution of the resonant arguments of the dust grains is the increased libration width, since one implication of equation (13) is that the offset of the libration centre from is always small: even the smallest grains still in resonance have , so this can be ignored unless the planet is of very low mass and orbiting close to the star (such as dust grains trapped in resonance with the Earth, Dermott et al. 1994). The increased libration width of the orbits of resonant dust grains causes the clumps they make to be azimuthally smeared out. This is illustrated in Fig. 3 which shows the distributions in the frame rotating with the planet of dust grains of different sizes in one set of runs. 222To make these figures, the locations of the dust grains were coadded at all times in the frame rotating with the planet, and the integration was long enough to cover a large number of libration periods so that the structure was independent of the length of the integration (100,000 year integrations are shown in Fig. 3).
Fig. 3 also illustrates how particles that are no longer in resonance have an axisymmetric distribution, and as expected this occurs for particles with (eq. 13). While the particles are not in resonance, the resonant argument is still relevant to this discussion, since the pattern of the particle’s orbit in the frame rotating with the planet is still close to that shown in Fig. 1. The particles’ new semimajor axes mean that there is a monotonic decrease in the value of , which if additional perturbations due to resonant forces are ignored can be estimated to be:
| (15) |
where for the 3:2 resonance. This means that the loopy pattern rotates so that the the clump in front of the planet’s motion approaches the planet (with the other clump away). The timescale on which a non-resonant particle has its pericentre at the same longitude as the planet can be estimated from equation (15), since for this to happen would have to decrease from to which occurs on a timescale of
| (16) |
This is an important timescale because if the particle’s eccentricity is high enough, a close approach to the planet is possible causing the particle to be scattered onto a more eccentric and inclined orbit. 333Note that in the absence of close approaches, such as might be the case for dust coming from planetesimals with low eccentricity, it can be shown that P-R drag would cause particles to reattain the resonance of their parent planetesimals on a timescale that is independent of particle size: in years. Since after scattering the particle’s pericentre (or apocentre) remains close to the orbit of the planet further close approaches and scattering can then ensue. This scattering process was studied by following the simulations of and 0.2 grains coming from the planetesimals in the 3:2 resonance shown in Fig. 3 for 350 Myr, though excluding grains once their semimajor axis dropped below 40 AU (either because such grains would be scattered by interior planets or evolve due to P-R drag on to the star). These simulations showed that some grains were inserted quickly into the resonances outside the 3:2 resonance (some grains were trapped in the 8:5 resonance, while the grains populated a large number of resonances including the 2:1, 5:2, 3:1, 7:2, 4:1), in which case they remained there until P-R drag forces had increased their eccentricities to the maximum value for the resonance at which point the libration width increased until the resonance was unstable, a process which took Myr. The non-resonant grains were scattered relatively quickly (on timescales as low as ), but remained in the system to undergo further scattering events. These grains were eventually excluded following scattering events which put their semimajor axes below that of the planet, and once P-R drag had further reduced their semimajor axes below 40 AU, a process which took a total of Myr.
The resulting spatial distribution of the grains is not only axisymmetric, but also more radially and vertically extended than that of the parent planetesimals. The resonances did introduce a small clumpiness in the resulting distribution, however due to the variety of resonances populated by a small fraction of particles, this is expected to have a minimal effect on the distribution, resulting in only a slight underdensity at the location of the planet for these grains. The scattering timescale itself (eq. 16) is relatively short, since grains with to encounter the planet on timescales of to . While this is likely to be significantly shorter than the collisional timescale, the simulations showed that the dynamical lifetime of the grains may be much longer than their collisional lifetime. The scattering timescale given in eq. 16 should thus be considered as the timescale on which the particle distribution becomes axisymmetric.
2.2.2 2:1 Resonance
| , AU | ||||
|---|---|---|---|---|
| 0.8 | 10 | 79.4 | 0.44 | 0.0001 - 0.1 |
| 0.8 | 30 | 79.4 | 0.44 | 0.0001 - 0.1 |
| 0.8 | 100 | 79.4 | 0.44 | 0.0001 - 0.1 |
| 0.8 | 300 | 79.4 | 0.44 | 0.0001 - 0.1 |
| 2.5 | 30 | 95.3 | 0.32 | 0.005 - 0.02 |
| 2.5 | 300 | 95.3 | 0.32 | 0.01 - 0.03 |
| 2.5 | 300 | 31.8 | 0.32 | 0.01 - 0.03 |
| 0.25 | 30 | 95.3 | 0.32 | 0.01 - 0.03 |
| 2.5 | 300 | 95.3 | 0.43 | 0.01 - 0.03 |
| 2.5 | 300 | 95.3 | 0.20 | 0.01 - 0.03 |
| 2.5 | 300 | 95.3 | 0.12 | 0.005 - 0.03 |
The parameters used in the runs to characterise the libration parameters of dust grains created in the destruction of planetesimals previously trapped in the 2:1 resonance of a migrating planet are given in Table 2. For these runs, the migration was set so that planetesimals were trapped only into the 2:1(u) resonance (i.e., with librating about causing a clump of material behind the planet’s motion). The results of the runs for the 2:1 resonance are broadly similar to those for the 3:2 resonance in that for increasing (decreasing grain size), the libration width increases leading to clump smearing and eventually an axisymmetric spatial distribution.
However, one significant difference was that as the particles was increased, the libration of could no longer be described as a sinusoidal oscillation. This is illustrated in Fig. 1 which shows the evolution of for different sized dust grains coming from the same planetesimal in one of the runs, as well as Fig. 3 which shows the spatial distributions of different sized dust grains coming from the same poulation of planetesimals. As is increased, first the libration becomes asymmetric in that more time is spent at low values of ; this means that the clump smears out asymmetrically about , causing a spatial distribution weighted toward the anti-planet direction. Increasing further leads to the particle switching between performing half a libration in each of the 2:1(u) and 2:1(l) resonances. The distribution of such grains has three defining features: a gap at the location of the planet; concentrations just in front of and behind the planet (from the extreme points of the libration); and an overdensity in the anti-planet direction, caused by resonant forces which slow down the evolution of at (this is just noticeable in the run of Fig. 1, but dominates the evolution of some grains). Finally the particle is no longer in resonance at which point circulates rather than librates resulting in an axisymmetric distribution.
The non-sinusoidal oscillation makes characterisation of the structure more problematic than for the 3:2 resonance, and for the purposes of this paper the runs were used to derive the for which the libration width is so high that grains with are no longer in resonance. The result is that the stability of grains from planetesimals in the 2:1(u) resonance is remarkably similar to those from the 3:2 resonance. In fact, can be well approximated by equation (13) as illustrated in Fig. 3, since the cut-off has the same dependence on , and , and occurs at the same size of dust grain. One difference with the 2:1(u) resonance is that there is a dependence on particle eccentricity, in that ; i.e., dust from higher eccentricity planetesimals remains in resonance down to smaller grains. Equation (13) is thus valid for the 2:1(u) resonance when the eccentricities are . However, since high eccentricities are required to cause significant structure (W03), the difference caused by this effect is likely to be small and equation (13) is used in this paper as a good approximation for the cut-off.
3. Distribution of Blow-out Grains
|
|
|
|
|
|
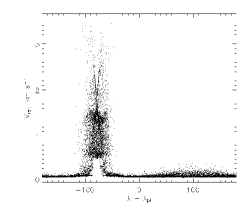
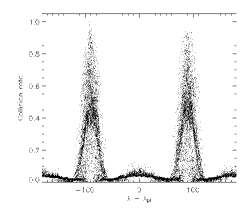
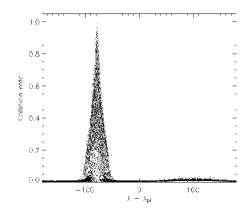
The distribution of grains that are blown out of the system by radiation pressure as soon as they are created depends on where those grains are most often created. In order to quantify the structure of the disk comprised of grains created in the break-up of large planetesimals, the following model was devised. As input, this model took the positions and velocities of a population of planetesimals that had previously been trapped into resonance by a migrating planet. For comparison with the simulations of §2, simulations were considered that placed planetesimals in the 3:2 and 2:1(u) resonances of a planet which migrated 45-60 AU from a star. However, rather than using a full integration to determine the outcome for 200 planetesimals, these populations were simulated using the approach of W03, since this allowed large numbers of planetesimals to be simulated without requiring lengthy integrations (40,000 planetesimals were considered here). Then for each planetesimal, the rate at which it collides with other planetesimals was determined using the fact that this collision rate is proportional to the product of the volume density of cross-sectional area of nearby planetesimals and the relative velocity of their collisions (Opik 1951; Wyatt & Dent 2002). These two factors were derived by considering the number of planetesimals within a defined radius (4 AU in this case) of the planetesimal, as well as the mean of the velocities of those planetesimals relative to the planetesimal in question. These factors, as well as the resulting collision rates, are plotted in Fig. 4.
Fig. 4 shows that as well as a higher volume density in the clumps (as expected), there is also a higher relative velocity of collisions in the clumps. This means that the collisions are not only more destructive, but also occur at a higher rate (by more than an order of magnitude) than outside the clumps. Thus a planetesimal is most likely to be destroyed at the locations in its orbit when it is inside one of the clumps (i.e., near pericentre), and this is where the trajectories of the blow-out grains are most likely to start. This means that the distribution of these blow-out grains will not be axisymmetric.

|

|

|

|
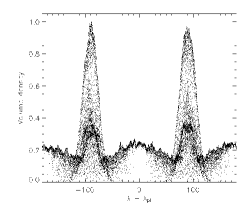
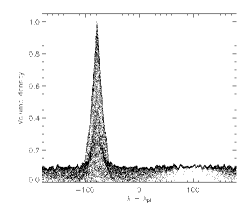
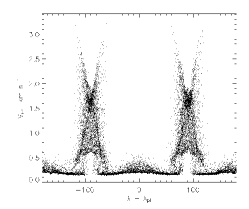
To determine the spatial distribution of the blow-out grains, the evolution of the planetesimal population was considered for a total time which depended how far from the star the dust distribution needed to be considered (6 planet orbits were considered in this case allowing the distribution to be determined out to at least 2000 AU). Since the planetesimal distribution is constant in the frame rotating with the planet, the positions and velocities of the planetesimal population at subsequent timesteps were assumed to be the same as those of the planetesimal population at the end of the migration, but rotated with the planet; the collision rate of those planetesimals was as determined in Fig. 4. In each timestep, a fixed number of dust grains was introduced, with initial positions and velocities that were the same (suitably rotated) as those of planetesimals chosen randomly according to the collision rates of the planetesimals. The evolution of those dust grains was then integrated for the remaining timesteps under the action of stellar gravity and radiation pressure. Equilibrium was achieved immediately by assuming the planetesimal that produced any given dust grain was equally likely to have created one a time equal to the total integration time ago; i.e., the integration ”starts” with dust grains far from the star. The result is a movie which shows how the planetesimal and dust population evolves with time. Since the dust distribution is constant in the frame rotating with the planet, this was also coadded in the frame rotating with the planet to determine the spatial distribution of those grains. This is shown in the far right plots of Fig. 3 for and 10. It is also shown more quantitatively in Fig. 5 which shows histograms of the radial and azimuthal distributions of the grains for .
The radiation pressure blow-out grains form spiral structure which emanates from the clumps; i.e., for the 3:2 resonance there are two spirals that start at longitudes from the planet, and the 2:1 resonance exhibits one spiral that starts behind the planet. Note that in these simulations dust grains were also created when the planetesimals were outside the clumps, just in much lower quantities. The spirals unwind in the direction opposite to the planet’s motion. This arises because the pattern speed rotates with the planet (i.e., relatively fast), and while the dust grains can start with a comparable velocity to the planet’s orbital motion (particularly since they are created near pericentre), their azimuthal motion is soon much slower than that of the planet as they recede from the star. Fig. 5 shows how the radial distribution of the grains falls off outside the region where they are being produced, as expected for grains on hyperbolic orbits; a similar fall off is seen for grains for which the surface density drops . This figure also shows how the spirals becomes less pronounced (i.e., the contrast between the density in and out of the spiral is lower) at large distances from the star as the spiral structure diffuses at large distances. Further it illustrates how the single spiral of the 2:1 resonance is maintained out to greater distances than that of the 3:2 resonance because it takes longer for this to merge with the nearest winding. In fact the spiral structure of blow-out grains will diffuse much faster than illustrated on Fig. 5, since the tightness of the winding of the spiral is determined by the factor : dust grains with higher are accelerated out the system faster than those with lower meaning that the resulting spiral is less tightly wound. Representative simulations were performed that made the assumption that the dust grains produced had chosen randomly from the range 1-10. Spiral structure close to the clumps is still well pronounced, and only becomes more diffuse at AU.
The distributions shown for in Fig. 3 are only valid for a disk comprised only of the planetesimals considered in that simulation (i.e., all trapped in the same resonance with a narrow range of eccentricities). This is because the structure is determined by the collision rates of those planetesimals. A real disk is not just comprised of planetesimals in one resonance, and the interaction of the resonant plantesimals with planetesimals that are either non-resonant, or in other resonances, will affect the collision rates. To assess this, we also performed a representative simulation of the distribution of dust grains expected as a result of the planetary migration described in W03 to explain the structure of the sub-mm emission from the Vega disk. In this simulation planetesimals were trapped into a variety of resonances (though mainly the 3:2 and 2:1(u)), and many remained on non-resonant orbits. The order of magnitude increase in collision rate is still apparent in the clumps, and so two armed spiral structure dominates the distribution of blow-out grains. Since the two clumps are of different magnitude it is also worth noting that one of the spirals is more dense by a factor greater than simply the ratio of the clump densities, since the production rate of those particles is proportional to the product of the clump density squared and the relative velocity of the collisions (which is slightly higher in the brighter clump because of the superposition of the 3:2 and 2:1(u) resonances there).
The model discussed so far in this section is only valid for the dust grains that are created by the destruction of large planetesimals. Such dust grains could also be created in the destruction of intermediate sized dust grains that are still on bound orbits. As Fig. 3 showed, those intermediate sized grains could have a distribution that is axisymmetric. The blow-out grains arising from the intermediate sized grains, with , would be expected to have a radial distribution similar to that shown in Fig. 5, but with an axisymmetric azimuthal distribution.
4. Discussion
4.1. Summary of Grain Populations
In §§2 and 3 the distribution of small dust grains resulting from the destruction of planetesimals that are trapped in resonance with a planet were studied showing how they differ significantly from that of the planetesimals themselves. Here the results are summarised. There are three distinct grain populations each of which exhibiting a different spatial distribution:
-
•
(I) Large grains with (i.e., typically a few mm) have the same clumpy resonant distribution as the planetesimals, albeit one which is slightly azimuthally smeared out for ;
-
•
(II) Moderate sized grains with (i.e., typically a few m to a few mm) are no longer in resonance and have an axisymmetric distribution which is also more radially extended and vertically broadened than that of population I grains. Such grains may also have a short lifetime due to the increased chance of a close encounter with the planet;
-
•
(III) Small grains with (i.e., typically a few m) are blown out of the system by radiation pressure immediately on creation and so have a density distribution which falls off as , however the structure of these grains can be further divided into two subclasses: (IIIa) grains produced in the destruction of population I grains that exhibit trailing spiral structure which emanates from the resonant clumps, and (IIIb) grains produced from population II grains that have an axisymmetric distribution.
4.2. Predictions for Multi-waveband Imaging
Observations in different wavebands are sensitive to different sizes of dust grains. Thus a disk could exhibit different structures when imaged in different wavebands, providing the two wavelengths sample different grain populations. This has the potential to provide a valuable observational test of models which explain clumpy structure seen in sub-mm observations of debris disks as due to resonant trapping of planetesimals. It is also relevant to ask whether the sub-mm observations would sample dust grains with a spatial distribution that is similar to that of their parent planetesimals (i.e., population I grains), as was assumed in W03.
The size of grains sampled in different wavebands depends to some extent on the composition of the grains, but is most strongly dependent on the size distribution of grains in the disk. At present this size distribution is not predicted by the models. The most simple assumption is that, since the dust is produced in the collisional destruction of planetsimals, the size distribution is the same as that expected in an infinite collisional cascade with down to the radiation pressure blow-out limit (Wyatt & Dent 2002). Although in practise it has been shown that an abrupt cut-off to the size distribution at the blow-out limit would cause a wave in this distribution (Thébault, Augereau & Beust 2003). This simple assumption can be used to explore the relative importance of grains in populations I and II, but does not make any predictions about the quantity or observability of population III grains. It also neglects the fact that the dynamical lifetimes of population II grains may be lower than their collisional lifetimes due to the increased chance of scattering by the planet, and their collisional lifetimes may be affected by the broadening of their spatial distribution.
However, this simple size distribution has been shown to provide a good fit to the spectral energy distributions of the emission from several debris disks (Wyatt & Dent 2002, Sheret, Dent & Wyatt 2004). The results presented in Fig. 5 of Wyatt & Dent (2002) can also be used to work out which grain populations we would be seeing in the Fomalhaut disk for different wavebands (assuming of course that some of the planetesimals in this disk are trapped in resonance with a planet, which has not been proved). Since just 5% of the sub-mm emission comes from grains either m or cm in diameter, with roughly equal weightings in this range toward different bins of log particle diameter, this implies that sub-mm observations would indeed be dominated by the population I grains that have a similar spatial distribution to that of the planetesimal population. However, this also implies that, since less than 5% of the 25-100 m emission comes from grains that are bigger than mm with weightings that favor the lower end of the size range, such observations would be dominated by population II grains and would have an axisymmetric spatial distribution.
Thus for disks where this size distribution holds, and in which clumps are seen in sub-mm images, a model which interpreted the clumps as the result of planet migration and the consequent trapping of planetesimals into the planet’s resonances could be tested by seeing if mid- to far-IR imaging of the disk shows it to be axisymmetric. By consideration of equation (14) it is possible to infer that the wavelength at which the transition from clumpy to smooth structure occurs is indicative of both the mass of the perturbing planet, with the transition shifted to shorter wavelengths for more massive planets, and the spectral type of the star, with shorter wavelength transitions for lower mass stars. In other words multi-wavelength imaging could also reveal the mass of the planet. In fact Fomalhaut’s disk appears asymmetric at a range of wavelengths (Holland et al. 2003; Stapelfeldt et al. 2004; Marsh et al. 2005; Kalas et al. 2005), favoring a mechanism that affects grains of all sizes such as an offset centre of symmetry due to the non-circularity of a perturbing planet’s orbit (Wyatt et al. 1999; Marsh et al. 2005; Kalas et al. 2005).
To assess the importance of the population III grains relative to that of the populations I and II grains described above, a more detailed model of the size distribution of the disk would be required which is beyond the scope of this paper, although some considerations are discussed in §4.3.
4.3. Implications for Vega
Vega’s dust disk has been observed to be clumpy when imaged in the sub-mm (Holland et al. 1998), yet more recent observations show its structure to be axisymmetric at mid- to far-IR wavelengths (Su et al. 2005). This does not in itself validate the model of W03, since Su et al. also showed that the disk is much more extended at these wavelengths than in the sub-mm. They devised a three component model to explain the radial emission distribution observed from 25-850 m which is comprised of grains that are 4, 36 and 430 m in diameter. The two smallest sizes have an optical depth distribution that falls off and are small enough that . Such grains dominate the mid- to far-IR images and are interpreted as grains that are in the process of radiation pressure blow-out (i.e., population III grains), while the larger grain population, with a density distribution peaked around 100 AU is required to fit the 850 m images (and must be predominantly population I grains to produce the observed clumpy structure). Su et al. interpreted this as evidence of a recent collision having occured in the disk, since the blow-out grains are short-lived and it is unfeasible for the observed outflow to have been continually replenished over Vega’s 350 Myr lifetime. However, they did not attempt to explain the azimuthal structure in the sub-mm images, or lack thereof in the short wavelength structure. Here the model of Su et al. is expanded to turn the 3 component model into one with a size distribution extending across all sizes. The aim is to provide a more realistic description of the disk which can be used to question whether, in the absence of a model that predicts the size distribution in the W03 model, the relative quantities of populations I, II and III grains are physically plausible in the context of that model given our understanding of size distributions in collisional cascades, or if another model needs to be sought to explain the clumpy sub-mm structure.
The size distribution in Vega’s disk is assumed to be defined by different power laws in three size ranges considered to represent populations I, II and III grains. Su et al. already showed that the distribution of population III grains follows a size distribution of in the range m and to have a distribution for AU. This distribution is maintained here, but the minimum and maximum grain sizes, as well as the total cross-sectional area, are left as variables. The population I and II grains are fixed to lie at 100 AU, the peak in the optical depth distribution found by W03, and the size distributions of both populations are assumed to follow that of a collisional cascade with , but with different amounts of cross-sectional area in each of the populations. The division between populations I and II was set at 1 mm, a changeover size consistent with a planet of size (eq. 14). Following Su et al., astronomical silicates were assumed for the particles’ optical properties. Since Su et al. already showed that this fits the surface brightness distribution, it remains to fit the spectral energy distribution (SED), where the emission from population III grains is taken to be that out to 1000 AU. An additional constraint was set to determine the relative contributions of the population I and II grains, which is that both of these populations combined contribute % of the total flux at 160 m as found in the modeling of Su et al.
| (a) |  |
(c) |  |
| (b) |  |
(d) |  |
The size distribution which fits the observed emission spectrum (and by analogy with the modeling of Su et al., also the surface brightness distributions), is shown in Fig. 6a. The contribution of different size grains in the distribution to the fluxes in the Spitzer and SCUBA wavebands is shown in Fig. 6c, and the modeled emission spectrum, showing the contribution of the different populations, is shown in Fig. 6d. Because of the way the emission efficiency falls off for population II grains at longer wavelengths, the condition of equal contributions from bound and unbound grains to the 160 m flux (and the need to fit the 850 m flux) results in a size distribution with a level of population II grains some 3-4 times lower than that expected in an idealised collisional cascade (e.g., that assumed in Wyatt & Dent 2002). This also results in the population II grains contributing just % of the 850 m flux, in line with the observation that this image is clumpy (Holland et al. 1998). Increasing the relative amount of population II grains both increases their contribution to the 850 m image and of bound grains to the total 160 m flux. It is this result, along with the quantity of material in population III relative to populations I and II, that needs to be explained within the context of collisional cascades. The results for the boundaries defining population III grains are less important, since these values depend on the optical properties of the grains which are not considered here. 444The change-over from population II to III in this model occurs at 60 m, which is at . A cut-off at such a low may be real, since a cut-off at is expected if, as shown in Fig. 4, most grains are created at the pericentre of highly eccentric orbits (since such grains are put onto hyperbolic orbits provided ). However, this small discrepancy could equally be removed by changing the optical properties used in this model.
To answer whether the distribution of Fig. 6a is a realistic, or even expected, size distribution in Vega’s collisional cascade, Fig. 6b shows the lifetimes of the different grains due to collisions. This plot exhibits some well known features: starting at the largest sizes, the collisional lifetime of grains is reduced as smaller sizes are approached due to the greater quantities of cross-sectional area of smaller objects in a collisional cascade. The lower numbers of population II grains, however, cause an increase in the lifetimes of the population I grains that should have been destroyed by this population (Thébault et al. 2003). The population II grains have a lower lifetime than the population I grains because these are destroyed in collisions with the large quantities of blow-out grains in this distribution (Krivov, Mann & Krivova 2000). However, the lifetime of the population III grains themselves due to collisions is much lower than their blow-out time indicating that only a small fraction of the population III grains are themselves destroyed in collisions on their way out. This means that it may be possible to explain the break in the size distribution between populations I and II, as inferred from the SED modeling, by the destruction of population II grains in collisions with those in the process of blow-out by radiation pressure (Krivov et al. 2000), and the knock-on effect induced by the lower levels of such grains in the distribution at larger sizes (Thébault et al. 2003). This effect may be further accentuated by a lifetime for population II grains that is even shorter than their collisional lifetimes of 100,000 years which may be caused by interaction with the planet which occurs on 1000 year timescales (eq. 16).
However, this still leaves the question of why there are so many population III grains. This modeling finds a similar mass loss rate to Su et al. for this population of /Myr, which, as Su et al. point out, implies that the cascade must have been initiated relatively recently. However, the lack of evidence for non-axisymmetry in the far-IR emission at large distances from the star seen by Su et al. poses problems for the W03 model. This is because the mass of population II grains is comparable to that of population III grains at , yet the population II grains are only destroyed in collisions on timescales of 100,000 years whereas population III grains are removed on 1000 year timescales. This means that, unless there is some mechanism that turns population II grains into population III grains on 1000 year timescales, then at most 1% of the population III grains can be of type IIIb. The remainder must be population IIIa grains, and the collision rates indicate that this is not unreasonable: for the distribution assumed in Fig. 6, the mass in population I grains () is processed in collisions at a rate /Myr. While most of this mass is likely redistributed within population I rather than lost to population III, it is noted that this rate would be much larger if the distribution had been assumed to extend to sizes larger than 10m. Thus it is possible that the required loss rate could be achieved with just a few % of the mass of population I objects being put into blow-out grains in destructive collisions as long as the population I distribution extends to large enough objects. This means that the mid- to far-IR emission should exhibit spiral structure rooted in the clumps seen in the sub-mm. Limits on the circularity of the emission detected by Spitzer were not discussed in detail in Su et al., but it is possible that these images were not of sufficiently high resolution and/or sensitivity (or are too confused by the point-like photospheric emission) to rule out the presence of population IIIa grains. If this is the case, then the model predicts that at high resolutions the disk should exhibit spiral structure when imaged at far-IR and mid-IR wavebands, e.g., when imaged at 25 m using a coronagraph with MIRI on the JWST (Wright et al. 2003). A more detailed confrontation of the model with the Spitzer and SCUBA observations of the Vega disk is left for a future paper (Wyatt, Su, Rieke, Holland, in prep.).
5. Conclusions
This paper shows how the distribution of small dust grains resulting from the destruction of planetesimals that are trapped in resonance with a planet differ from that of the planetesimals themselves, both in terms of their orbital characteristics and consequently their spatial distributions. Three different grain populations are identified based on grain size: population I grains that are large enough to remain in the resonance of the parent object (and so have a clumpy distribution); population II grains that, due to radiation pressure, are still on bound orbits, but are no longer in resonance (and so have an axisymmetric distribution); and population III grains that are removed from the system by radiation pressure on short timescales (and so have a distribution that falls off ). Subclasses are defined for population III grains based on the population designation of the parent object: population IIIa grains originate in the destruction of population I grains and exhibit trailing spiral structure emanating from the clumps; population IIIb grains originate in the destruction of population II grains and have an axisymmetric distribution.
The fact that a planetesimal belt is made up of particles from all populations and subclasses, each of which has its own (quite different) dynamical and spatial distribution implies that observations in different wavebands can be dominated by different populations and so exhibit different morphologies. Adoption of a simple collisional cascade size distribution with no blow-out (population III) grains implies that if some planetesimals in the disk are trapped in resonance with a planet then sub-mm observations would trace the distribution of those planetesimals through population I grains (validating the approach of Wyatt 2003 in modeling the SCUBA observations of Vega), but that mid- to far-IR observations would trace population II grains and so have an axisymmetric distribution. The wavelength at which the transition occurs from clumpy to smooth structure is indicative of the mass of the planet.
The size distribution of Vega is modeled in the light of recent Spitzer observations which show that significant quantities of population III grains are present (Su et al. 2005). This shows that there is a significant lack of population II grains in this distribution (a factor 3-4 under that expected in a collisional cascade). Analysis of the collisional lifetimes indicates that this may be due to the destruction of these grains by those that are in the process of being blown out by radiation pressure. It is argued that unless there is some mechanism that is destroying the population II grains on 1000 year timescales, then the population III grains, and so the mid- to far-IR images of the Vega disk, should exhibit spiral structure emanating from the clumps seen in the sub-mm images. Detection of such structure may be possible with Spitzer or with MIRI on the JWST, and would confirm the interpretation of the morphology of Vega’s disk in terms of planetesimals trapped in resonance with a planet orbiting at 65 AU (Wyatt 2003) as well as indicate the direction of its motion.
Multi-wavelength imaging thus provides a method of confirming models interpreting clumps in debris disks as indicative of planetesimals trapped in resonance with an unseen planet. Such images can also provide information on the mass and direction of motion of the perturbing planet, and do not require the decade timespans of multi-epoch methods for confirming these models by checking for orbital motion of the clumps (e.g., Ozernoy et al. 2000).
References
- Backman & Paresce (1993) Backman, D. E., & Paresce, F. 1993, in Protostars and Planets III, ed. E. H. Levy & J. I. Lunine (Tucson: Univ. Arizona Press), 1253
- Burns et al. (1979) Burns, J. A., Lamy, P. L., & Soter, S. 1979, Icarus, 40, 1
- Deller & Maddison (2005) Deller, A. T., & Maddison, S. T. 2005, ApJ, 625, 398
- Dermott et al. (1994) Dermott, S. F., Jayaraman, S., Xu, Y. L., Gustafson, B. A. S., & Liou, J. C. 1994, Nature, 369, 719
- Dermott et al. (2002) Dermott, S. F., Kehoe, T. J. J., Durda, D. D., Grogan, K., Nesvorný, D. 2002, in Proceedings of Asteroids, Comets, Meteors (ACM 2002), ed. B. Warmbein (Noordwijk: ESA Publications Division), 319
- Everhart (1985) Everhart, E. 1985, in Dynamics of Comets, ed. A. Carusi & G. B. Valsecchi (Dordrecht: Reidel), 185
- Fernández & Ip (1984) Fernández, J. A., & Ip, W.-H. 1984, Icarus, 58, 109
- Greaves et al. (1998) Greaves, J. S., et al. 1998, ApJ, 506, L133
- Greaves et al. (2005) Greaves, J. S., et al. 2005, ApJ, 619, L187
- Hahn & Malhotra (1999) Hahn, J. M., & Malhotra, R. 1999, AJ, 117, 3041
- Holland et al. (1998) Holland, W. S., et al. 1998, Nature, 392, 788
- Holland et al. (2003) Holland, W. S., et al. 2003, ApJ, 582, 1141
- Ida et al. (2000) Ida, S., Bryden, G., Lin, D. N. C., & Tanaka, H. 2000, ApJ, 534, 428
- Kalas et al. (2005) Kalas, P., Graham, J. R., & Clampin, M. 2005, Nature, 435, 1067
- Kalas et al. (2000) Kalas, P., Larwood, J., Smith, B. A., & Schultz, A. 2000, ApJ, 530, L133
- Kenyon & Bromley (2005) Kenyon, S. J., Bromley, B. C. 2005, AJ, 130, 269
- Koerner, Sargent & Ostroff (2001) Koerner, D. W., Sargent, A. I., & Ostroff, N. A. 2001, ApJ, 560, L181
- Krivov et al. (2000) Krivov, A. V., Mann, I., & Krivova, N. A. 2000, A&A, 362, 1127
- Malhotra (1993) Malhotra, R. 1993, Nature, 365, 819
- Malhotra (1995) Malhotra, R. 1995, AJ, 110, 420
- Marsh et al. (2005) Marsh, K. A., Velusamy, T., Dowell, C. D., Grogan, K., & Beichman, C. A. 2005, ApJ, 620, L47
- Murray & Dermott (1999) Murray, C. D., & Dermott, S. F. 1999, Solar System Dynamics (Cambridge: Cambridge University Press)
- Nesvorný et al. (2003) Nesvorný, D., Bottke, W. F., Levison, H. F., Dones, L. 2003, ApJ, 591, 486
- Opik (1951) Opik, E. J. 1951, Proc. R. Irish Acad., 54A, 165
- Ozernoy et al. (2000) Ozernoy, L. M., Gorkavyi, N. N., Mather, J. C., & Taidakova, T. A. 2000, ApJ, 537, L147
- Quillen & Thorndike (2002) Quillen, A. C., & Thorndike, S. 2002, ApJ, 578, L149
- Sheret et al. (2004) Sheret, I., Dent, W. R. F., & Wyatt, M. C. 2004, MNRAS, 348, 1282
- Stapelfeldt et al. (2004) Stapelfeldt, K. R., et al. 2004, ApJS, 154, 458
- Su et al. (2005) Su, K. Y. L., et al. 2005, ApJ, 628, 487
- Telesco et al. (2005) Telesco, C. M., et al. 2005, Nature, 433, 133
- Thébault et al. (2003) Thébault, P., Augereau, J.-C., & Beust, H. 2003, A&A, 408, 775
- Wilner et al. (2002) Wilner, D. J., Holman, M. J., Kuchner, M. J., & Ho, P. T. P. 2002, ApJ, 569, L115
- Wright et al. (2003) Wright, G. W., et al. 2003, SPIE, 4850, 493
- Wyatt (2003) Wyatt, M. C. 2003, ApJ, 598, 1321
- Wyatt (2005) Wyatt, M. C. 2005, A& A, 433, 1007
- Wyatt & Dent (2002) Wyatt, M. C., & Dent, W. R. F. 2002, MNRAS, 334, 589
- Wyatt et al. (1999) Wyatt, M. C., Dermott, S. F., Telesco, C. M., Fisher, R. S., Grogan, K., Holmes, E. K., & Piña, R. K. 1999, ApJ, 527, 918
- Wyatt et al. (2003) Wyatt, M. C., Holland, W. S., Greaves, J. S., Dent, W. R. F. 2003, Earth Moon Planets, 92, 423