Structure in the radio counterpart to the 2004 Dec 27 giant flare from SGR 1806-20
Abstract
On Dec 27, 2004, the magnetar SGR 1806-20 underwent an enormous outburst resulting in the formation of an expanding, moving, and fading radio source. We report observations of this radio source with the Multi-Element Radio-Linked Interferometer Network (MERLIN) and the Very Long Baseline Array (VLBA). The observations confirm the elongation and expansion already reported based on observations at lower angular resolutions, but suggest that at early epochs the structure is not consistent with the very simplest models such as a smooth flux distribution. In particular there appears to be significant structure on small angular scales, with % of the radio flux arising on angular scales milliarcsec. This structure may correspond to localised sites of particle acceleration during the early phases of expansion and interaction with the ambient medium.
keywords:
pulsars:individual (SGR1806-20); ISM:jets and outflows; radio continuum:stars1 Introduction
On Dec 27, 2004, the most energetic explosion witnessed by humans within our galaxy for over 400 years was detected from the soft gamma-ray repeater SGR 1806-20 (e.g. Borkowski et al. 2004; Palmer et al. 2004; Hurley et al. 2005). Shortly after the outburst an expanding radio source was detected associated with SGR 1806-20 (Cameron et al. 2005; Gaensler et al. 2005). This radio emission traces the ejection of mass from the surface of the neutron star, and its interaction with the ambient medium (Gelfand et al. 2005; Taylor et al. 2005; Granot et al. 2005) Measuring the geometry and temporal evolution of this ejected matter is of key importance for our understanding of the origins of this enormous outburst, and its impact upon its immediate environment.
SGR 1806-20 is believed to be a magnetar, an isolated non-accreting neutron star with a magnetic field G (Kouveliotou et al. 1998). While several scenarios discussed for the origin of the radio emission from SGR 1806-20 predict possibly edge-brightened emission (Gaensler et al. 2005; Gelfand et al. 2005; Granot 2005) or other spatial structure, especially at early times, the relatively low resolution radio data published to date have not allowed a test of these models. As a result, Gaussian models have been fit to the data sets in order to quantify the motion and expansion of the source, despite the link between the fit parameters and physical conditions in the radio source remaining uncertain. In this paper we present the highest-resolution radio images of the ejecta between nine and fifty-six days after the outburst, obtained with the US Very Long Baseline Array (VLBA) and the Multi-Element Radio-Linked Interferometer Network (MERLIN) in the UK. These are the first, and possibly only, data sets which are able to probe on angular scales mas and test for substructure in the evolving radio source.
2 Observations
A log of the six epochs of observation under discussion is presented in table 1. Note that, with the exception of epoch M4, for all data sets phase-referencing failed, due to resolved calibrators. As a result, self-calibration was used exclusively, removing any possibility of measuring the absolute position / displacement of the radio source. Therefore we cannot test the evidence for proper motion, and not just expansion, of the source presented in Taylor et al. (2005). Fig 1 places these observations in the context of the light curve of the radio source. The data were calibrated using AIPS (Diamond 1995) while the images presented here were created in MIRIAD (Sault, Teuben & Wright 1995). The images themselves are based upon discrete Fourier transforms (DFTs), which are better at avoiding aliasing problems than fast Fourier transforms (FFTs). In practice the difference is not great; in the region within 0.5 arcsec of SGR 1806-20 the difference map between the FFT and DFT images has an r.m.s. of 35Jy (typically 10–20% of the total r.m.s. noise in an image). Nevertheless, there is structure in this difference map and we default to the DFT images for all data sets in this paper. All images presented in this paper have also been CLEANed, with a typical gain of 0.05 over 500 iterations. MERLIN and VLBA images are presented in Figs 2 and 3 respectively.
| Run | Frequency | Midpoint (UT) / duration | |
|---|---|---|---|
| V1 | VLBA | 1.4 GHz | 2005-01-05-16:30 / 5.5 hr |
| M1 | MERLIN | 6.0 GHz | 2005-01-06-10:30 / 4.5 hr |
| V2 | VLBA | 1.4 GHz | 2005-01-06-14:00 / 2.5 hr |
| M2 | MERLIN | 6.0 GHz | 2005-01-07-11:30 / 4.5 hr |
| M3 | MERLIN | 6.0 GHz | 2005-01-09-12:30 / 4.5 hr |
| M4 | MERLIN | 1.7 GHz | 2005-02-21-08:15 / 5.5 hr |

| Image-plane Gaussian | uv-plane Gaussian | ||||||||
| Epoch | map peak | peak | integrated | size | p.a. | integrated | size | p.a. | |
| (mJy bm-1) | (mJy) | (mJy bm-1) | (mJy) | (masmas) | (∘) | (mJy) | (masmas) | (∘) | |
| M1 | (6.1 GHz / A) | -16.6 | |||||||
| M2 | (6.1 GHz / A) | -20.3 | Fit failed | ||||||
| M3 | (6.1 GHz / A) | -23.5 | |||||||
| M4 | (1.4 GHz / V) | -36.8 | |||||||
| V1 | (1.4 GHz / A) | -49.3 | |||||||
| V2 | (1.4 GHz / A) | -43.1 | |||||||
Note that throughout this paper we utilise and discuss Gaussian models to the radio flux distribution. This is because they are a simple way to parametrize a barely-resolved source and were therefore used to fit the published VLA data sets (Gaensler et al. 2005; Taylor et al. 2005), against which we compare our data. Note that neither here nor in the previously published papers are we claiming for theoretical reasons that the flux distribution should be Gaussian in form.
2.1 MERLIN
As a southern object SGR 1806-20 is a very awkward target for MERLIN, and as a result the data reduction has considerably more associated difficulties than for a standard northern source. These problems were exacerbated by the failure of the Cambridge telescope during runs M1, M2 and M3 in 2005 January, further reducing the quality of the u-v coverage, and by a resolved calibrator.
The flux scales for epochs M1-M3 were calibrated with 3C286 and 0552+398. 3C286 is around 5% resolved on the shortest MERLIN spacings whilst 0552+398 is unresolved. The phase calibrator was 1808+209. Initial imaging of runs M1–3 appears to reveal significant deviations from the Gaussian model employed to fit the Very Large Array (VLA) data (e.g. Gaensler et al. 2005; Taylor et al. 2005), which have considerably poorer angular resolution. However, there are many caveats to this conclusion: the calibrator was resolved, and the resultant images were found to be sensitive to the starting model. Therefore all apparent structure in the images in Fig 2 must be treated with caution. The overall elongation of the resolved radio structure in a north-westerly direction is not in doubt. However, note that for all MERLIN epochs it appears that there is a systematic rotation of the true source extension position angle back towards north from northwest, by approximately the same amount at each epoch. This effect is confirmed in simulations, which indicate that the source extent and, possibly, structure, may be preserved even with such poor u-v coverage, but that the position angle is less trustworthy.
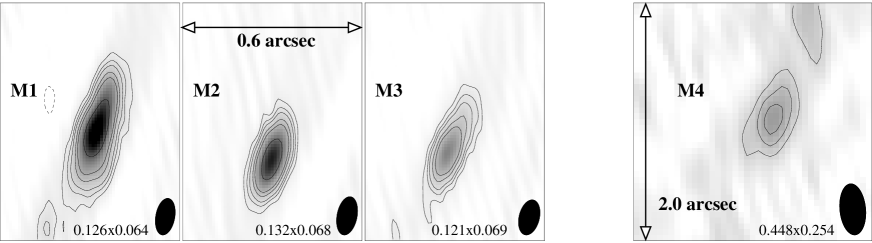
In Fig 2 we present DFT images of the three 6.0 GHz MERLIN epochs from 2005 January. Results of Gaussian fits in the image plane to these maps are presented in table 2, as are measurements of the peak flux density (per beam) in each map. It is clear from the discrepancy between the measured and fitted peaks that these images cannot be fit by simple Gaussians. The fits to the MERLIN datasets presented in table 2 were unconstrained in any parameter and result in good fitting of the extended emission but underfit the core; as a result the residual images all show a point source with a flux density approximately equal to the difference between the measured peaks in table 2. Alternatively, fitting of Gaussians with the same size as those fit to the VLA uv-plane data (Taylor et al. 2005) results in good subtraction of the core emission, but residual extended emission at all position angles. What remains unclear is to what extent these discrepancies are due to real source structure, or have an origin in artefacts.
The data reduction associated with run M4 was rather smoother, with a well-behaved calibrator and Cambridge antenna available. The flux scale was set by observations of the point source OQ208 and resolved flux density calibrator 3C286; the phase calibrator used was 1808-209. A DFT image of this epoch is presented in Fig 2. Note that there appears to be significant extended emission well beyond the central smooth component; given the aformentioned uncertainties in mapping and modelling the MERLIN data, we do not currently consider this to be real. Fitting a single Gaussian to the main radio component (details in table 2) does not result in significant undersubtraction of the core as it did in the earlier, higher-frequency MERLIN epochs M1–3. This hints at a diffusion of the compact radio structure which was probably present at earlier epochs.
At the lower frequency of 1.4 GHz, run M4 does not probe the radio structure at a much finer angular resolution than the early VLA observations; however since the VLA is moving to more compact configurations throughout 2005 the data remain valuable. In any case, the source has clearly grown significantly in size between epochs M1-3 and M4, unless its angular size is a strong function of wavelength. However, the overall optically thin sychrotron spectrum across this frequency range at all epochs essentially rules out this possibility.
2.2 VLBA
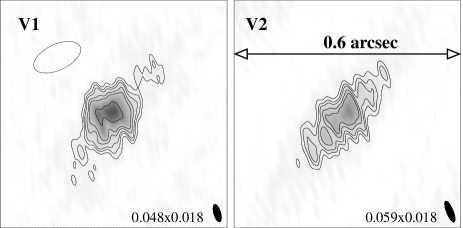
SGR 1806-20 was observed at 1.4 GHz with the NRAO Very Long Baseline Array (VLBA), including the Green Bank Telescope and a single dish of the VLA on 2005 January 5 and 6 (see Table 1 for exact times of observations). The data were processed in AIPS following standard amplitude calibration and fringe-fitting procedures (e.g. Diamond 1995). The amplitude calibration of the VLBA is typically better than 10%. The target was phase-referenced to the nearby source J1811-2055. However this source was found to be heavily resolved. Instead, we applied delay and rate referencing to J1825-1718, another calibrator that was regularly observed every 10-20 minutes. Self-calibration was carried out using Difmap (Shepherd 1997). Since a point source starting model was not applicable to our data, and various extended models resulted in somewhat different final images, we decided to use the MERLIN imaging result as a starting model for phase calibration. Further VLBA observations were performed on 2005 Jan 10 and Feb 28, but did not produce useful data (Jan 10 was very weak and Feb 28 a non-detection) and are not discussed further here.
DFT images are presented in Fig 3, and table 2 presents peak flux measurements and Gaussian fits to the data. It is immediately apparent from Fig 3 that the radio sources do not look like simple smooth flux distributions, but are highly elongated in a north-westerly direction and display substructure. As with the MERLIN images, however, we have to carefully examine how much of any apparent structure is real. An additional complication is that the combination of high angular resolution, relatively low frequency and large distance ( kpc; Corbel & Eikenberry 2004; McClure-Griffiths & Gaensler 2005) in the galactic plane makes it likely that some interstellar scattering is affecting the images. At the position and distance of SGR 1806-20 (galactic coordinates ,) the Cordes & Lazio (2002) electron density model predicts an angular broadening at 1.4 GHz of 98 mas, although this may be an overestimate given the evidence for structure on comparable or smaller scales.
3 Analysis
It is clear from the MERLIN and VLBA observations that we have a clearly resolved radio source oriented in an approximately north-west direction. In the following we discuss further evidence for the small-scale structure directly from the measured visibilities, and compare our results with those from other telescopes.
3.1 Reality of the small-scale structure
All of the early images with MERLIN and the VLBA (i.e. those obtained in 2005 January) show some evidence for substructure on small angular scales in the SGR 1806-20 radio source. Yet, as discussed above, it is not clear at what level we can trust these finer features. Inspection of the variation of visibility amplitude with projected baseline length (expressed in units of wavelengths) can help us establish the existence of this substructure.
The VLA observations of SGR 1806-20 have a longest projected baseline length of k, corresponding to an angular scale of 200 milli-arcsec. The MERLIN and VLBA data are able to probe angular scales four and ten times smaller, respectively, as a result of correspondingly longer projected baselines. Fig 4 illustrates the additional information which may be obtained about the radio source by utilising the longer MERLIN and VLBA baselines, for data around 2005 Jan 5/6. The top panel illustrates the expected variation of amplitude with baseline for circular Gaussian and circular thin shell models (the former having been used to date to fit the lower-resolution radio data). It is clear that the circular shell model predicts significantly more flux on the longer baselines, reflecting the concentrations of flux on small angular scales, as indeed would any model with substucture (once more we are simply attempting to quantify the reality and degree of substructure, rather than apply a theoretically-motivated model). In fact the Gaussian model predicts no detectable flux on projected baselines longer than about 3500 k. The lower three panels compare the measured visibility amplitudes as a function of projected baseline for the VLA, MERLIN and VLBA data sets of 2005 January 5/6 (all the data were taken within 24 hr). Both MERLIN and VLBA data sets show significant deviations from the assumption of zero signal in the interval 3000–4000 k (the expectation value for zero signal is based upon the measured variance of the signal within each bin, calculated in the MIRIAD routine UVAMP). This is a strong indication that some of the measured flux is from unresolved regions with a high surface brightness.

If we naively consider that the radio structure may be modelled as a Gaussian plus compact source[s], then inspection of the visibility curves in Fig 4 suggests that no more than a few mJy is associated with these components. In other words, at this epoch % of the radio flux seems to be associated with a diffuse component well-modelled by a Gaussian, and % may be associated with regions of higher surface brightness on angular scales mas. This latter component could correspond to clumps of matter or to some more regular structure such as a limb-brightened shell. The brightness temperatures associated with these compact regions would be K, which taken in isolation does not rule out thermal processes (e.g. optically thin bremsstrahlung), although the overall properties of the radio nebula, especially its spectrum and polarisation (Gaensler et al. 2005; Taylor et al. 2005) are much more consistent with optically thin synchrotron emission. Is this picture of 90% diffuse emission plus 10% compact emission consistent with the images ? The VLBA images (Fig 3) clearly remind us that the diffuse emission component is not evenly distributed, but rather more collimated, and does seem to be combined with more compact structure.

3.2 Comparison with other data
As well as the image-plane fits, table 2 also presents uv-plane fits to the MERLIN and VLBA datsets, allowing comparison with the fits to the VLA data as presented in Taylor et al. (2005). Fig 5 compares the fitted Gaussian major axes with those reported in Taylor et al. (2005) from fits to VLA data; in addition to this a Gaussian fit to contemporaneous VLA data is plotted alongside the V1 image in Fig 3. While it seems clear from comparison of epoch M4 with the earlier epochs that the source expansion is confirmed, it is very difficult to quantify the rate of this expansion at early epochs. We further note that a Gaussian fit to an image of epoch M4 which was restored with a 300 mas circular beam in AIPS resulted in a mas source (at a p.a. -44∘), which is closer to the values reported in Taylor et al. (2005) but only serves to illustrate the model- and approach-dependent nature of extracting numbers from the images. Inspection of epochs V1 and V2 suggests that a decrease in the flux of the compact central component may be at least partially responsible for the growth in the size of Gaussian fits. Table 2 also provides comparison with the nearest (in time and frequency) total flux density measurements from Gaensler et al. (2005) and Gelfand et al. (in prep). Apart from epoch M1, significant flux is being missed by the larger arrays; in particular the VLBA. This is further evidence for substructure as well as a lack of sensitivity to diffuse emission.
4 Discussion
In the context of stellar-mass compact objects, resolved radio-emitting relativistic ejection events are typically associated with periods of high rates of accretion and transitions in the state of the accretion flow (e.g. Fender, Belloni & Gallo 2004). The case of SGR 1806-20 is clearly rather different: the object is probably not accreting (Kouveliotou et al. 1998) and the apparent steady growth of the radio source is rather different from the jets associated with X-ray binaries, which typically have small () opening angles (Miller-Jones, Fender & Nakar 2005). Several aspects of this behaviour may be associated with the probable lower bulk Lorentz factor of this event, (Granot et al. 2005; compare with for X-ray binary jets). We can also compare this event with the jet-like outflows from isolated neutron stars such as the Crab (Hester et al. 2002), Vela (Pavlov et al. 2003) and PSR B1509-58 (DeLaney et al. 2005). In these radio pulsars and SGR 1806-20 it seems that the the ’escape velocity principle’, in which outflows have velocities comparable to the escape velocity at their launch point (e.g. Livio 1999 and references therein) is maintained, while it is is blatantly violated by the jets from the accreting neutron stars Sco X-1 (Fomalont, Geldzahler & Bradshaw 2001) and Circinus X-1 (Fender et al. 2004), which are much more relativistic, suggesting the necessity of a disc in forming the most relativistic flows.
Nevertheless, the radio source is still associated with the ejection of matter in a preferred direction in space, and probably the resultant in-situ particle acceleration. The observed synchrotron emission is likely to have the highest surface brightness close to regions of particle acceleration, and it may be these regions which are producing the brightest regions of radio flux measured on the longest baselines by MERLIN and the VLBA. Obvious sites for the particle acceleration are at the leading edge of the ejecta (external shocks), internal shocks distributed along the flow itself (easier to achieve the more collimated the initial flow was) and possibly at the site of the magnetar itself. In this scenario any radio emission associated with more diffuse components would be due to leptons which have diffused away from the particle acceleration site.
To conclude, we have observed at high angular resolution the early stages of the evolution of the radio counterpart to the giant flare of SGR 1806-20 on 2004 Dec 27. Despite many difficulties with analysing and interpreting the MERLIN and VLBA datasets, we find evidence for significant substructure on angular scales mas, associated with about 10% of the total radio flux. The compact radio structure is likely to be associated with sites of particle acceleration, which may be external or internal shocks in the outflow, or somehow associated with the environment close to the magnetar itself.
Acknowledgements
MERLIN is a National Facility operated by the University of Manchester at Jodrell Bank Observatory on behalf of the UK Particle Physics and Astronomy Research Council. The US National Radio Astronomy Observatory is a facility of the National Science Foundation operated under cooperative agreement by Associated Universities, Inc. We thank the referee for detailed and constructive criticism.
References
- [] Borkowski J., Gotz D., Mereghetti S., Mowlavi N., Shaw S., Turler M., 2004, GCN Circular No. 2920,
- [] Cameron P.B. et al., 2005, Nature, 434, 1112
- [] Corbel S., Eikenberry S.S., 2004, A&A 419, 191
- [] Cordes J.M., Lazio T.J.W., 2002, astro-ph/0207156
- [] DeLaney T., Gaensler B.M., Arons J., Pivovaroff M.J., 2005, ApJ, submitted
- [] Diamond, P.J., 1995, in ASP Conf. Ser. 82, Very Long Baseline Interferometry and the VLBA, ed. J.A. Zensus, P.J. Diamond and P.J. Napier
- [] Fender R.P., Belloni T.M., Gallo E., 2004, MNRAS, 355, 1105
- [] Fender R., Wu K., Johnston H., Tzioumis T., Jonker P., Spencer R., van der Klis M., 2004, Nature, 427, 222
- [] Fomalont E.B,, Geldzahler B.J., Bradshaw C.F., 2001, ApJ, 553, L27
- [] Gaensler B.M. et al.,2005, Nature, 434, 1104
- [] Gelfand J., et al., 2005, ApJ, in press (astro-ph/0503269)
- [] Granot J., et al., 2005, ApJ, in press (astro-ph/0503251)
- [] Hester J.J. et al., 2002, ApJ, 577, L49
- [] Hurley K. et al., 2005, Nature, 434, 1098
- [] Kouveliotou C. et al., 1998, Nature, 393, 235
- [1] Livio M., 1999, Physics Reports, 311, 225
- [] McClure-Griffiths N.M., Gaensler B.M., 2005, ApJ Letters, in press (astro-ph/0503171)
- [] Miller-Jones J.C.A., Fender R.P., Nakar E., 2005, MNRAS, in press
- [] Palmer D.A. et al., 2005, Nature, 434, 1107
- [] Pavlov G.G., Teter M.A., Kargaltsev O., Sanwal D., 2003, ApJ, 591, 1157
- [] Sault R.J., Teuben P.J., Wright M.C.H., 1995, In: Astronomical Data Analysis Software and Systems IV, eds. Shaw R., Payne H.E., Hayes J.J.E., ASP conf. ser. 77, 433
- [] Shepherd, M.C., 1997, in ASP Conf. Ser. 125, Astronomical Data Analysis Software and Systems VI, ed. G. Hunt and H.E. Payne
- [] Taylor G.B. et al., 2005, ApJ, in press (astro-ph/0504363)