A New Population of Planetary Nebulae Discovered in the Large Magellanic Cloud (I): Preliminary Sample
Abstract
We report our initial discovery of 73 new planetary nebulae (PNe) in the Large Magellanic Cloud (LMC) following confirmatory 2dF spectroscopy on the Anglo-Australian Telescope (AAT). Preliminary candidate sources come from a 10 per cent sub-area of our new deep, high resolution H map of the central 25∘ square of the LMC obtained with the UK Schmidt Telescope (UKST). The depth of the high resolution map was extended to for H (Å-1) by a process of multi-exposure median co-addition of a dozen 2-hour H exposures. The resulting map is at least 1-magnitude deeper than the best wide-field narrow-band LMC images currently available. This depth, combined with our selection technique, has also led to the discovery of extended AGB halos around many new and previously known LMC PNe for the first time. Once complete, our new survey is expected to triple the LMC PN population and have significant implications for the LMC PN luminosity function, kinematics, abundance gradients chemical evolution and, via study of the AGB halos, the initial to final mass relation for low to intermediate mass stars.
keywords:
Planetary Nebulae, Large Magellanic Cloud, AGB Halos.1 Introduction
The study of planetary nebulae (PNe), including determination of their physical properties and luminosity function, has been a difficult task in our galaxy due to inherent problems of accurate distance determination and the biases introduced by variable interstellar absorption. Such problems can be alleviated by studying PNe in a nearby galaxy such as the Large Magellanic Cloud (LMC).
The LMC, at a distance of 50kpc, is essentially a thin (500pc) disk inclined at only 35 degrees to our line of sight (van der Marel & Cioni 2001) so all LMC PNe can be considered to reside at a similar distance. Knowledge of this one fundamental property permits direct estimation and comparison of a significant number of LMC PN physical parameters. It also affords considerable astrophysical benefits by providing a single environment in which PN mass loss history (and hence that of intermediate to low mass stars) can be studied in detail in the context of both stellar and galactic evolution (Jacoby, 2005). Distance estimates are being further refined thanks to a variety of observational relations for stars in our own galaxy which are being applied to those in the LMC (e.g. via RR Lyrae variables, eclipsing binary stars, main sequence fitting and Mira variables - see Madore & Freedman 1998 for a review) promising further precision of measured PN physical parameters.
The observed reddening and extinction towards the LMC is comparatively low and uniform (e.g. Kaler & Jacoby, 1990) so that a more complete PN population can, in principle, be obtained. The LMC galaxy is also sufficiently small in angular extent that it can be studied in its entirety with a wide-field telescope such as the UK Schmidt Telescope (UKST). Furthermore, it is sufficiently close to enable PNe to be detected and resolved using current ground-based telescopes. LMC PNe can be observed with HST allowing morphological studies (Shaw et al. 2001) and central star measurements (e.g. Villaver et al. 2003). This data can be compared with sophisticated model calculations to allow refinement of nebular photo-ionization codes. These in turn allow the most accurate determination of absolute fluxes, measurement of chemical abundance variations (e.g. Dopita & Meatheringham 1991), determination of the mass and age of the central stars and the mass, physical size and age of the nebulae with their associated extended halos. Such precise calculations and the ability to directly compare nebula age to that of the central star will allow tests of models of late stellar evolution that would not otherwise be possible (Jacoby 2005).
The Magellanic Clouds are rich with compact emission-line sources such as WR, Be, LBV, Of, T Tauri and symbiotic stars, VV Cephei systems and PN. Prior to our recent work however, the number of LMC PNe remained modest (300) and comprised a small fraction of the expected total (, Jacoby 1980). Furthermore, the current samples comprise a heterogeneous compilation from surveys with varying depth, selection technique, detection efficiency and spatial coverage. This makes them of limited use for the unbiased estimation of key PN parameters necessary to study their evolution, that of their host galaxy and the associated inter-stellar medium enrichment and mass loss history of their stars in a quantitative way.
However, based on the preliminary success reported here, a near complete sample of the LMC PN population is promised such that truly meaningful quantitative determinations of the PN luminosity function, distribution, abundances, kinematics and crucially mass-loss history, can be estimated precisely for the first time.
2 Previous LMC PN surveys: a brief review
Most early work on the LMC PN population was undertaken with a variety of modest, wide-field telescopes fitted with objective-prism dispersers. The first study was that of Henize (1956) who published the positions of 415 nebulae including 97 point-like emission sources which were considered to be PN candidates. Lindsay (1963) published 109 point-like H emission sources with no continuum from a sample of about 1000 emission objects. Where emission lines other than H were seen, the objects were classified as PN (65 objects). Westerlund and Smith (1964) surveyed 100 square degrees of the LMC with a blue objective prism on a 20/26 inch Schmidt telescope to produce a catalogue of 42 LMC PNe with photometric data, approximate coordinates and manually drawn finding charts. As a result of their efforts, the more luminous PNe in both clouds were identified and subjected to detailed studies such as those by Feast (1968) and Webster (1969). To this point however, the nature of most of the fainter objects detected in the above-mentioned surveys remained unknown or ambiguous.
Sanduleak, MacConnell and Phillip (1978), after a decade of amassing a collection of various types of deep objective-prism plates, produced another catalogue (SMP) comprising 102 PNe covering a large fraction of the LMC. The coordinates of the SMP survey are approximate to 1 arcmin with no finding charts. Although positions had to be re-established, it was the most complete list of confirmed PNe at that time and was therefore preferred to previous surveys.
Jacoby (1980) directly imaged 4 central regions of the LMC in [O iii] and H with the Cerro Tololo 4m telescope. This was deeper than any previous survey and produced 41 faint PN candidates. Equatorial co-ordinates and finding charts were presented with uncertainties 0.6 arcsec. Monochromatic fluxes were derived and used to determine the luminosity function for LMC PN as faint as 6 magnitudes below the brightest known. Although 2 candidates were previously known, a follow-up survey by Boroson & Liebert (1989) confirmed 13 as PNe.
Morgan (1984) used a new 2∘11′ objective-prism on the 1.2/1.8m UKST to study spectra of most of the known PNe in both clouds. This prism gave a dispersion of 880Å mm-1 at H 4861Å allowing good separation of the [O iii] doublet lines from each other and from H under good seeing conditions. A number of faint new PNe were discovered in regions not surveyed by Jacoby (1980). Where possible, the spectra were assigned excitation classes following the classification of Feast (1968).
Sanduleak (1984) found an additional 25 PN candidates (commonly denoted Sa) using deeper objective-prism plates centered on the central region of the LMC. Five objects were later rejected. These were double checked by Leisy et.al. (1997) who found that candidate Sa103 is a galaxy (as suspected by Sanduleak 1984) with z=0.035 while four objects could not be found again.
Morgan & Good (1992) and Morgan (1994), published 86 and 54 new PN candidates respectively from UKST objective prism plates to a continuum magnitude of B 19.5. Due to the increased depth, continua could now be seen on both new and many of the previously known PNe. Some PNe were known to have diameters large enough to be resolvable on UKST plates (Jacoby 1980, Wood et al. 1987). Approximately 12 per cent of PNe appeared extended on their plates, with full width diameters of 4 arcsec. Coordinate errors are quoted as typically 2-3 arcsec.
3 Problems with existing LMC emission object catalogues and the need for a new survey
The history of LMC PN searches has been biased through strong selection effects as well as being affected by identification and astrometric problems. This demonstrates the need for a homogenous, deep, well constructed LMC PN census with high astrometric integrity. After Henize (1956), subsequent H surveys were progressively deeper through use of better instrumental resolutions and observational configurations. While this improved sensitivity resulted in an increased number of emission-line detections, surveys continued to use single objective-prism plates and separated emission-line stars from nebulae according to whether a continuum could be seen adjacent to the H line. The deeper surveys moreover do not cover the full 25∘ square field occupied by the main bar of the LMC. Although the UKST is an excellent instrument for obtaining a complete survey of the LMC because of its wide-field coverage, the best dispersion available at H with an objective-prism is 2050Å/mm which is poor compared to normal spectroscopy.
H emission alone cannot distinguish between object types. Furthermore, many of the emission-line objects in these Schmidt surveys have not been observed spectroscopically (Morgan 1998). A single wide-field direct exposure in H easily reveals extended objects such as H ii regions. At the distance of the LMC, however, most PNe are effectively point sources thereby making them indistinguishable from normal stars. What was required was a high resolution LMC map in the H line and neighbouring continuum so that the emission line objects could be highlighted, as the difference between the two images. The continuum could be either a separate direct image from a broad waveband which may include but dilute H emission, or a single exposure through an objective prism. The last technique has been the most commonly employed. In crowded fields such as the LMC, however, it has suffered from the overlapping of sources and modest depth. Most survey work has therefore been done through restricted wavebands sufficiently narrow to minimise this problem. The faint stars which merged into the sky background on blended objective prism plates, then became separate individual objects. Where images continued to be blended, complex software was required to de-blend and match plates.
Due to the time lag often present between exposures of the same region, variable stars were revealed, appearing similar to PN candidates. They were identified firstly by comparison with other plates and also by comparison with other emission lines such as [O iii] 5007Å for PNe and HeII 4686Å for WR and symbiotic stars. As an example, several symbiotic stars discovered on the basis of objective-prism spectra with HeII 4686 emission and a red stellar continuum were found to be members of the above mentioned H catalogues (Morgan 1992).
To date 300 LMC PNe are known and have published [O iii] 5007Å photometry. Leisy et al. (1997) have used the SERC J sky Atlas to provide Bj broadband magnitudes for all the LMC PNe but these objects are extremely faint in the broad Bj survey waveband (21), with respect to the neighbouring population. In relative terms they are many times brighter and easier to measure in H light.
Until now there was no complete, deep, H-based PN catalogue for the LMC. However, the overall brightness of these objects in the light of H makes this wavelength an efficient discovery tool (Morgan 1998). Deep searches began in 1993 involving H filters with CCD detectors on large telescopes (Azzopardi 1993). The drawback however is that these systems only covered very small areas and were designed to produce highly detailed surveys of emission-line stars and small PNe in selected areas around objects such as clusters and associations. A deep, high resolution H survey of the whole LMC has been needed to identify the many emission-line stars fainter than the 14.5 mag. limit of the Bohannan & Epps (1974) survey, to detect low excitation PN not seen in the published [O iii] 5007Å based surveys and extend the PN searches to fainter limits.
Another ongoing LMC emission-line survey is being conducted by Smith (1998) which uses several interference filters including H in conjunction with a CCD detector on the Curtis Schmidt Telescope. The survey covers most of the central parts of the cloud, but, at 3 arcsec resolution, is designed for extended objects and is not ideal for point sources.
3.1 The new AAO/UKST H map of the LMC
As part of the AAO/UKST H (+ effectively [NII]) survey of the Southern Galactic Plane (Parker et al. 2005) an equivalent 40 field mini-survey of the entire LMC, SMC and surrounding regions was undertaken. The survey used an exceptional quality, monolithic, 70Å FWHM H interference filter (Parker & Bland-Hawthorn 1998) and fine grained Tech-Pan film as detector (Parker and Malin 1999) to yield a survey with a powerful combination of sensitivity, resolution and area coverage. The fast f/2.48 converging beam of the UKST is effectively even faster off-axis. Consequently, the pass-band of the narrow-band H-alpha filter shifts slightly to the blue at the field edges relative to the centers of the surveyed fields. The impact of this effect, though, is small, affecting only the wings of the [NII] 6584Å line (see Parker et al. 2005 for details).
Over the last few years, we have specially constructed additional deep, homogeneous, narrow-band H and matching broad-band ‘SR’ (Short Red) maps of the entire central 25∘ square of the LMC. These unique maps were obtained from co-adding twelve well-matched UK Schmidt Telescope 2-hour H exposures and six 15-minute equivalent SR-band exposures on the same field using high resolution Tech-Pan film. The ‘SuperCOSMOS’ plate-measuring machine at the Royal Observatory Edinburgh (Hambly et al. 2001) has scanned, co-added and pixel matched these exposures creating 10m (0.67 arcsec) pixel data which goes 1.35 and 1 magnitudes deeper than individual exposures, achieving the full canonical Poissonian depth gain, e.g. Bland-Hawthorn, Shopbell & Malin (1993). This gives a depth 21.5 for the SR images and 22 for H (Å-1) which is at least 1-magnitude deeper than the best wide-field narrow-band LMC images currently available. The influence of variable stars is alleviated and emulsion defects removed by median stacking exposures taken over a 3 year period. An accurate world co-ordinate system was applied to yield sub-arcsec astrometry, essential for success of the spectroscopic follow-up observations.
The survey is now photometrically calibrated (see section 6), and can be used to provide R and R H magnitude estimates for any emission sources detected. Table LABEL:Table_1 gives the details of all the UKST exposures used for stacking in this survey. The co-ordinates of the film centre in the B1950 equinox are RA and DEC . Exposure times and dates of exposures are also given.
| Plate No. | Date | LST | Filter | Exp. time | Grade |
|---|---|---|---|---|---|
| OR17777 F | 971021 | 0320 | OG 590 | 150 | a |
| HA17778 F | 971021 | 0349 | HA659 | 1200 | aI |
| HA17787 F | 971023 | 0355 | HA659 | 1200 | a |
| OR17790 F | 971024 | 0341 | OG 590 | 150 | a |
| HA17791 F | 971024 | 0408 | HA659 | 1200 | a |
| OR17793 F | 971025 | 0516 | OG 590 | 150 | a |
| OR17814 F | 971122 | 0516 | OG 590 | 150 | a |
| HA17815 F | 971122 | 0545 | HA659 | 1200 | a |
| HA17840 F | 971223 | 0404 | HA659 | 1200 | aI |
| HA17852 F | 971228 | 0440 | HA659 | 1200 | a |
| OR17853 F | 971228 | 0654 | OG 590 | 150 | a |
| HA18160 F | 981113 | 0511 | HA659 | 1200 | a |
| HA18179 F | 981129 | 0345 | HA659 | 600 | a |
| OR18180 F | 981129 | 0501 | OG 590 | 150 | a |
| HA18181 F | 981129 | 0530 | HA659 | 1200 | a |
| HA18678 F | 991207 | 0513 | HA659 | 1200 | a |
| HA18709 F | 000105 | 0426 | HA659 | 1200 | a |
| HA18712 F | 000110 | 0454 | HA659 | 1200 | a |

4 PN candidate selection technique
The full 25 square degree area of our LMC deep map was subdivided into 16 separate, non overlapping image cells on a 4 x 4 grid, each with x and y dimensions of approximately 1∘18′. Each image cell was stored as a Flexible Image Transport System (FITS) file, comprising 6985 x 6985 pixels. The total pixel image size for the full 25 square degrees of the LMC is 27940 x 27940 pixels requiring 2.9GB of disk space.
A world co-ordinate system was applied to the images through the K-ords program within the KARMA software package (Gooch 1996). A co-ordinate solution was achieved by matching small point sources at approximately 15 positions across a downloaded, astronomically calibrated SuperCOSMOS sub-image to the same positions on the SR and H UKST stacked images. An algorithm within the program then applied exactly the same co-ordinates to the new images. In terms of digitization, H/SR stacked images were perfectly matched to the broad-band images available on line through the SuperCOSMOS web site (http://www.wfau.roe.ac.uk/sss/). The transfer of co-ordinates was achieved with an accuracy of 0.087 arcsec (0.13 pixels) at the centre of the images, degrading to a displacement of 1.34 arcsec ( pixels) at the edges. Every source was subsequently double-checked and corrected for position with reference to the same area in the standard online R-band SuperCOSMOS digital catalogue.
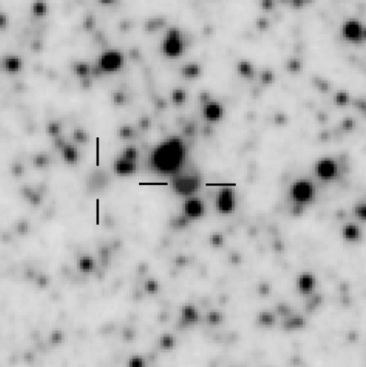
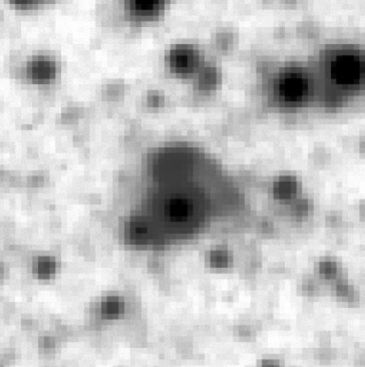
Candidate emission sources were found using an adaptation of a technique available within KARMA. The SR images were coloured red and merged with the H narrow-band images coloured blue. Careful selection of software parameters allowed the intensity of the matched H and SR FITS images to be perfectly balanced allowing only peculiarities of one or other pass-band to be observed and measured. Normal continuum stars become a uniform rounded pink/purple colour. Emission objects such as H ii regions and the halos surrounding PNe are strongly coloured blue while the broader point spread function (PSF) of emission-line stars in the light of H compared to their SR counterparts, allows them to be easily detected by the narrow extent of their faint blue auras, made clearly visible by the colour-merging software. For examples of how PN are revealed, see Figs. 6, 8 & 10.
Upon detection of a new source in the H/SR stacked and merged images, we checked and recorded the position in J2000 co-ordinates and the diameter observed on the stacked image in arcsec. We then commented whether or not the object shows a central source in the SR, considered the general appearance in relation to verified objects and added comments. All candidates were checked in SIMBAD and against all existing PN catalogues for any previous detections. Previously known objects were included in the overall catalogue which now represents a complete description of all the discrete, ′′ diameter emission objects seen in the UKST deep stacked H map. Using the above criteria, we began by broadly rating objects as either a candidate PN, emission-line star, variable star, H ii region, emission object or late-type star with a designation of either known, probable, possible or unlikely for each category. This probability rating was assigned to each newly detected emission candidate prior to spectroscopic confirmation to aid target prioritization.
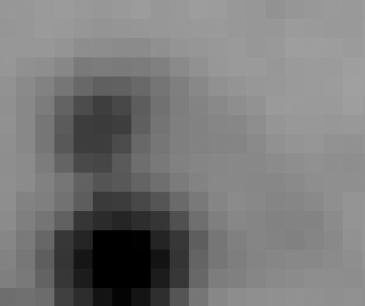
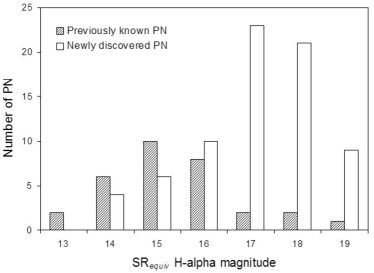
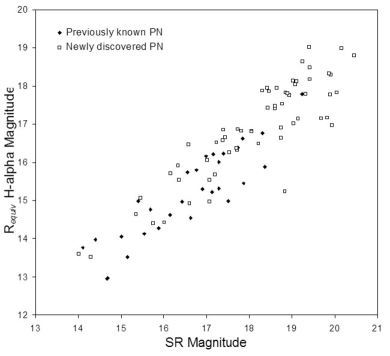
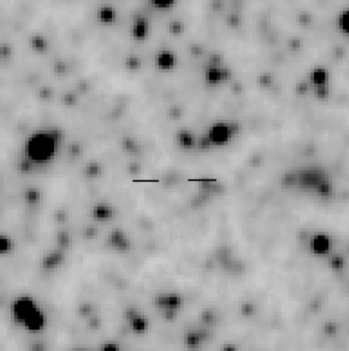
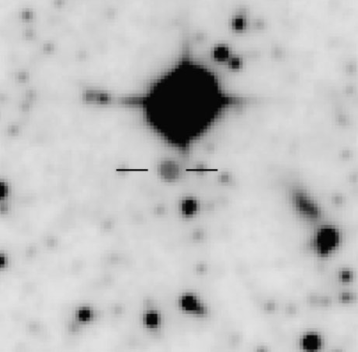
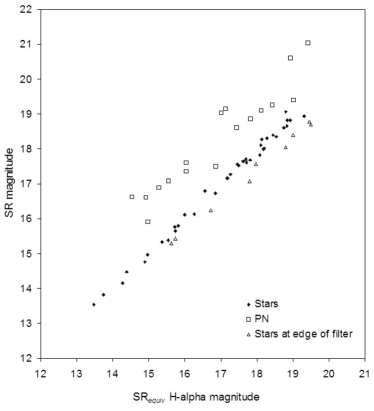
The veracity of the technique has been powerfully demonstrated (see Fig. 2) firstly, by the ease of independent re-identification of all previously known PNe in each studied region, no matter how faint (e.g. PNJ07 at mB21.7) and secondly, by the success of our AAT 2dF pilot study which confirmed 73 new LMC PNe (tables LABEL:Table_2 and LABEL:Table_4 and section 7).
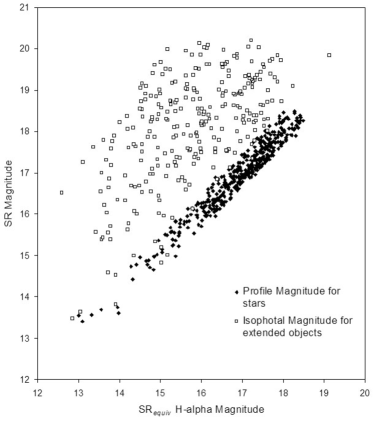
While we are extending the faint limit of the LMC PN luminosity function (Fig. 2), we are also contributing to the bright end with several confirmed new PNe brighter than R15. The SR versus SRequivH magnitude graph (Fig. 2) also reveals the depth of the new sample when H/SR magnitudes are compared. While most of the previously known PNe are scattered at the brighter (lower left) side of the plot, many are considerably brighter in H than SR as expected.
4.1 PN diameters on the stacked images
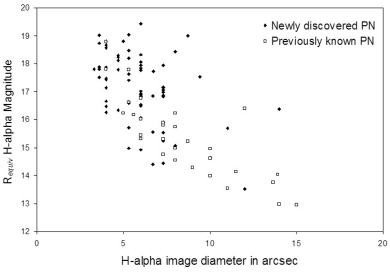
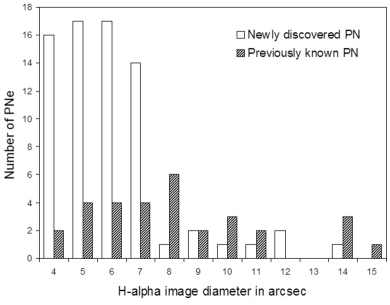
Fig. 4 combines the previously known and newly confirmed PNe in the studied region to show their comparative magnitude to size relation and growth function as measured in the stacked images. Diameters for both the previously known and newly discovered PNe were individually measured on the SR and H digitized maps using the Starlink GAIA package. All measurements were made at the default logarithmic intensity value in each band. While the UKST is able to resolve any unsaturated and extended object 4 arcsec diameter, point source objects bright in H increase in size on the H map as a function of flux and exposure time. With the addition of photographic film as the recording media, the bright point sources have an image diameter which grows above that expected from a pure point source (including a seeing disk convolution) as a direct function of magnitude. A PSF increase by bright PNe will therefore comprise a portion of the extended emission halos detected surrounding PNe in H. The magnitudes of previously known PNe display a tight relationship to the H diameter indicating how luminosity is affecting image size at the bright end of the luminosity function. The newly confirmed PNe, on the other hand, display a wider, more extended and fainter range of magnitudes per measured image diameter. Since they are unsaturated low surface brightness nebulae and halos, they are a truer reflection of angular size. They are therefore extending the previous limits to fainter and consequently more evolved types. Fig. 4 is a histogram showing the numbers of previously known and new PNe according to their measured image diameters. Many of the previously known PNe suffer an incremental increase in diameter due to the luminosity dependent PSF in the stacked H maps. The growth function approximates empirically to
where D is the image diameter in arcsec. This image effect has been caused by the high luminosity of most of these compact and young PNe. The majority of the new PNe are larger and fainter by comparison. Because most of them are 4 arcsec diameter, and faint, the UKST map is able to provide a truer, resolved diameter.
Within our initial 3.25∘ square survey area, the PSF of the H emission for known PNe is an average 2.69 times the diameter of the PNe as measured in the SR images. The same ratio for our newly confirmed PNe gives an average 2.29 times the SR diameter indicating the new sample are slightly fainter in H compared to SR. Conversely, many PNe, both known and newly confirmed, can only be faintly detected in the SR image and some not at all. Within the 2dF sampled area, discussed here, this applies to 4 of the 31 previously known PNe and 34 of the 73 newly confirmed PNe. In the colour combined images they appear as small, discrete blue nebulae (eg. RP442 in Fig. 6). By comparison, emission line stars have an H PSF only 1.65 times larger than the red image diameter. Visually therefore, the H halos for emission line stars are more compact and fade gradually at the edges. Variable stars appear to have an uneven mix of SR versus H emission in their halos. This is due to the time-averaging process of stacking the images taken over a three year period. Late-type stars are easy to detect due to the predominance of a pale mixture of the two colours and star-like appearance.
5 Discovery of LMC PN optical halos and their significance
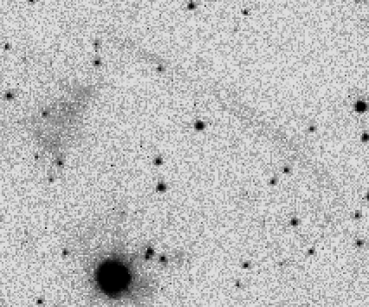
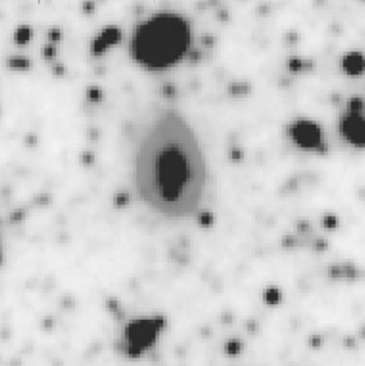
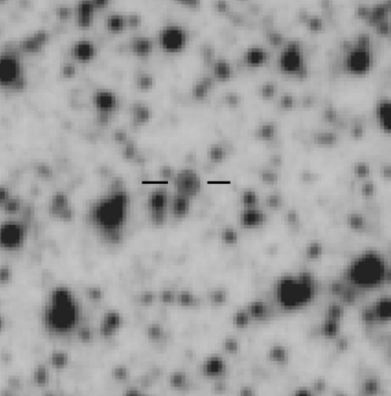
Perhaps the most exciting development is our detection, for the first time, of large, extended, optical halos around 60 per cent of both known and new LMC PNe. This fraction agrees with that determined by Corradi et al. (2003) from deep imaging of 35 elliptical Galactic PNe. In Fig. 10 we present a Hubble Space Telescope (HST) image of the LMC PN SMP27 which is the only previous LMC PNe for which a tentative halo detection was previously suggested (Shaw et al. 2001). Adjacent to this we present our H/SR combined image reproduced at the same scale. Our stacked image does not have the resolution of the HST but the data go as deep for low surface brightness features; the halo emission is clearly seen, matching that seen by the HST. In Fig. 10 we present a wider angle image of this same PN showing that the halo hinted at in the HST image in fact extends almost right around the central PN. Beside this image we also include a more typical example of a newly discovered LMC PN halo. RP142 in Fig. 8.
The typical halo radii range from 0.4 to 1.5 parsecs, in good agreement with that found for Galactic PNe by Corradi et al. (2003) despite significant distance uncertainties and also in agreement with the spread of faint halo radii predicted by Villaver et al. (2002) for a range of initial progenitor masses. Detection of these LMC PN halos, which essentially represents the AGB mass loss history, will provide a valuable tool to derive the initial to final mass ratio for stars 8M⊙.
6 Photometry
Along with the pixel data, SuperCOSMOS provides an Image Analysis Mode (IAM) file which contains 32 image parameters relating to each object (Hambly et. al. 2001). Within the IAM parameter sets for each object there are two instrumental magnitudes called COSMAG and PRFMAG. The COSMAG parameter is an isophotal magnitude (-2.5 log sum of intensities of thresholded pixels above sky) while the PRFMAG parameter is a ‘linearised’ profile magnitude computed following the prescription of Bunclark & Irwin (1983). The photometric calibration for stars is based on profile magnitudes, while integrated magnitudes for extended sources are calibrated isophotal magnitudes, sky divided and corrected to total magnitudes. Using the Starlink GAIA package, the IAM parameters for each object can be linked to the appropriate object in the image which is identified by an over-plotted ellipse. The ellipse contains the area used to produce the integrated sky subtracted magnitudes.
SuperCOSMOS magnitudes are calibrated to bright photometry from the Tycho-2 (Hog, 2000) and Guide Star Photometric Catalogues (Lasker, 1988), faint CCD standards from Croom et al. (1999), Boyle et al. (1995), Stobie et al. (1985), Cunow et al. (1997) & Maddox et al. (1990).
Although this method has provided roughly calibrated magnitudes for both the SR and H images, blended sources became a problem in the crowded field of the LMC. SuperCOSMOS fails to effectively de-blend multiple, closely spaced objects. For the blended PN candidates therefore, we decided to do individual, manual photometry on each object using GAIA and the PHOTOM package to try to improve the photometry. This allowed us to carefully place apertures around the exact perimeter of the object, avoiding the influence of nearby stars and diminishing the added flux from overlapping stars. This was achieved by careful calibration of PHOTOM parameters until test results on bright and faint stars returned identical results to the IAM magnitudes for our stacked SR image. We then used de-blended stars to test our stacked SR magnitudes against the same stars in our stacked H data. In the figure 12 test sample, we found that ordinary continuum stars show very good agreement between their measured SR and R H magnitudes when manual de-blended photometry is applied using the PHOTOM package. The average displacement between SR and R H magnitudes across the sample is 0.04 magnitudes with a standard deviation of 0.13 magnitudes. By comparison, the PN have an average displacement of 1.77 magnitudes and standard deviation of 0.23 magnitudes due to their brightness in H.
In the UKST stacked data, positional and magnitude-dependent systematic errors are present as a result of vignetting towards the corners of the image (Hambly et al. 2001). IAM stellar parameters also vary as a function of field position arising from variable PSF due to field rotation. Other common errors due to variations in emulsion sensitivity are alleviated by the multiple stacking process. Re-calibration of PHOTOM parameters is therefore required beyond any given area of 1∘ square. In our case the situation is further complicated by the use of the H interference filter which has a circular aperture of about 305mm diameter on the square glass substrate (see Parker et al. 2005). The circular edge of the H filter came very close to the 4 corners of the 25∘ square H exposure frame. This resulted in an incremental dimming effect from 18′ towards the extreme corners on the H map making magnitudes within these small zones unreliable. This effect, plus the above mentioned vignetting and field rotation effects, have also been measured using various magnitude ranges at the far edge of the usable H filter (see fig. 12). We find a maximum dimming effect of 0.56 of an H magnitude with a standard deviation of 0.18 magnitudes at the edge of the filter. This correction has been applied to the H magnitude of any PN found within this region.
A simple test was conducted to measure the accuracy of the magnitude parameters for both the H and SR stacked images. The IAM magnitude parameters for a sample of over 2,000 objects were extracted from a 25 square arcmin area near the centre of the LMC field. Matching of the H and SR IAM object positions was achieved using the Starlink CURSA package. Our selection criteria required object positions in both images to match to within 0.03 arcsec. Only these objects with perfectly matching positions were extracted. We then eliminated all blended objects. This left us with 402 objects identified as stars plus 275 extended objects. The resulting PRFMAG H and SR parameter values for the stellar objects were found to be in good agreement. The average magnitude difference between H and SR was 0.028 with a standard deviation of 0.22. The extended objects, including PNe, galaxies, discrete H ii regions and other emission objects, were plotted using the COSMAG parameter values. On average, the H magnitudes for the extended sources were brighter by 2.34 magnitudes with a standard deviation of 1.14. The results are plotted in Fig. 12.
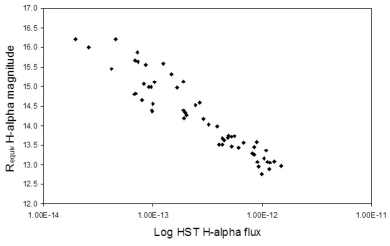
As an external test, we compared our H, R-equivalent image derived magnitudes with the MCPN published HST H fluxes (http://archive.stsci.edu/hst/mcpn/home.html) for known PNe in the LMC (Fig. 13). While the comparison of a photographic image magnitude (which includes the [NII] lines) with a ccd derived flux centered on H, cannot be expected to match perfectly, it does produce a reasonably even gradient.
The measured SuperCOSMOS SR magnitudes for the initial sample are given in tables LABEL:Table_3 and LABEL:Table_4. These magnitudes are the least likely to be affected by the added flux from overlapping stars. Where de-blending was performed, the image derived magnitudes have been indicated with a dagger. For only three objects (SMP72, RP590 and RP491), overlapping stars have obscured half or more of the visible PN.
Accurate calibrated flux measurements will also be obtained from our continuing program of follow-up slit spectroscopic observations over our sample of new PNe.
7 Confirmatory observations
Initial confirmation of a preliminary selection of LMC PN candidates was undertaken on 26th November 2003 using 2dF on the Anglo-Australian Telescope. A short 30 minutes of service time was sufficient to observe most of the candidates in a 2 degree diameter area centered on J2000 RA 05 44 46 Dec -70 33 20. 184 objects were observed within this area comprising all of our image cell ‘1,1’ and half of image cell ‘1,2’. On the 15th March 2004, another short service run on the AAT allowed us to observe a further 81 objects in image cell ‘2,1’, centered at position J2000 RA 05 29 20 Dec -70 52 25. In all, 265 objects have been observed in the three image cells indicated in Fig. 14. As well as our new PN candidates we included all known PN, emission-line stars, late-type stars, variable stars and small H ii bubbles in the region for confirmation of their spectral signatures. We were able to confirm all 31 previously known PN within the observed image cells and 73 new PN. The remaining emission sources included emission-line stars, H ii regions, late-type stars, variable stars and objects whose status remains uncertain (due to low S/N). The identification is shown in Table LABEL:Table_2. A further 270 emission sources lie in this area and will be published following spectral analysis. In such a rich field as the LMC, not every object can be included in one 2dF observation due to fibre spacing requirements on the field plate. The number density of the sources also results in fibres being unable to overlap each other and reach targets.
7.1 Position and spectroscopic confirmation of previously known PN
Of the near 300 PNe previously known to exist in the LMC, 168 fall within the 25 square degree area of our new UKST deep survey. Positions for all previously known PNe in our data showed very good agreement with positions provided by Leisy et al. (1997). We found that positions provided by earlier surveys (mostly using the FK4 system) were not sufficiently accurate when converted to the J2000 equinox. The K-view program in KARMA allowed us to find the position of peak intensity within both the stacked H/SR images and SuperCOSMOS on-line images allowing accurate positioning to 0.2 arcsec. Where objects have extended emission, with no visible core or range in flux intensity across the nebulae, we defined the physical centre of the visible object as our position reference.
In Table LABEL:Table_3 we present results of our 2dF spectroscopic observations of the 31 previously known PNe within the 2dF regions observed in this pilot study. These are presented in order to make direct [N ii]/H line ratio comparisons with our newly detected PNe in the same immediate LMC location. In successive columns we give the known name, followed by the right ascension and declination in J2000, the relative size of the central PN seen as a concentration in the SR once the H and SR are merged, PN dimension in the red image, PN dimension in the H image, an [N ii]6548+6583Å/H raw intensity ratio and the SR magnitude (section 6). The dimensions are image dimensions as described in section 4.1. Where one number is stated, the PN is morphologically round and the dimension represents the diameter. Where two numbers are stated, the first refers to the diameter of the long axis and the second is the diameter of the short axis. Previously known PN, MG79 has been omitted as we have found no spectral or visual evidence to indicate the presence of a PN.
7.2 Spectroscopic confirmation of new candidates
| Object | Previously | Newly |
| Known | Confirmed | |
| PN | 31 | 73 |
| Emission-line stars | 14 | 36 |
| Late-type stars | 8 | 44 |
| H ii regions | 7 | |
| Other stars | 2 | 5 |
| Variable stars | 5 | 2 |
| Emission objects of | ||
| unknown nature | 2 | 6 |
| SNR | 1 | |
| S/N too low for ID | 29 |
In Table LABEL:Table_4 we present our confirmed LMC PN discoveries by their RP catalogue name and newly assigned IAU nomenclature. Columns 3 and 4 list the RA and Dec in J2000, while column 5 presents the relative size of the central PN (excluding the halo) in terms of its central concentration once the SR and H images have been merged. Objects referred to as ‘H only’ in this column are not visible at all in the SR band once the H image has been merged (see section 4.1 and the example image of RP442 in Fig. 6). Columns 6 & 7 present the dimension in arcsec as measured separately in the SR and H images. The [N ii]6548+6583Å/H raw intensity ratio from the 2dF spectra and the SR magnitude (section 6) are presented in columns 8 & 9.
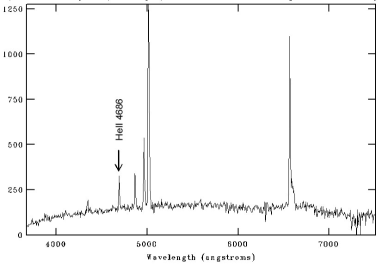
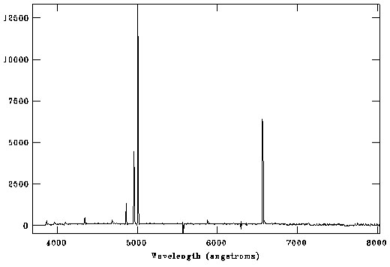
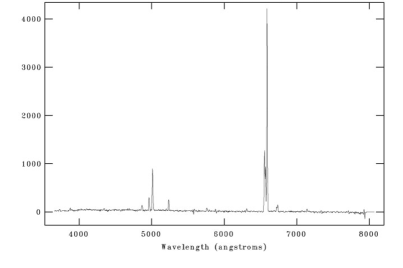
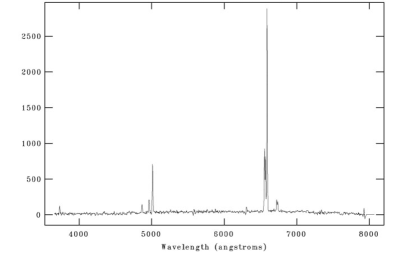
Candidates were selected as PNe by the combined examination of image parameters and spectra. In the spectra we examined the main ratios: I [O iii]5007Å/H, I [O iii]5007Å/H and I [N ii] 6583Å/H. We also measured the strength of the [SII](6716/6731Å) lines and took the presence of HeII 4686 into account as this indicates a high level of excitation, very rarely seen in H ii regions. Every other emission line present was also carefully measured. Allowance was made for a degree of continuum in the spectrum where we could see PNe partially hidden by intervening stars (2dF fibres are 2.5 arcsec in diameter).
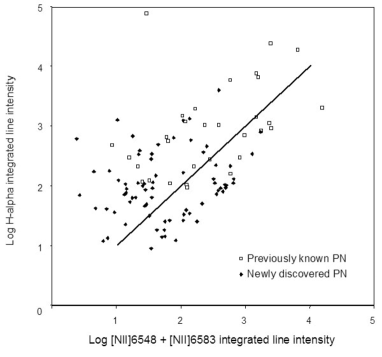
Fig. 15 shows an initial log plot of the [N ii] 6548 + 6583Å versus H raw, integrated, relative line intensities. A full description of ratios and excitation classes from the new sample across the entire LMC 25∘ square survey area will be presented in subsequent papers following completion of the spectroscopic followup and photo-ionization modelling.
8 The new LMC emission object catalogue
We have created a relational database to store and collate all the gathered LMC data for this project. This facilitates the collection of information such as probability ratings, diameters, magnitudes, chemical abundances and line ratios from our confirmatory spectroscopy. We can then create queries and reports based on any aspect of the stored data. Reports are created on each individual object which include a 50 square arcsec combined colour relief image and spectrum for instant confirmation. All previously known PN in the LMC have been included along with all their known names, magnitudes, fluxes and velocities.
In addition to the new and previously known PNe, the final catalogue will comprise over 2,000 emission sources including both known and newly discovered emission-line stars, WR stars, late-type stars, SNRs, small (bubble-type) H ii regions, variable stars and other emission objects. Accurate J2000 coordinates will accompany each object. The whole LMC PN catalogue, will be published and available on-line within the next 12 months complete with spectra and images for each source.
We are currently in the process of finishing a detailed spectroscopic followup of all remaining candidates. Results from these observations will be released through further papers in this series.
| Catalogue Name* | RA | Dec | Central PN | SR dim. | H dim. | [N ii]/H | SR mag |
| (J2000) | (J2000) | observed | (arcsec) | (arcsec) | intensity | ||
| SMP55, LM2-21, N199, LI924 | 05 22 40.96 | -71 19 06.7 | Medium | 7 | 11.410.4 | 0.23 | 15.5 |
| Mo24 | 05 22 53.20 | -71 05 40.7 | Point | 4 | 5.3 | 1.19 | 17.8 |
| SMP60 | 05 24 15.69 | -70 53 56.3 | Point | 6 | 86.6 | 0.07 | 16.5 |
| SMP59, LM2-25 | 05 24 27.35 | -70 22 23.7 | Small | 8 | 10 | 2.83 | 16.1 |
| MG43 | 05 24 34.29 | -71 13 39.6 | H only | 5.3 | 0.05 | ||
| SMP62, WS25, LM1-38, N201 | 05 24 55.04 | -71 32 55.4 | Large | 11.39.1 | 1412 | 0.10 | 14.6 |
| SMP65 | 05 27 43.83 | -71 25 56.0 | Point | 5.35 | 7.37 | 0.02 | 16.7 |
| MG51 | 05 28 34.41 | -70 33 01.6 | Point | 4.6 | 6 | 17.3 | |
| SMP68 | 05 29 02.85 | -70 19 24.8 | Small | 4.64 | 8.78 | 0.01 | 17.1 |
| Mo28 | 05 29 18.43 | -70 23 49.7 | Point | 4 | 5.3 | 1.04 | 17.4 |
| Sa120 | 05 29 32.70 | -70 17 39.0 | Point | 4 | 87 | 2.15 | 17.5 |
| Sa121 | 05 30 26.27 | -71 13 48.0 | Point | 4 | 6 | 1.07 | 17.8 |
| SMP71, N207 | 05 30 33.30 | -70 44 37.6 | Medium | 4.7 | 11 | 0.35 | 15.2 |
| SMP72 | 05 30 45.83 | -70 50 15.8 | H only | 7.36.4 | 0.08 | ||
| SMP73, N208 | 05 31 21.97 | -70 40 44.9 | Medium | 87 | 1513.2 | 0.2 | 14.6 |
| Mo33 | 05 32 09.28 | -70 24 41.5 | H only | 7.3 | 0.27 | ||
| Sa123, LM2-36 | 05 34 30.17 | -70 28 34.5 | Small | 5.7 | 10 | 2.18 | 16.4 |
| SMP80, LM2-37 | 05 34 38.95 | -70 19 55.5 | Medium | 4.6 | 9.4 | 0.1 | 15.9 |
| Mo35 | 05 38 04.62 | -70 29 25.9 | Small | 4 | 87 | 3.78 | 16.5 |
| Mo36 | 05 38 53.56 | -69 57 55.7 | Small | 65.2 | 87 | 1.38 | 17.1 |
| Mo37 | 05 39 14.47 | -70 00 18.6 | Point | 4 | 65 | 0.10 | 18.3 |
| LM2-40 | 05 40 37.60 | -70 27 54.97 | Point | 4.7 | 8 | 0.21 | 17.7 |
| MG73 | 05 41 36.61 | -69 27 09.8 | Small | 4.7 | 6 | 2.85 | 17.3 |
| MG76 | 05 42 24.24 | -69 53 05.1 | Medium | 4 | 5.3 | 0.11 | 16.9 |
| SMP88, LM2-42 | 05 42 33.24 | -70 29 23.2 | Large | 7.97.3 | 8.48 | 0.37 | 15.4 |
| SMP89, LM156, N178, WS38 | 05 42 37.00 | -70 09 31.1 | Large | 7.4 | 10 | 0.1 | 14.4 |
| Mo39 | 05 42 41.09 | -70 05 49.1 | H only | 4 | 0.76 | ||
| SMP90, LM2-43 | 05 44 34.76 | -70 21 40.5 | Medium | 6.34 | 7.46.8 | 1.39 | 16.9 |
| Mo40 | 05 46 25.29 | -71 23 22.3 | Point | 4 | 4 | 0.62 | 18.5 |
| SMP92, N170, LM1-58, WS39 | 05 47 04.37 | -69 27 32.9 | Large | 9 | 13.6 | 0.2 | 14.1 |
| SMP93, N181 | 05 49 38.75 | -69 09 59.3 | Large | 10.86.6 | 13.910 | 7.92 | 15.0 |
* Explanation of abbreviations used: LI: Lindsay (1963),
LM1: Lindsay & Mullan (1963), LM2: Lindsay & Mullan (1963),
MG: Morgan & Good (1992), Mo: Morgan (1994), N: Henize (1956),
SMP : Sanduleak et
al. (1978), Sa: Sanduleak (1984), WS: Westerlund & Smith (1964)
| Cat. Name | IAU Name | RA | Dec | Central PN | SR dim. | H dim. | [N ii]/H | SR mag |
| (J2000) | (J2000) | observed | (arcsec) | (arcsec) | intensity | |||
| RP590 | RPJ 052223-703355 | 05 22 23.98 | -70 33 55.9 | H only | 4 | 0.61 | ||
| RP478 | RPJ 052612-705855 | 05 26 12.92 | -70 58 55.4 | Medium | 5.54 | 76 | 3.71 | 16.3 |
| RP589 | RPJ 052637-702907 | 05 26 37.58 | -70 29 07.1 | H only | 5.3 | 0.25 | ||
| RP561 | RPJ 052639-710027 | 05 26 39.31 | -71 00 27.57 | H only | 4 | 0.66 | ||
| RP594 | RPJ 052711-702623 | 05 27 11.03 | -70 26 23.3 | H only | 4 | 0.55 | ||
| RP607 | RPJ 052803-704239 | 05 28 03.28 | -70 42 39.6 | H only | 4 | 2.72 | ||
| RP523 | RPJ 053005-711347 | 05 30 05.17 | -71 13 47.9 | H only | 5.3 | 0.33 | ||
| RP427 | RPJ 053010-704639 | 05 30 10.87 | -70 46 39.6 | H only | 7.36.7 | 4.69 | ||
| RP415 | RPJ 053157-704646 | 05 31 57.97 | -70 46 46.2 | Point | 4 | 4.7 | 0.02 | 19.9 |
| RP525 | RPJ 053229-711101 | 05 32 29.67 | -71 11 01.8 | H only | 7.66 | 3.93 | ||
| RP441 | RPJ 053242-703840 | 05 32 42.82 | -70 38 40.5 | Small | 4 | 7.3 | 3.37 | 18.0 |
| RP442 | RPJ 053251-703717 | 05 32 51.35 | -70 37 17.0 | H only | 4 | 0.19 | ||
| RP548 | RPJ 053308-711803 | 05 33 08.75 | -71 18 03.3 | Small | 7 | 4.7 | 17.7 | |
| RP604 | RPJ 053328-712450 | 05 33 28.13 | -71 24 50.7 | H only | 4.7 | 0.28 | ||
| RP603 | RPJ 053329-712451 | 05 33 29.62 | -71 24 51.0 | H only | 7 | 0.12 | ||
| RP499 | RPJ 053459-710606 | 05 34 59.44 | -71 06 06.8 | Point | 4 | 6 | 1.59 | 18.7 |
| RP530 | RPJ 053548-710627 | 05 35 48.68 | -71 06 27.1 | Small | 4 | 7.3 | 0.02 | 18.8 |
| RP491 | RPJ 053611-711719 | 05 36 11.39 | -71 17 19.1 | H only | 7.3 | 0.01 | ||
| RP577 | RPJ 053632-702925 | 05 36 32.84 | -70 29 25.7 | H only | 7.3 | 0.60 | ||
| RP232 | RPJ 053635-692228 | 05 36 35.22 | -69 22 28.7 | Medium | 4 | 6 | 0.17 | 18.0 |
| continued next page | ||||||||
| (cont’d) | ||||||||
| Cat. Name | IAU Name | RA | Dec | Central PN | SR dim. | H dim. | [N ii]/H | SR mag |
| (J2000) | (J2000) | observed | (arcsec) | (arcsec) | intensity | |||
| RP580 | RPJ 053638-702505 | 05 36 38.29 | -70 25 05.5 | Point | 4 | 6 | 1.4 | 18.6 |
| RP234 | RPJ 053641-692208 | 05 36 41.16 | -69 22 08.3 | Point | 43.4 | 64 | 0.13 | 18.2 |
| RP231 | RPJ 053649-692355 | 05 36 49.38 | -69 23 55.2 | Point | 4.7 | 4 | 0.05 | 16.5 |
| RP265 | RPJ 053700-692128 | 05 37 00.79 | -69 21 28.3 | Point | 4 | 5.44.5 | 2.16 | 16.4 |
| RP228 | RPJ 053706-692709 | 05 37 06.65 | -69 27 09.3 | Point | 4 | 4 | 0.04 | 17.9 |
| RP26 | RPJ 053707-701951 | 05 37 07.46 | -70 19 51.0 | H only | 43.5 | 0.11 | ||
| RP493 | RPJ 053710-712313 | 05 37 10.14 | -71 23 13.9 | Small | 4 | 4 | 0.09 | 17.5 |
| RP1040 | RPJ 053721-700408 | 05 37 21.05 | -70 04 08.40 | H only | 4 | 0.12 | ||
| RP1037 | RPJ 053725-694759 | 05 37 25.26 | -69 47 59.82 | H only | 4 | 0.56 | ||
| RP266 | RPJ 053727-690855 | 05 37 27.77 | -69 08 55.2 | Small | 5 | 9.6 | 0.09 | 15.3 |
| RP147 | RPJ 053729-700750 | 05 37 29.28 | -70 07 50.9 | small | 4.6 | 14 | 2.21 | 17.7 |
| RP25 | RPJ 053729-701633 | 05 37 29.44 | -70 16 33.0 | large | 5 | 6 | 3.1 | 16.6 |
| RP87 | RPJ 053810-703245 | 05 38 10.55 | -70 32 45.5 | H only | 7 | 6.92 | ||
| RP144 | RPJ 053838-701325 | 05 38 38.28 | -70 13 25.5 | H only | 54 | 3.99 | ||
| RP90 | RPJ 053840-701901 | 05 38 40.85 | -70 19 01.4 | Small | 4 | 4.64 | 0.30 | 18.4 |
| RP89 | RPJ 053856-702121 | 05 38 56.41 | -70 21 21.6 | Point | 64.6 | 64.6 | 0.25 | 18.6 |
| RP182 | RPJ 053905-695045 | 05 39 05.12 | -69 50 45.9 | H only | 7 | 1.03 | ||
| RP143 | RPJ 053931-700615 | 05 39 31.25 | -70 06 15.4 | Point | 4.73.6 | 119.3 | 4.56 | 17.2 |
| RP35 | RPJ 053950-712801 | 05 39 50.73 | -71 28 01.2 | Point | 4 | 7.26 | 4.3 | 19.1 |
| RP44 | RPJ 053956-710922 | 05 39 56.44 | -71 09 22.6 | Point | 4 | 5.34.6 | 0.54 | 18.6 |
| RP241 | RPJ 054020-691300 | 05 40 20.68 | -69 13 00.8 | Point | 4.7 | 6 | 0.06 | 17.7 |
| RP178 | RPJ 054028-695439 | 05 40 28.51 | -69 54 39.5 | Point | 4 | 4 | 0.16 | 19.3 |
| RP105 | RPJ 054045-702806 | 05 40 45.26 | -70 28 06.7 | Large | 118 | 12.69.3 | 0.10 | 14.0 |
| RP125 | RPJ 054053-704508 | 05 40 53.51 | -70 45 08.2 | Point | 4 | 6 | 3.91 | 19.8 |
| RP111 | RPJ 054127-703207 | 05 41 27.52 | -70 32 07.9 | H only | 5 | 2.48 | ||
| RP397 | RPJ 054152-702818 | 05 41 52.95 | -70 28 18.8 | H only | 5.34 | 7.09 | ||
| RP93 | RPJ 054202-702459 | 05 42 02.16 | -70 24 59.7 | Point | 4 | 5 | 5.94 | 17.3 |
| RP61 | RPJ 054226-704940 | 05 42 26.21 | -70 49 40.4 | Point | 4.6 | 6.5 | 4.64 | 17.5 |
| RP187 | RPJ 054236-694023 | 05 42 36.06 | -69 40 23.6 | H only | 7 | 0.32 | ||
| RP9 | RPJ 054236-702859 | 05 42 36.49 | -70 28 59.3 | H only | 5.7 | 0.60 | ||
| RP135 | RPJ 054238-700438 | 05 42 38.83 | -70 04 38.4 | Small | 4 | 4 | 5.32 | 19.4 |
| RP70 | RPJ 054302-703332 | 05 43 02.15 | -70 33 32.2 | H only | 8 | 3.7 | ||
| RP162 | RPJ 054317-695651 | 05 43 17.63 | -69 56 51.4 | H only | 6.1 | 0.522 | ||
| RP621 | RPJ 054346-705804 | 05 43 46.99 | -70 58 04.1 | H only | 8.77 | 0.32 | ||
| RP62 | RPJ 054422-704043 | 05 44 22.66 | -70 40 43.4 | Point | 4 | 6 | 0.17 | 21.0 |
| RP163 | RPJ 054428-695443 | 05 44 28.71 | -69 54 43.6 | H only | 6.7 | 0.18 | ||
| RP637 | RPJ 054437-691947 | 05 44 37.27 | -69 19 47.5 | H only | 5.3 | 0.4 | ||
| RP615 | RPJ 054519-711603 | 05 45 19.22 | -71 16 03.2 | Medium | 5.2 | 7.3 | 0.24 | 15.4 |
| RP77 | RPJ 054534-704303 | 05 45 34.15 | -70 43 03.93 | Small | 4 | 10 | 4.4 | 19.3 |
| RP620 | RPJ 054553-705516 | 05 45 53.27 | -70 55 16.0 | H only | 6 | 5.65 | ||
| RP1038 | RPJ 054606-700457 | 05 46 06.92 | -70 04 57.5 | H only | 4.5 | 4.14 | ||
| RP194 | RPJ 054621-693531 | 05 46 21.16 | -69 35 31.6 | H only | 4 | 4 | 2.98 | 18.6 |
| RP99 | RPJ 054623-702555 | 05 46 23.95 | -70 25 55.8 | Point | 4 | 5 | 0.05 | 19.4 |
| RP1955 | RPJ 054632-705534 | 05 46 32.63 | -70 55 34.0 | H only | 4 | 5.3 | 5.05 | 20.8 |
| RP1956 | RPJ 054639-705650 | 05 46 39.38 | -70 56 50.06 | Point | 4 | 5 | 0.15 | 17.4 |
| RP172 | RPJ 054653-695133 | 05 46 53.09 | -69 51 33.4 | H only | 4 | 4 | 3.08 | 20.4 |
| RP103 | RPJ 054701-702842 | 05 47 01.53 | -70 28 42.5 | Point | 4.6 | 65 | 5.166 | 17.2 |
| RP122 | RPJ 054728-702015 | 05 47 28.70 | -70 20 15.9 | Point | 4 | 9 | 2.35 | 18.7 |
| RP130 | RPJ 054819-700523 | 05 48 19.38 | -70 05 23.8 | Medium | 5.2 | 6 | 0.18 | 17.8 |
| RP129 | RPJ 054829-700846 | 05 48 29.12 | -70 08 46.5 | Medium | 9 | 12 | 0.08 | 14.2 |
| RP102 | RPJ 054920-702809 | 05 49 20.52 | -70 28 09.3 | Small | 4 | 6 | 5.51 | 18.9 |
| RP18 | RPJ 054953-700855 | 05 49 53.13 | -70 08 55.6 | Point | 4 | 4.7 | 0.13 | 19.1 |
| RP1957 | RPJ 055004-704035 | 05 50 04.33 | -70 40 35.44 | H only | 4.64 | 4.9 |
PNe magnitudes for which manual de-blended image
photometry was performed.
9 conclusion
We present initial results from the spectroscopic followup of LMC PN candidates in a 3.25∘ square area resulting in the confirmation of 73 new LMC PNe. Based on the preliminary results of this study, we expect to triple the number of LMC PNe. The availability of the stacked images has allowed us to observe 1 mag deeper than was previously available for the LMC. This has resulted in the discovery of bright and faint, compact and extended and young and evolved PNe. They can now be mined for their chemical abundances and line ratios. They will assist in kinematical studies and chemical abundance estimates for the LMC. They will also allow us to derive an accurate luminosity function for PNe in this galaxy which can be related to other Hubble-type galaxies. The ratio of [N ii]H (55 and 75 per cent) between the previously known and the new sample respectively shows that the new sample will be able to extend PNe with strong [N ii] ratios to fainter magnitudes. The discovery of extended AGB halos surrounding a large proportion of the surveyed PN will provide a valuable distance unbiased tool to assist in determining the initial to final mass ratio for stars 8M⊙. All these factors make the LMC PN population a unique and ideal sample for study.
10 acknowledgements
WR acknowledges Macquarie University for a PhD. scholarship to enable this research. We also thank the AAO for service time with 2dF on the AAT. We wish to thank Letizia Stanghellini and Richard Shaw for their kind permission to use the HST image. Finally we thank George Jacoby for his help and input during the review process for this paper.
References
- Azzopardi (1993) Azzopardi M., 1993, LNP., 416, 86A
- Bland-Hawthorn, Shopbell & Malin (1993) Bland-Hawthorn J., Shopbell P.L., Malin D.F., 1993, AJ, 106, 2154B
- Bohannan & Epps (1974) Bohannan B.E., Epps H.W.1974, A&AS, 18, 47
- (4) Boroson T.A., Liebert J., 1989, ApJ, 339, 844
- (5) Boyle B.J., Shanks T., Croom S.M., 1995, MNRAS, 276, 33
- (6) Bunclark P.S., Irwin M.J., 1983, Proc. Statistical methods in Astronomy Symp., ESA SP-201, 195
- (7) Corradi R. L. M., Sch nberner D., Steffen M., Perinotto M., 2003, MNRAS, 340, 417C
- (8) Croom S. M., Ratcliffe A., Parker Q.A., Shanks T., Boyle B.J., Smith R.J., 1999, MNRAS, 306, 592
- (9) Cunow B., Duemmler R., Spiekermann G., Ungruhe R., Wargau W. F., 1997, A&AS, 125, 71
- (10) Dopita M.A., Meatheringham S.J., 1991, ApJ, 377, 480
- (11) Feast M.W., 1968, MNRAS, 140, 345
- (12) Gooch R., 1996, Astronomical Data Analysis Software and Systems V, A.S.P. Conference Series, Vol. 101, 1996, George H. Jacoby and Jeannette Barnes, eds., p. 80.
- (13) Hambly N. C., MacGillivray H. T., Read M. A., Tritton S. B., Thomson E. B., Kelly B. D., Morgan D. H., Smith R. E., Driver S. P., Williamson J., and 4 coauthors, 2001, MNRAS, 326, 1279H
- (14) Henize K.G., 1956, ApJS, 42, 1
- (15) Hog E., Fabricius C., Makarov V.V., Urban S., Corbin T., Wycoff G., Bastian U., Schwekendiek P., Wicenec A., 2000, A&A, 355, L27
- (16) Jacoby G.H., 1980, AJ Suppl. Series, 42, 1
- (17) Jacoby G.H., Walker A.R., Ciardullo R., 1990, ApJ, 365, 471
- (18) Jacoby G.H., 2005, in conf. proc. ”Planetary nebulae beyond the milky way” ed. J. Walsh, in press
- (19) Kaler J.B., Jacoby G.H., 1990, BAAS, 22R 1249K
- (20) Lasker B.M. et al., 1988 ApJS, 68, 1
- (21) Leisy P., Dennefeld M., Alard C., Guibert J., 1997 A&AS, 121, 407-438
- (22) Lindsay E.M., 1963, Irish AJ, 6, 127
- (23) Lindsay E.M., Mullan D.J., 1963, Irish AJ, 6, 51
- (24) Maddox S.J., Efstathiou G., Sutherland W. J., 1990, MNRAS, 246, 433
- (25) Madore B.F., Freedman W.L., 1998, salg. conf. 263M
- (26) Meatheringham S.J., Dopita M.A., 1991, ApJS, 75, 407
- (27) Morgan D.H., 1984, MNRAS, 208, 633-643
- (28) Morgan D.H., 1992, MNRAS, 258, 639-646
- (29) Morgan D.H., Good A.R., 1992, A&AS 92, 571
- (30) Morgan D.H., 1994, A&AS 103, 235
- (31) Morgan D.H., Parker Q.A., 1998, 296, 921M
- (32) Parker Q.A., Bland-Hawthorn J., 1998, PASA, 15, 33p
- (33) Parker Q.A., Malin D., 1999, PASA, 16, 288P
- (34) Parker Q.A., et. al., 2005, MNRAS, 362, 689
- (35) Sanduleak N., MacConnell D.J., Davis Philip A.G., 1978, PASP, 90, 621
- (36) Sanduleak N., 1984, Structure and evolution of the Magellanic Clouds, IAU Symp. 108, 231
- (37) Shaw R.A., Stanghellini L., Mutchler M., 2001, AJ, 548, 727
- (38) Smith R.C., et al., 1998, PASA 15, 163
- (39) Stobie R.S., Sagar R., Gilmore G., 1985, A&AS, 60, 503
- (40) van der Marcel R.P., Cioni M-R.L., 2001, AJ, 211, 1807V
- (41) Vassiliadis E., Dopita M.A., Morgan D.H., Bell J.F., 1992, AJ Suppl.Ser., 83, 87-109
- (42) Villaver E., Manchado A., Garc a-Segura G., 2002, ApJ, 581, 1204V
- (43) Webster B.L., 1969, MNRAS, 143, 79
- (44) Westerlund B.E., and Smith L.F., 1964, MNRAS, 127, 449
- (45) Wood P.R., Meatheringham S.J., Dopita M.A., Morgan D.H., 1987, ApJ, 320, 178