Extracting star formation histories from medium-resolution galaxy spectra
Abstract
We adapt an existing data compression algorithm, MOPED, to the extraction of median-likelihood star formation histories from medium-resolution galaxy spectra. By focusing on the high-pass components of galaxy spectra, we minimize potential uncertainties arising from the spectro-photometric calibration and intrinsic attenuation by dust. We validate our approach using model high-pass spectra of galaxies with different star formation histories covering the wavelength range 3650–8500 Å at a resolving power of . We show that the method can recover the full star formation histories of these models, without prior knowledge of the metallicity, to within an accuracy that depends sensitively on signal-to-noise ratio. The investigation of the sensitivity of the flux at each wavelength to the mass fraction of stars of different ages allows us to identify new age-sensitive features in galaxy spectra. We also highlight a fundamental limitation in the recovery of the star formation histories of galaxies for which the optical signatures of intermediate-age stars are masked by those of younger and older stars.
As an example of application, we use this method to derive average star formation histories from the highest-quality spectra of typical (in terms of their stellar mass), morphologically identified early- and late-type galaxies in the Early Data Release (EDR) of the Sloan Digital Sky Survey (SDSS). We find that, in agreement with the common expectation, early-type galaxies must have formed most of their stars over 8 Gyr ago, although a small fraction of the total stellar mass of these galaxies may be accounted for by stars with ages down to 4 Gyr. In contrast, late-type galaxies appear to have formed stars at a roughly constant rate. We also investigate the constraints set by the high-pass signal in the stacked spectra of a magnitude-limited sample of 20,623 SDSS-EDR galaxies on the global star formation history of the Universe and its distribution among galaxies in different mass ranges. We confirm that the stellar populations in the most massive galaxies today appear to have formed on average earlier than those in the least massive ones. Our results do not support the recent suggestion of a statistically significant peak in the star formation activity of the Universe at redshifts below unity, although such a peak is not ruled out.
keywords:
methods : data analysis – galaxies: statistics – galaxies: evolution – galaxies: stellar content1 Introduction
Modern spectroscopic galaxy surveys such as the 2dF Galaxy Redhift Survey (Colless et al., 2001) and the Sloan Digital Sky Survey (SDSS, Stoughton et al. 2002) are collecting hundreds of thousands of medium-resolution spectra of galaxies in the nearby universe. At higher redshift, the VIRMOS-VLT Deep Survey (Le Fèvre et al., 2001) and the Deep Extragalactic Evolutionary Probe (Davis et al., 2003) are collecting the spectra of nearly 200 000 galaxies in the younger universe. The high-quality spectra gathered by these surveys exhibit a myriad of stellar absorption features containing valuable information about the physical properties of the galaxies, such as age, star formation history, metallicity and dust content. The extraction of this information from medium-resolution galaxy spectra is essential for improving current constraints on galaxy evolution.
Stellar population synthesis, the modeling of the light emitted by specific populations of stars, is a natural approach to interpreting observed galaxy spectra in terms of physical parameters. Until recently, the spectral resolution of standard population synthesis codes was typically 3–10 times lower than that achieved in modern spectroscopic galaxy surveys ( for the SDSS). Thus, for spectral analyses to be performed, observed high-quality galaxy spectra had to be degraded to the resolution of the models, resulting in the loss of valuable high-frequency information. The advent of new models with higher spectral resolution has opened the door to more refined spectral analyses (Vazdekis 1999; Bruzual & Charlot 2003). For example, the ability to model in detail the 4000 Å discontinuities and H absorption indices of more than SDSS galaxies allowed Kauffmann et al. (2003) to derive useful constraints on the mass fraction of stars formed in recent bursts in these galaxies. The next step is to identify the information provided by the entire medium-resolution spectrum on the star formation history, metallicity and dust content of a galaxy.
The extraction of physical parameters from large numbers of medium-resolution galaxy spectra requires the development of dedicated techniques. Several algorithms have been designed to efficiently ‘compress’ galaxy spectra into a reduced number of parameters with minimum loss of information. Such algorithms include, for example, principal component analysis (Ronen et al., 1999), Fisher matrix analysis (Tegmark et al., 1997) and information bottleneck (see Lahav 2001 for a review). Some of these algorithms have also been used to classify galaxy spectra, complementing pure classification methods such as trained neural networks. So far, however, these methods have not been used to extract physical parameters from medium-resolution galaxy spectra.
In this paper, we use an original approach to extract star formation histories (and rough constraints on the metallicities) from medium-resolution galaxy spectra. Our approach relies on the existing algorithm MOPED111The MOPED algorithm has a patent. (Multiple Optimised Parameter Estimation and Data compression) developed by Heavens et al. (2000), which allows one to compress galaxy spectra into a reduced number of linear combinations connected to ‘physical parameters’ (for example, the mass fraction of stars in a given age range). MOPED has been used in the past to recover star formation histories, metallicities and dust contents from low-resolution galaxy spectra (Reichardt et al., 2001; Panter et al., 2003). The originality of our work consists in combining MOPED with a recent stellar population synthesis model of medium resolution (Bruzual & Charlot, 2003, hereafter BC03). We focus on the high-pass components of galaxy spectra, which allows us to minimize potential uncertainties arising from the spectro-photometric calibration and from the intrinsic attenuation by dust. This requires us first to remove any contamination of the high-frequency signal by nebular emission lines. Our approach also differs from previous applications of the MOPED algorithm in that we compute full likelihood distributions of physical parameters and do not rely on acceleration techniques to selectively explore the parameter space. This allows us to construct more realistic confidence intervals for the derived star formation histories than has been previously possible.
We show that our method succeeds in recovering the star formation histories from a variety of model galaxy spectra, to an accuracy that increases with signal-to-noise ratio. We investigate the spectral features that are most sensitive to stars in various age ranges, excluding those regions of the optical spectrum that are known to depend strongly on changes in metal abundance ratios. We also point out a fundamental limitation in the spectral interpretation of galaxies for which the optical signatures of intermediate-age stars are masked by those of younger and older stars. To illustrate the usefulness of our approach, we use it to interpret the spectra of galaxies with high signal-to-noise ratios in the SDSS early data release (EDR). We find that, in general, galaxies with high concentrations typical of early-type galaxies appear to have formed the majority of their stars prior to , while late-type, low-concentration galaxies appear to have formed stars at a roughly constant rate at all times. From the analysis of the stacked spectra of a magnitude-limited sample of 20,623 SDSS-EDR galaxies, we can also investigate the global cosmic star formation history of the Universe. Our results confirm previous evidence that the stars that end up in massive galaxies today formed on average earlier than those that end up in low-mass galaxies (Heavens et al. 2004; see also Cowie et al. 1996; Kodama et al. 2004; Kauffmann et al. 2004). Our analysis does not reveal any statistically significant peak in the integrated star formation activity of the Universe at redshifts less than .
The paper is organized as follows. In Section 2, we describe our approach and the population synthesis models we rely on. We also recall the main features of the MOPED algorithm. In Section 3, we use model simulations to evaluate the extent to which star formation histories can be recovered from medium-resolution galaxy spectra. We also investigate the spectral features that are most revealing of stars in various age ranges. In Section 4, we first derive star formation histories from individual, high-quality spectra of high- and low-concentration galaxies in the SDSS EDR. We also investigate the typical star formation histories of high- and low-concentration galaxies, based on the analysis of stacked spectra. We complement this with a study of the overall star formation history of the Universe using a sample of 20,623 galaxies from the SDSS EDR. Our conclusions are summarized in Section 5. Throughout this paper, we adopt a Friedmann-Robertson-Walker cosmology with , and .
2 The method
We summarize here our approach for extracting physical parameters from medium-resolution galaxy spectra. We first briefly review the main features of the compression algorithm MOPED and how we adapt it to interpret the high-pass signal in galaxy spectra. We describe the physical parameters of interest to us and how we estimate their likelihood.
2.1 The MOPED algorithm
MOPED is a linear compression algorithm, which efficiently reduces a large array of data points into an arbitrarily small number of key parameters. Such an algorithm is ideally suited to the extraction of physical parameters from medium-resolution galaxy spectra. We refer the reader to the original paper of Heavens et al. (2000, see also ) for a more detailed description than given in the following summary.
-
•
In MOPED, the compression of a galaxy spectrum (defined as a vector of fluxes per unit wavelength) into a small number of physical parameters – for example, the mass fraction of stars in a given age range – is represented by a vector of elements , defined by .
-
•
The weighting vectors are specific to the spectrum . They quantify in an optimal way the sensitivity of the flux at each wavelength to variations in the parameter, taking into account the noise associated to . The construction of the weighting vectors requires a population synthesis model to compute the derivatives of the flux at each wavelength with respect to each physical parameter. In practice, for the sake of efficiency, these derivatives are estimated at a single point in the parameter space called the ‘fiducial model’ (see Section 2.4.1 below). The resulting vectors contain information about the spectral features most sensitive to the parameter , given the noise pattern.
-
•
Once the weighting vectors are determined, the probability distributions of the parameters given the spectrum may be evaluated by computing the likelihood of each (compressed) model in the parameter space, according to the norm of the vector .
The MOPED compression would not cause any loss of information about the parameters if these had Gaussian likelihood distributions, and if the fiducial model corresponded for each to the best fit model that would be obtained without compression. In most applications however, these criteria are not met (Section 2.4.2). It is also worth noting that, because the weighting vectors are obtained recursively in a process similar to a Gram-Schmidt orthonormalization of independent vectors, the values of the weights may depend on the order in which the parameters are considered. This is especially true when some spectral features present similar sensitivities to several parameters (see also Section 2.3.2). We have found that, in general, our results are relatively robust to changes in the order in which the weighting vectors are evaluated. We therefore adopt here the natural order used by Reichardt et al. (2001) and Panter et al. (2003), which consists in evaluating the sensitivity of the spectrum to the oldest stars first, and then proceed with younger stars.
As mentioned in Section 1, the MOPED algorithm has already been used to extract star formation histories from low-resolution spectra of galaxies in the Kennicutt (1992) atlas and the SDSS survey (Reichardt et al., 2001; Panter et al., 2003). In the remainder of this section, we describe our application of this algorithm to the interpretation of medium-resolution galaxy spectra.
2.2 Medium-resolution galaxy spectra
To interpret medium-resolution galaxy spectra with MOPED, we rely on the recent population synthesis code of BC03. This is based on the Le Borgne et al. (2003) library of observed stellar spectra and has a resolution of 3 Å across the whole wavelength range from 3200 Å to 9500 Å (corresponding to a median resolving power and a nominal velocity dispersion of 70 km s-1), for a wide range of metallicities (). Since we are interested here in the interpretation of SDSS galaxy spectra (see Section 4), we restrict our analysis to the wavelength range from 3650 to 8500 Å, where the noise is lowest in the rest-frame SDSS spectra. To speed up the analysis, we increase the wavelength sampling of the BC03 model spectra from the original 1-Å sampling to a 3-Å sampling. Furthermore, in all applications below, we always use model spectra broadened to a velocity dispersion consistent with that of the galaxy under study.
The observed stellar spectra incorporated in the BC03 models come from nearby stars with solar abundance ratios. However, stars in external galaxies are known to exhibit changes in heavy-element abundance ratios. In particular, the ratio of elements to iron appears to be enhanced in massive early-type galaxies relative to the solar composition (e.g., Worthey et al. 1992; Eisenstein et al. 2003). To increase the applicability of our models to the interpretation of observed galaxy spectra, we choose to mask out those regions of the optical spectrum that are known to strongly depend on changes in metal abundance ratios.
BC03 used a large library of model star formation histories to fit strong atomic and molecular features in the highest-quality spectra of the SDSS EDR. They considered the 25 commonly measured spectral features of the ‘Lick system’ that were defined and calibrated in the spectra of 460 Galactic stars in the wavelength range from 4000 Å to 6400 Å (Worthey, 1994; Worthey & Ottaviani, 1997; Trager et al., 1998). As expected, the Lick features that are the least well fitted by the BC03 models in the SDSS spectra are those Thomas et al. (2003) found to depend most strongly on changes in . We therefore exclude from our analysis the spectral bandpasses corresponding to the Lick features found by Thomas et al. (2003) to be most sensitive to changes in . These are Mg1, Mg2, Fe4383, Fe5335 and Fe5406. The wide TiO1 and TiO2 features are also not always well reproduced by the BC03 models in the highest-quality SDSS spectra. However, we keep them in the present analysis because they are thought to depend less strongly on (Thomas et al., 2003). We also do not exclude the spectral bandpasses defining other Lick indices, which sometimes overlap with the bandpasses of Mg1, Mg2, Fe4383, Fe5335 and Fe5406. In summary, the spectral windows we exclude from our analysis are 4363–4424 Å, 4445–4458 Å, 4897–4958 Å, 5071–5135 Å, 5157–5199 Å, 5318–5367 Å and 5377–5425 Å, corresponding to a total spectral width of 338 Å.
Our main motivation in the present study is to identify the constraints set by the high-pass signal222In this paper, we use the term ‘high pass’ to designate that part of a galaxy spectrum containing high-frequency information. We prefer the term ‘high pass’ over ‘high frequency’ because we do not strictly perform true frequency filtering. in galaxy spectra on the past history of star formation. We choose not to include the low-pass components of galaxy spectra for several reasons. Firstly, the low-pass signal is strongly affected by dust attenuation and potential spectro-photometric inaccuracies, which introduce unwanted uncertainties in the derived star formation histories. Secondly, population synthesis models with medium spectral resolution have only recently become available, and it is important to establish the extent to which the high-pass signal helps us constrain the physical parameters of galaxies. Finally, the MOPED algorithm has already been used to interpret low-resolution galaxy spectra in terms of star formation histories (see Section 2.1).
We compute the high-pass component of a galaxy spectrum (either modelled or observed) by first smoothing with a top-hat kernel of smoothing diameter Å. This yields the low-pass spectral component
| (1) |
The high-pass component may then be obtained as either
| (2) |
or
| (3) |
Equation (2), which was used by Baldry et al. (2002), preserves the equivalent widths of individual spectral features. There is no strong a priori motivation for using equations (2) or (3) to compute the high-pass components of galaxy spectra. Equation (3), which would be preferred if we achieved true frequency filtering, appears to perform better in the recovery of star formation histories in model simulations. We therefore use it throughout this paper to compute high-pass galaxy spectra (we have checked that using equation 2 would not affect our main conclusions). Since the noise associated to the low-pass component is negligible relative to that associated to the high-pass component, the signal-to-noise ratio per pixel in the high-pass spectrum is virtually the same as that in the original spectrum.
The high-pass galaxy spectra obtained using equation (3) must be normalized for the purpose of comparisons between models and observations. Ideally, the normalization should be achieved in a band which traces the total stellar mass of the galaxy. In practice, we are limited by the wavelength coverage and redshifts of the SDSS spectra we plan to analyze. We have found that the rest-frame 6000–7300 Å band provides a good compromise and therefore normalize all spectra below in this wavelength range. All results presented here are based on a Chabrier (2003) initial mass function with lower and upper cutoffs 0.1 and 100 .
2.3 Physical parameters
We now describe the physical parameters we wish to recover from medium-resolution galaxy spectra. We are primarily interested in the past history of star formation. We also derive constraints on the stellar metallicity and mention the potential of our approach for constraining the attenuation of starlight by dust in galaxies.
2.3.1 Star formation history
We characterize the star formation history of a galaxy by constraining the evolution of the star formation rate in 6 consecutive age bins. Ideally, these age bins should correspond to significant changes in the spectral characteristics of the stars, such as those arising through the onset of red supergiants, bright asymptotic giant stars, late-B and A stars with strong H-Balmer absorption lines, and red giant branch stars of different temperatures.333Reichardt et al. (2001) and Panter et al. (2003) use 8 age bins to describe the star formation history of a galaxy in their analysis of low-resolution spectra using MOPED. While the computationally more demanding interpretation of medium-resolution spectra prevents us from using such a large number of bins, we find that adopting more than 6 bins does not statistically improve the constraints we derive on the star formation history. This is because the spectral signatures of stars of too similar ages cannot be easily distinguished, even at medium resolution. After some experimentation, we settled on the following age bins to characterize the star formation history of a galaxy over the period from the age of the Universe to the present time: [13.5–8], [8–4], [4–1.5], [1.5–0.5], [0.5–0.1] and [0.1–0] Gyr. Within each bin, star formation is assumed to proceed at a constant rate. The relative ‘amplitude’ of a bin then determines the fraction of the total stellar mass of a galaxy that formed at the epoch corresponding to that bin.
The sampling of galaxy star formation histories in the MOPED algorithm is defined by the possible combinations of star formation amplitudes in the above 6 age bins. We have chosen 6 levels of star formation amplitude in each age bin, such that the fraction of the total stellar mass of a galaxy formed in any age bin be sampled in an optimal way among all possible star formation histories. For each of the 3 oldest age bins, we require that this fraction be linearly well sampled (i.e. with approximately equal numbers of models) by 6 values between 0 and 1. For each of the 3 youngest age bins, we require that it be logarithmically well sampled by 6 values between and 1 (we do not distinguish fractions of or less from zero star formation). To select the absolute star formation amplitudes providing the closest approximation to such a sampling in stellar mass fraction, we have used the non-negative least squares routine of Lawson & Hanson (1974). We find that 6 amplitudes per bin are sufficient to sample the parameter space in an adequate way. Adopting a computationally more expensive sampling of 8 amplitudes per bin does not significantly improve the accuracy to which the method can recover star formation histories from medium-resolution galaxy spectra (Section 3.2).
2.3.2 Metallicity
For the purpose of the present paper, we assume that stars of all ages in a given galaxy have the same metallicity. We interpret this as the ‘effective’ stellar metallicity (i.e., the metallicity of the stars dominating the light). This choice is motivated primarily by the fact that our models have solar heavy-element abundance ratios, while the abundance ratios of heavy elements are known to vary in external galaxies (e.g., Worthey et al. 1992; Eisenstein et al. 2003). As mentioned in Section 2.2, we exclude from our analysis the spectral features with the strongest identified dependence on changes in the /Fe abundance ratio. While we believe that this is sufficient for obtaining rough constraints on effective metallicities, we are less confident in the reliability of the models for recovering accurate metal enrichment histories from observed galaxy spectra. This caution is further justified by the fact that the signatures of metals are often similar in the spectra of stars with different ages. Allowing different metallicities for different age bins would therefore introduce an unwanted dependence of the results on the order in which the MOPED weighting vectors are computed (see Section 2.1). We note that the star formation histories derived in Sections 3 and 4 below are marginalized over effective metallicity (Section 2.4.2).
For simplicity, we consider here only 3 choices for the effective stellar metallicity of a galaxy: , and . These values are representative of the range in stellar metallicities inferred from the analysis of selected features with negligible dependence on /Fe in the spectra of SDSS galaxies (Gallazzi et al., 2004).
2.3.3 Attenuation by dust
The analysis presented in this paper, which relies on the interpretation of high-pass optical galaxy spectra, is largely exempt from the uncertainties arising from attenuation of starlight by dust in galaxies (Section 2.2). The potential weak effects of dust on the relative strengths of stellar absorption features are expected to affect only negligibly the star formation histories derived from high-pass galaxy spectra (see Section 3.2).
It is worth mentioning that our approach also provides a means of constraining attenuation by dust. The star formation history (and effective metallicity) derived from the high-pass spectrum of a galaxy can be exploited to predict the low-pass spectrum of that galaxy using dust-free population synthesis models. By comparing this low-pass spectrum with the observed one, it is possible to derive useful constraints on the attenuation by dust in the galaxy (for example, using the model of Charlot & Fall 2000). Unlike the analysis of the high-pass spectrum, this requires an accurate spectro-photometric calibration of the observed spectrum.
2.4 Statistical estimates of physical parameters
One of the main advantages of the MOPED algorithm over other techniques to interpret galaxy spectra is that it allows the derivation of statistical estimates of physical parameters. We outline below the way in which this is achieved in our models.
2.4.1 Choice of the fiducial model
In the MOPED algorithm, the fiducial model is the point of the parameter space where the weighting vectors describing the sensitivity of the spectrum to the various physical parameters are evaluated (Section 2.1). The vectors are constructed by computing the derivatives of the flux at each wavelength with respect to each parameter and accounting for the noise pattern.
The requirement in choosing the fiducial model is that its spectrum should contain as many spectral features as possible to constrain the different parameters of interest. To constrain the star formation history, the spectrum should therefore have clear signatures of stars in all age ranges. In the present study, the choice of the fiducial model is simplified by the fact that we are interested only in the high-pass components of galaxy spectra, as obtained by subtracting the low-pass components from the total spectra (equation 3). Also, in our models, galaxy spectra are simple linear combinations of the spectra of stellar populations of identical metallicity in 6 age bins (Section 2.3.1). Finally, we neglect any potential weak, non-linear effect of dust on high-pass galaxy spectra. All this implies that, at fixed metallicity and stellar velocity dispersion, the derivatives of the high-pass component with respect to physical parameters do not depend on the specific model (as characterized by the amplitudes of the stellar populations in the 6 age bins) at which they are evaluated, so long as this model includes contributions from all age bins.444It is interesting to note that this would not be the case if we had chosen equation (2) instead of equation (3) to compute high-pass galaxy spectra. In this case, the low-pass component would enter the expression of the derivatives of the high-pass component with respect to the physical parameters. We compute such a set of high-pass derivatives for each of the 3 metallicities considered here, , and , and for several stellar velocity dispersions between 70 and 300 km s-1 (Sections 2.2 and 2.3.2).
We take the noise spectrum entering the computation of the MOPED weighting vectors at the fiducial model to be that of the observed galaxy under study. The disadvantage is that this requires us to evaluate the weighting vectors for every galaxy in the observed sample.555Reichardt et al. (2001) and Panter et al. (2003) adopt a fixed, ‘average’ noise spectrum to interpret low-resolution galaxy spectra with MOPED. The reason for this refinment is to limit the loss of information about the physical parameters arising from the compression of the spectra. As emphasized by Heavens et al. (2000), the MOPED compression is optimal when the properties of the fiducial model are as close as possible to those of the observed spectrum.
2.4.2 Probability density functions
The likelihood that any model in the parameter space represents a given observed spectrum may be computed by comparing the compressed model and observed spectra as described in Section 2.1. If the likelihood distributions of the physical parameters were well approximated by multivariate Gaussian functions over the entire parameter space, sampling the neighbourhood of the most likely model would be sufficient to estimate the confidence intervals for these parameters. In our analysis, we have found that the likelihood distributions of the fractions of stars formed in different age bins is not necessarily well approximated by Gaussian functions. Thus, the parameter space must be explored more thoroughly to derive constraints on the star formation histories of galaxies.
Sampling the entire parameter space to evaluate the likelihood of every model given an observed spectrum is computationally demanding. For this reason, previous studies appealed to standard techniques such as ‘Monte-Carlo Markov Chains’ to selectively explore the parameter space and construct the likelihood distributions of physical parameters (Panter et al. 2003; see also Verde et al. 2003). In practice, such techniques rely on the sampling of the parameter space by a fixed, limited number of points. As a consequence, it is unclear whether the parameter space is always sampled in an adequate way to estimate the true probability density functions of physical parameters.
We choose here to favor the accuracy of error estimates over the reduction of computational cost and always explore the entire parameter space to compute the likelihood distributions of the different physical parameters. We first compute, for each metallicity, the Bayesian likelihood distribution of the fraction of stars in each age bin. This is evaluated by weighting each model by its probability and then summing the probabilities in bins of fraction of stars (see appendix A of Kauffmann et al. 2003). We then marginalize the likelihood distribution of the fraction of stars in each age bin over metallicity, by summing the likelihood distributions over the 3 metallicities , and . In this procedure, we assume that the 3 metallicities are equally probable a priori. We refer to the result of this sum as the probability density function of the fraction of stars in that age bin. By construction, this function includes the errors associated to the metallicity determination. We also obtain a rough estimate of the most likely metallicity of the galaxy by marginalizing the likelihood distributions obtained for each metallicity over star formation histories.
2.4.3 Priors
In our models, the prior distributions of the parameters are flat, reflecting a point of view of ‘maximum ignorance’. The fraction of stellar mass formed is uniformly distributed in each of the oldest 3 bins (ages Gyr) and logarithmically distributed in each of the youngest 3 bins (ages Gyr; see Section 2.3.1). In addition, the models are uniformly distributed in metallicity between , and (Sections 2.3.2 and 2.4.2). We find that our results are robust to changes in these prior distributions. For example, changing from a uniform to a logarithmic sampling of the stellar mass fractions (and conversely) has little effect on the derived star formation histories. Such an invariance is expected when the problem is well constrained.
3 Assessment of efficiency using model galaxy spectra
3.1 Outline
This Section is the core of the paper. Here, we use model simulations to assess the accuracy to which our method is able to recover star formation histories from medium-resolution galaxy spectra. For illustration, we parametrize the star formation history as a simple exponential law , where is the age of the galaxy and the time scale of star formation. We consider 3 models with 7 Gyr and (i.e. constant star formation rate), all with the same present galaxy age Gyr (correponding to the age of the Universe for the adopted cosmology). These simple models are often taken to represent the star formation histories of, respectively, E/S0, Sb/Sc and Sm/Im galaxies (e.g., Kauffmann & Charlot 1998). For simplicity, we assume that all 3 models have solar metallicity and a stellar velocity dispersion km s-1 (we discuss below the effects of changing these parameters). We consider two values of the median signal-to-noise ratio per pixel in the spectra, and . To be representative, the results presented here are always averaged over 50 independent realizations of the noise (increasing this number from 50 to 100 has a negligible effect on the results).
In Section 3.2 below, we evaluate how accurately our method can recover the star formation histories of these models, based on the analysis of high-pass spectra. Then, in Section 3.3, we point out a fundamental limitation in the recovery of the star formation histories of galaxies for which the optical signatures of intermediate-age stars are masked by those of younger and older stars. Finally, in Section 3.4, we highlight the spectral features that are the most sensitive to the presence of stars in various age ranges.
3.2 Recovery of star formation histories
We first consider the case of a model galaxy with a star formation time scale Gyr. This model is particularly interesting, because it corresponds to the expected time scale of star formation of the Universe when averaged over large volumes (e.g., Glazebrook et al. 2003; Brinchmann et al. 2004). We adopt for the moment and take the wavelength dependence of the noise to be that observed for a typical late-type galaxy in the SDSS (Section 4.1).
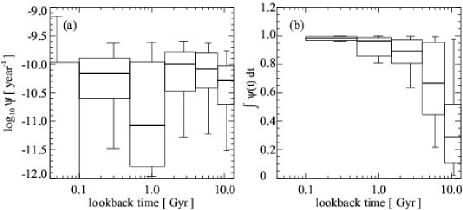
Fig. 1 shows the star formation history recovered from the high-pass spectrum of this galaxy using the method presented in Section 2. Each panel shows the average probability density function of the mass fraction of stars formed in a given bin of look-back time. This was obtained by summing the 50 probability density functions obtained for different realizations of the noise (see above). The results are shown in a more compact way in Fig. 2a, where we summarize the probability distribution in each age bin by the median value (thick line) and 16–84 (box) and 2.5–97.5 (error bars) percentile ranges. We stress that these ranges do not reflect the scatter in the median mass fractions recovered from 50 different realizations of the noise. Instead, for each age bin, the boxes and error bars in Fig. 2a indicate the 68 and 95 percent confidence intervals measured from the corresponding average probability density function of Fig. 1. These ranges would correspond to the and confidence intervals in the case of Gaussian distributions. For reference, the dotted lines in Fig. 1 and the triangles in Fig. 2a show the true fractions of stellar mass formed at the different look-back times in the input model. We recall that the probability distributions in Figs 1 and 2a include the uncertainties associated to the assumed unkown metallicity of the stars (Section 2.4.2). The solar metallicity of the model is recovered with 70 percent confidence.
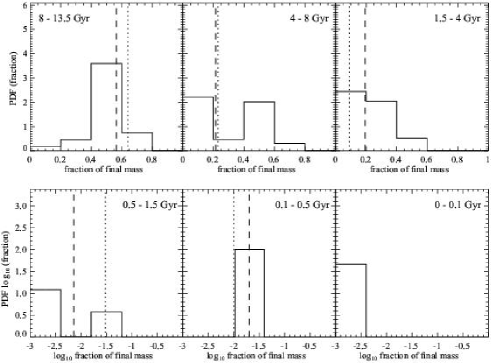
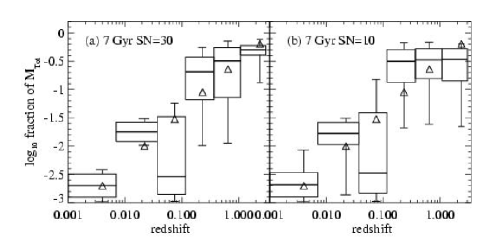
The results of Figs 1 and 2a indicate that, overall, the method recovers remarkably well the star formation history of the test galaxy. The true mass fraction of stars formed at different look-back times is always recovered within the 16–84 percent () confidence range predicted by the analysis. Some discrepancies exist between the recovered and true star formation histories. In particular, the mass fraction of stars with ages around 1 Gyr appears not to be well constrained. Its median value is underestimated, while the median mass fractions of stars in the adjacent age bins are overestimated. In Section 3.3 below, we show that this mismatch arises from a general limitation of the spectral interpretation of galaxies for which the optical signatures of intermediate-age stars (0.5–4 Gyr) are masked by those of younger and older stars.
The accuracy to which the star formation history can be recovered from high-pass galaxy spectra depends sensitively on the signal-to-noise ratio. Fig. 2b shows the same results as in Fig. 2a, but assuming a median signal-to-noise ratio per pixel of 10 instead of 30 in the input spectrum. In this case, the agreement between the predicted and the true star formation histories is significantly worsened. For example, the method cannot recover the differences in the relative fractions of stars in the oldest 3 bins. For , the results also become sensitive to the order chosen to construct the weighting vectors in the MOPED algorithm (Section 2).
The effect of increasing the velocity dispersion at fixed is expected to be similar to that of decreasing at fixed velocity dispersion. In practice, the amplitude of the effect depends on the type of stars dominating the light. For example, changing the velocity dispersion from our adopted 100 km s-1 to 300 km s-1 has only a weak effect on the results presented in Figs 2a and b.
We have also checked that attenuation by dust affects negligibly the results presented in Fig. 2. We used the simple but physically motivated model of Charlot & Fall (2000) to include the effects of attenuation by dust on the spectrum of the Gyr model galaxy. We adopted a typical -band effective absorption optical depth appropriate for SDSS galaxies (Brinchmann et al. 2004), for which we assumed standard fractions of 70 and 30 percent to arise from dust in giant molecular clouds and in the diffuse interstellar medium (Charlot & Fall 2000). For S/N=30, the median star formation history recovered from the high-pass spectrum of this model does not differ in any systematic way from that shown in Fig. 2a, the discrepancies between the two cases being less than 4 percent in all age bins.
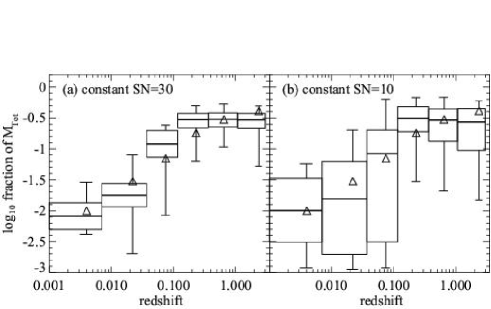
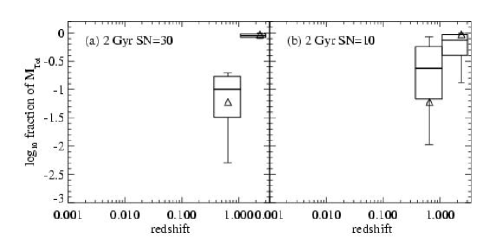
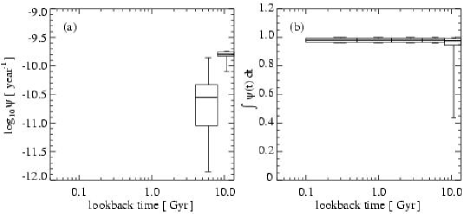
Figs 3 and 4 show further examples of the recovery of star formation histories from high-pass model galaxy spectra. Fig. 3 shows the results obtained for a galaxy with a constant star formation rate, while Fig. 4 shows those obtained for a galaxy with a star formation time scale of 2 Gyr. In the latter case, we take the wavelength dependence of the noise to be that observed for a typical early-type galaxy in the SDSS (Section 4.1). For , the method recovers quite well the star formation histories of both model galaxies (Figs 3a and 4a). The true mass fractions of stars in all age bins are recovered within the 16–84 percent () confidence ranges predicted by the analysis. We note that, for constant star formation rate (Fig. 3a), the fraction of stars with ages around 1 Gyr is somewhat better constrained than in the case of the 7 Gyr time-scale model (Fig. 2a). As before, reducing the signal-to-noise ratio from 30 to 10 degrades the quality of the results, especially for the relative fractions of stars in the oldest age bins. The solar metallicity of the models is recovered with 70 percent confidence.
It is worth pausing here to emphasize the significance of the results presented in Figs 1–3. These results are the first to quantify the usefulness of the high-pass components of medium-resolution galaxy spectra for constraining star formation histories. We have shown that, for spectra with high-enough signal-to-noise ratio ( per pixel), the method outlined in Section 2 succeeds in recovering with reasonable accuracy the star formation histories (and metallicities) of galaxies with a wide range of time scales of star formation. These results greatly extend the work of Kauffmann et al. (2003), who derived valuable but limited constraints on the recent star formation histories of galaxies, based purely on the strengths of the 4000 Å discontinuity and H stellar absorption line. We find that the analysis of the high-pass spectrum over the whole wavelength range from 3650 to 8500 Å provides useful constraints on the entire star formation history of a galaxy, along with some constraints on the stellar metallicity.
A main advantage of our method over other approaches to extract star formation histories from galaxy spectra is that it minimizes uncertainties linked to attenuation by dust and the spectro-photometric calibration (Sections 2.2 and 2.3.3). These uncertainties, which often must be included in a rudimentary way, have impaired most previous interpretation of galaxy spectra using low-resolution models (e.g., most recently, Reichardt et al. 2001; Panter et al. 2003). In this context, the results presented in Figs 1–3 should be taken as illustrative of the new type of constraints that can be set on the star formation histories of galaxies, thanks to the advent of medium-resolution population synthesis models. It is worth re-emphasizing that, in the examples shown above, the simulated galaxy spectra have the same solar heavy-element abundance ratios as the models used to interpret them, while the abundance ratios of heavy elements are known to vary in external galaxies (e.g., Worthey et al. 1992; Eisenstein et al. 2003). As mentioned in Section 2.2, we exclude from our analysis the spectral features with the strongest identified dependence on changes in the /Fe abundance ratio. This should limit the uncertainties in the star formation histories and metallicities derived from observed, high-pass galaxy spectra (Section 4).
3.3 The case of intermediate-age stars
In the previous section, we noted the difficulty in recovering the mass fraction of stars with ages around 1 Gyr from the high-pass spectrum of a 13.5 Gyr-old model galaxy with a star-formation time scale of 7 Gyr (Fig. 2a). This also affected the constraints derived on the mass fractions of stars in the adjacent age bins. We show here that this difficulty arises from a fundamental limitation of the spectral interpretation of galaxies for which the optical signatures of intermediate-age stars (0.5–4 Gyr) are masked by those of younger and older stars.
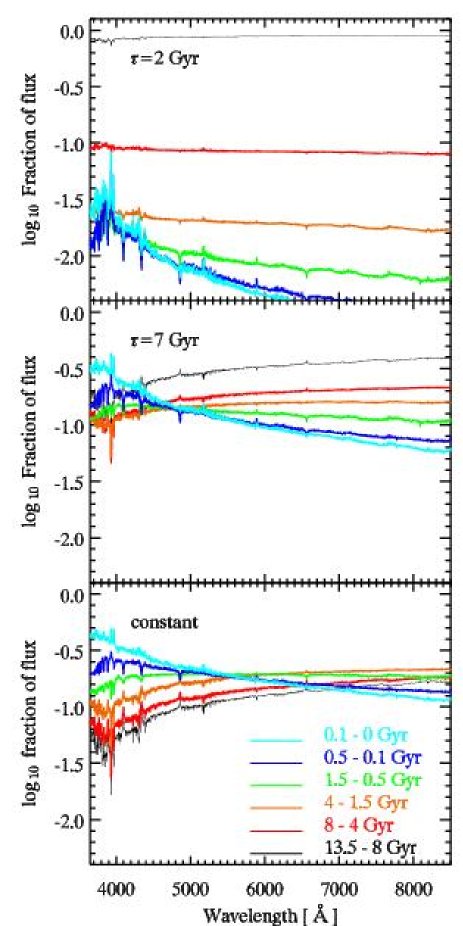
Fig. 5 shows the relative contributions by stars in different age bins to the integrated spectra (including both the high-pass and low-pass components) of the 3 model galaxies studied in Section 3.2, with star-formation time scales 7 Gyr and (constant star formation rate). For Gyr, only stars older than 4 Gyr contribute significantly to the integrated light at any wavelength. If the signal-to-noise ratio is high enough, the signatures of stars with ages 4–8 and 8–13.5 Gyr can be discerned in the integrated high-pass spectrum (Fig. 2). For constant star formation rate, stars of any age always contribute to a major fraction of the integrated light in at least some wavelength range. Young stars dominate at short wavelengths, while intermediate-age and old stars dominate at long wavelengths. This makes the contributions by stars of all ages identifiable in the integrated high-pass spectrum of the galaxy (Fig. 3).
The case of the Gyr model is different. The few young stars in this model dominate the integrated light at short wavelengths. However, the large number of old stars dominate so much the emission at long wavelengths, that intermediate-age stars (0.5–4 Gyr) never contribute more than a minor fraction of the integrated light at any wavelength. This is why the mass fraction of intermediate-age stars is difficult to constrain accurately from the integrated high-pass spectrum of the galaxy, even for very high signal-to-noise ratio (Fig. 2). This limitation does not affect the interpretation of only high-pass spectra. As Fig. 5 shows, it is a fundamental limitation of the spectral interpretation of galaxies with smoothly declining star formation rates, for which the signatures of intermediate-age stars are masked by those of younger and older stars (an analogous limitation can arise when the spectrum is dominated by large amounts of recent star formation; see Section 4.2 and Fig. 11 below). We note that Gyr is thought to be the volume-averaged time scale of star formation of the Universe (e.g., Glazebrook et al. 2003; Brinchmann et al. 2004). Hence, our results imply that it may be difficult to constrain with precision the star formation history of the Universe at redshift , based purely on the spectra of galaxies (Section 4.3).
3.4 New insight into spectral indicators
It is instructive to investigate the spectral features selected by the MOPED algorithm to constrain the star formation histories of galaxies from high-pass spectra. Given a fixed noise pattern, the weighting vectors constructed as outlined in Section 2.1 quantify in an optimal way the sensitivity of the flux at each wavelength to the mass fractions of stars in various age ranges. Thus, these vectors provide a means of identifying optimal spectral indicators of the star formation histories of galaxies.
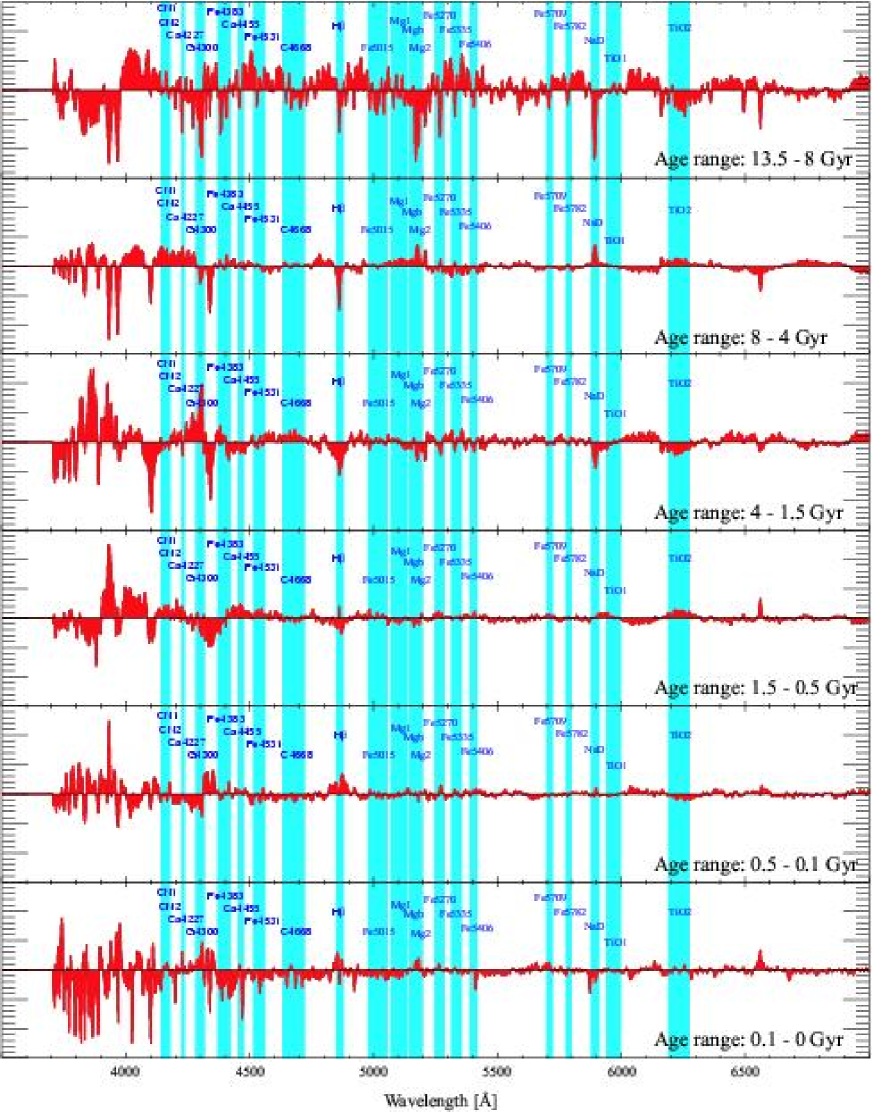
Fig. 6 shows the components of the weighting vectors quantifying the sensitivity of the flux at each wavelength to the mass fractions of stars in the 6 age bins used in our analysis (red histogram). In this example, we have adopted a stellar velocity dispersion , solar metallicity and a fixed signal-to-noise ratio across the whole wavelength range from 3650 to 8500 Å. Also shown for reference in Fig. 6 are the central band-passes of the 23 spectral indices of the Lick system (blue bands). Several of these, such as H, Ca4227, G4300, H, H, Ca4455 and NaD, coincide with spectral features identified by MOPED to be most sensitive to the fractions of stars in various age ranges. A full coincidence is not expected between the red histogram and the blue bands, because many Lick indices are expected to be more sensitive to metallicity rather than age (e.g., Worthey 1994).
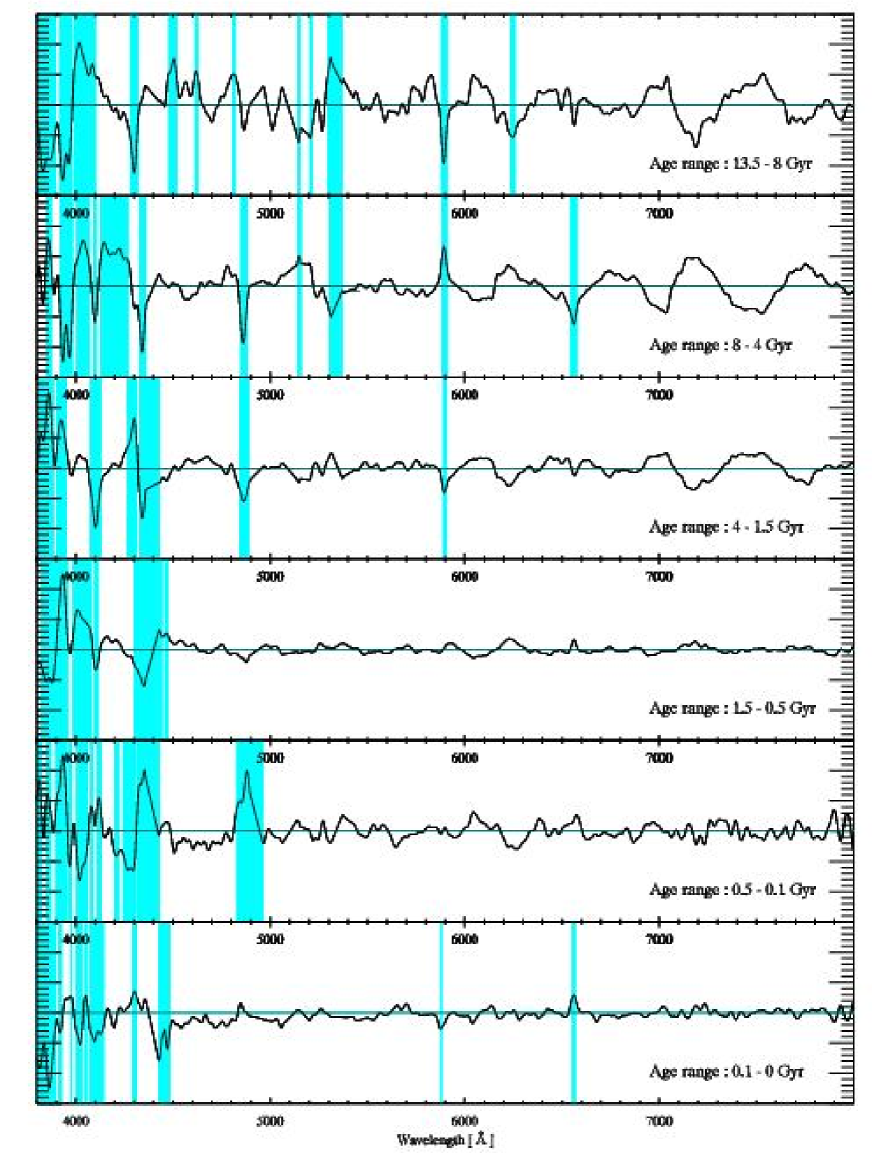
Several spectral regions identified by MOPED to be highly sensitive to age in Fig. 6 do not coincide with any Lick index. To highlight all the features expected to reveal the presence of stars in various age ranges, we smooth each red histogram of Fig. 6 using a Gaussian kernel of rms 10 Å and show the result as a solid curve in Fig. 7. For each age range, we mark with blue bands the spectral regions where the components of the smoothed vector exceed 1.5 times the rms variation over the 3650–8500 Å wavelength range (we choose this level empirically to highlight only a moderate number of regions). Most of these regions appear to lie in the blue part of the optical spectrum; they could constitute the central band-passes of a set of optimal indicators of the presence of stars in various age ranges, which could be exploited without appealing to the full MOPED analysis. In practice, only a few of the most sensitive indices should be selected to trace the presence of stars in each age range. We plan to explore this and the dependence of the spectral indicators on velocity dispersion and metallicity in more detail in a forthcoming analysis.
4 Application to the interpretation of observed galaxy spectra
In this section, we show examples of derived star formation histories from observed, medium-resolution galaxy spectra using the method outlined in Section 2. We first recall the main characteristics of the SDSS EDR spectra we consider. We then show examples of derived star formation histories of early-type and late-type galaxies of comparable mass. Finally, we constrain the global assembly of stellar mass in galaxies in different mass ranges in the Universe.
4.1 SDSS galaxy spectra
The observational sample we consider is the SDSS Early Data Release (Stoughton et al., 2002). The SDSS is obtaining , , , , and photometry of almost a quarter of the sky and spectra of at least 700,000 objects. The ‘main galaxy sample’ of the EDR includes the spectra of 32,269 galaxies with -band Petrosian magnitudes in the range 14.5017.77, after correction for foreground Galactic extinction (Strauss et al., 2002). The median redshift is about 0.1. The SDSS spectra are acquired using 3-arcsecond diameter fibres that are positioned as close as possible to the centres of the target galaxies. The spectra are flux- and wavelength-calibrated, with 4096 pixels from 3800 Å to 9200 Å at resolving power . This is similar to the resolution of our models in the wavelength range from 3650 Å to 8500 Å. We stress that, since we are interested in only the high-pass signal of the spectra, our results are not sensitive to uncertainties in the spectro-photometric calibration of the SDSS EDR spectra (Section 2.2).
We consider here the spectra of all galaxies with redshifts in the range . We use smear-corrected observations reduced through the spectro-1d pipeline (SubbaRao et al., 2002), which we convert from vacuum to air for comparison with the models. We remove sky (emission and absorption) lines. We also remove all detectable nebular emission lines using the procedure described in Tremonti et al. (2004) that is based on accurate fits to the emission line-free regions of the spectra with model spectra broadened to the observed stellar velocity dispersion. Finally, we mask those regions of the spectra that are known to strongly depend on changes in metal abundance ratios (Section 2.2).
4.2 The star formation histories of early-type and late-type galaxies
To illustrate the constraints derived from high-pass spectra on the star formation histories of galaxies, we differentiate between early-type and late-type galaxies. We select the two types of galaxies on the basis of the ‘concentration parameter’, defined as the ratio of the radii enclosing 90 and 50 percent of the Petrosian -band luminosity of a galaxy. This has been shown to correlate well with ‘by eye’ morphological classification (Shimasaku et al., 2001; Strateva et al., 2001). Strateva et al. (2001) propose a cut at to separate early- from late-type galaxies. We classify conservatively as ‘early type’ all galaxies with and as ‘late type’ all galaxies with . We exclude galaxies identified as hosts of active galactic nuclei (AGNs) by Kauffmann et al. (2003). These various cuts reduce our sample to 3229 early-type and 9430 late-type galaxies with redshifts .
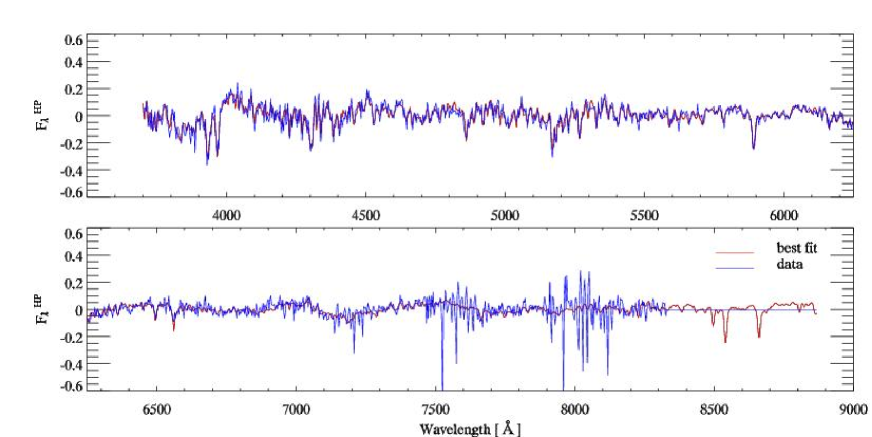
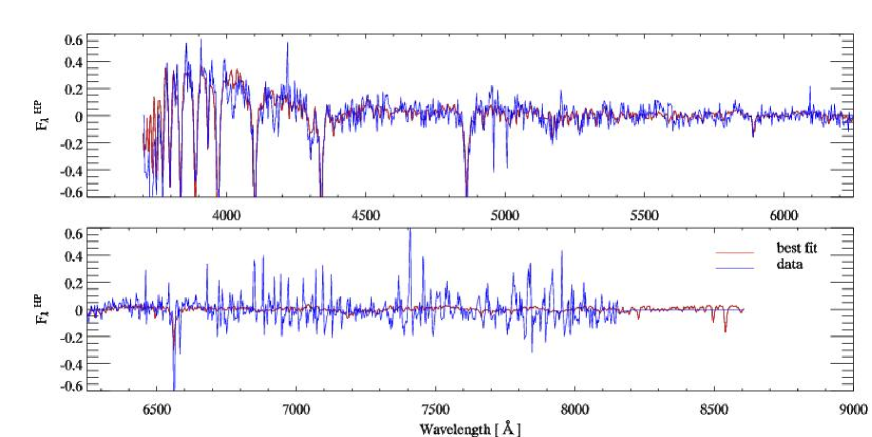
We derive star formation histories for all these galaxies using the method described in Section 2. In this procedure, we always adopt models with stellar velocity dispersions close to the observed one and compute MOPED weighting vectors specific to each galaxy, based on the observed noise spectrum (Section 2.4.1). As an example, we compare in Figs 8 and 9 the observed high-pass spectra of an early-type galaxy (#274–51913–392, IAU: SDSS J103840.25+002251.6) and a late-type galaxy (#268–51633–202, IAU: SDSS J095645.76+011448.7) with the spectra of the models corresponding to the most likely star formation histories selected by our analysis. The early-type galaxy has , a 4000 Å discontinuity (as computed using the narrow-band definition of Balogh et al. 1999), a velocity dispersion km s-1 and a median signal-to-noise ratio per pixel . The late-type galaxy has , , km s-1 and . There is good agreement between models and observations for the main stellar (Balmer and metallic) absorption features in the spectra of both galaxies.
Figs 10 and 11 show star formation histories derived from the high-pass spectra of the early-type and late-type galaxies in Figs 8 and 9, respectively. In each case, the left-hand panel shows the evolution of the star formation rate, while the right-hand panel shows the cumulative assembly of stellar mass. The star formation rates in Figs 10 and 11 were computed by dividing the mass fraction of stars formed in each bin of look-back time by the duration of that bin. Thus, they are normalized to a total of of stars formed over all ages. As in Figs 2–4, the thick line, box and error bars for each bin of look-back time in Figs 12 and 13 indicate the median value, 16–84 and 2.5–97.5 percentile ranges of the quantity plotted on the -axis (these ranges indicate the 68 and 95 percent confidence intervals in the recovered star formation history; the results of Section 3.2 suggest that the 16–84 percentile range is typical of the accuracy to which our method can recover star formation histories from high-pass galaxy spectra). Fig. 10 shows that most of the stars in the early-type galaxy SDSS J103840.25+002251.6 are likely to have formed over 8 Gyr ago, while star formation appears to have occurred much later in the late-type galaxy SDSS J095645.76+011448.7. The significant recent star formation in this galaxy makes the mass fraction of stars with ages around 1 Gyr difficult to constrain (see also Section 3.3).
It is interesting to compare the typical star formation histories of early-type and late-type galaxies of similar stellar mass. Kauffmann et al. (2003) derived stellar masses for the galaxies in the SDSS EDR, based on the observed strengths of and of the H absorption line. We follow their procedure here and compute, for each galaxy in our sample, the median mass-to-light ratio in the observer-frame band that is predicted by our analysis of the high-pass spectrum.666Kauffmann et al. (2003) used the band in their analysis, which falls outside the spectral range of the medium-resolution models considered here for galaxies at redshifts (Section 2.2). We assume that this ratio is the same for the whole galaxy as it is in the region sampled by the fibre. We then compute the total stellar mass from the observed -band luminosity, after correcting the -band flux for attenuation by dust and the contamination by emission lines, using the same procedure as outlined in Kauffmann et al. (2003). The galaxy stellar masses obtained in this way agree to within 50 percent with those derived by Kauffmann et al. (2003). For the SDSS-EDR sample, the distribution of galaxy stellar masses peaks around .
We focus on the typical star formation histories derived from the high-pass spectra of early-type and late-type galaxies around the peak of the stellar mass distribution, i.e. with masses in the range . One way to constrain these is to stack the spectra of all galaxies of each type in this mass range and to derive the corresponding star formation history from the stacked spectrum. In practice, we first arrange the galaxies in 4 bins of velocity dispersion (), 5 bins of 4000-Å discontinuity () and 2 bins of redshift (). Then, within each 3-dimensional bin, we stack the (emission-line subtracted) spectra of all galaxies. In this procedure, we normalize each spectrum to the total absolute magnitude derived from the observed Petrosian -band magnitude. We also weight each spectrum by a factor , where is the largest volume within which the galaxy would pass the sample selection criteria.777We compute using the effective area and the bright (14.50 mag) and low (17.77 mag) magnitude cutoffs of the SDSS EDR. We do not include any evolutionary corrections to . We derive the star formation history from the high-pass signal in the stacked spectrum in each bin of , and . This star formation history corresponds to a final stellar mass density of . The typical star formation history of galaxies of a given type is therefore given by the -weighted average of the star formation histories of all bins for that type.
Figs 12 and 13 show the typical star formation histories derived in this way from the high-pass spectra of 659 early-type and 385 late-type galaxies with stellar masses in the range (i.e., around the peak of the stellar mass distribution of SDSS-EDR galaxies) in our sample. In each case, the left-hand panel shows the typical, class-averaged evolution of the star formation rate, while the right-hand panel shows the cumulative assembly of stellar mass. Figs 12 shows that most of the stars in the typical early-type galaxy in our sample are likely to have formed over 8 Gyr ago, although a small fraction of the total stellar mass can be accounted for by stars with ages down to 4 Gyr. This is consistent with a wide range of constraints on the fraction of intermediate-age stars in early-type galaxies (Jørgensen, 1999; Trager et al., 2000; Menanteau et al., 2001; Bell et al., 2003). We note that Reichardt et al. (2001) used MOPED to interpret the low-resolution spectra of 8 bright nearby E/S0 galaxies from the Kennicutt (1992) atlas. They found that stars younger than 3 Gyr could account for over 30 percent of the total stellar mass for 6 of these galaxies. This is not the case for the typical early-type galaxy in our sample.
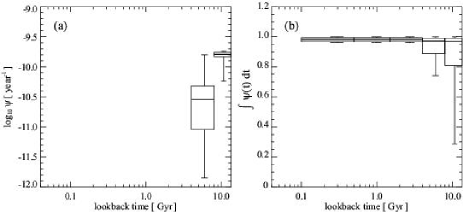
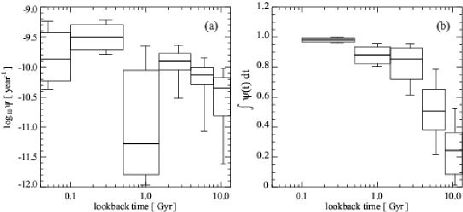
Fig. 13 shows how the typical star formation history of a late-type galaxy differs from that of an early-type galaxy in the same stellar-mass range. The typical late-type galaxy with appears to have formed stars at a roughly constant or smoothly declining rate over the lifetime of the universe. The apparent ‘drop’ in the median star formation rate at look-back times around 1 Gyr in Fig 13a is not statistically significant. It is a likely consequence of the difficulty of constraining the mass fraction of stars of this age for smoothly declining star formation histories (Section 3.3). We note that the average evolution of the star formation rate of a late-type galaxy in Fig. 13a is consistent with the star formation history of the Milky Way derived by Rocha-Pinto et al. (2000) from the analysis of 552 Galactic stars.
The results of Figs 12 and 13 illustrate the accuracy to which our method can recover star formation histories from the observed high-pass spectra of individual galaxies in the SDSS EDR. The typical uncertainties in the derived star formation histories are somewhat larger than those expected from the analysis of model galaxy spectra with similar signal-to-noise ratio () in Section 3.2 (Figs 2–4). This arises in part from our simplifying assumption that all stars in the model galaxies studied in Section 3.2 had a fixed metallicity (corresponding to the effective metallicity). The mixing of stars with different chemical compositions in real galaxies makes the interpretation of the high-pass spectrum using single-metallicity models less precise. Also, our models have fixed, solar metal abundance ratios, whereas the abundance ratios of heavy elements are expected to vary in external galaxies (Section 2.2). The influence of this uncertainty on the present study should be minimized by the fact that we have masked those features that are expected to be most sensitive to changes in metal-abundance ratios in the SDSS galaxy spectra.
We have also derived rough constraints on the metallicities of all galaxies in our sample by assigning them sub-solar (), solar () or supra-solar () metallicity, as described in Section 2.4.2. We have found that the results compare relatively well to the more refined metallicities derived by Gallazzi et al. (2004) for these galaxies, based on the analysis of selected Balmer and metallic lines with weak dependence on metal-abundance ratios.
4.3 Cosmic star formation history
We now use the high-pass spectra of SDSS galaxies to set constraints on the global star formation history of the Universe and its distribution among galaxies in different mass ranges. Here, we include all galaxies at redshifts in the SDSS EDR sample. We also include those galaxies identified as AGN hosts by Kauffmann et al. (2003). As shown by these authors, the presence of a (type 2) AGN does not alter significantly the stellar absorption-line signatures in the host-galaxy spectrum. By analogy with our approach in Section 4.2, we proceed by first stacking the spectra of galaxies in different bins of velocity dispersion (; 4 bins), 4000-Å discontinuity (; 3 bins) and redshift (; 2 bins) to improve the signal-to-noise ratio. As before, we normalize each individual spectrum to the total absolute magnitude derived from the observed Petrosian -band magnitude of the galaxy and apply a weight of . Then, we derive the star formation history from the high-pass signal in the stacked spectrum in each bin of , and . This yields the probability density functions of the mass fractions of stars formed in 6 age bins for this spectrum. This star formation history corresponds to a final stellar mass density of , which we use to transform stellar mass fractions into stellar mass densities. To obtain the global star formation history per unit comoving volume of the Universe, we then simply combine the star formation histories over all bins of , and . In practice, this is obtained by combining the probability density functions of the stellar mass densities formed in each redshift bin, following the precepts outlined in appendix A of Brinchmann et al. (2004).

Fig. 14 shows the evolution of the star formation density (left) and cumulative assembly of stellar mass (right) as accounted for by galaxies in different mass ranges in a unit comoving volume of the Universe: (a) –; (b) –; (d) ; and (d) full mass range (–). The most striking result from this figure is the fact that the stars that end up in massive galaxies today appear to have formed on average earlier than those that end up in low-mass galaxies. This result was already obtained in a different analysis by Heavens et al. (2004), who used MOPED to interpret the low-resolution spectra of 96,545 galaxies in the SDSS Data Release One (DR1). It is consistent with the ‘down-sizing’ scenario, in which the mass and luminosity of the galaxies undergoing active star formation become progressively lower as the Universe becomes older (Cowie et al., 1996). We note that both the present analysis and that of Heavens et al. (2004) rely on the spectral analysis of nearby galaxies. Hence neither analysis indicates whether the stars formed once the galaxies were already assembled into systems with masses similar to the present-day ones.
It is unlikely that the results of Fig. 14 be seriously affected by the magnitude limit of our sample. As shown by Brinchmann et al. (2004), at the low-redshift limit of , the magnitude limit of the spectroscopic SDSS sample corresponds roughly to a stellar mass limit of just under for a galaxy which would have formed all its stars 13.5 Gyr ago and faded ever since. Most galaxies of the same mass containing younger stars would be brighter, as attenuation by dust is not expected to be significant in low-mass galaxies (see figure 6 of Brinchmann et al. 2004). We find that restricting the stellar-mass range of galaxies in Fig. 14a to the more conservative completeness range has a negligible effect on the derived star formation history. Thus, the magnitude limit of the SDSS sample cannot account for the conclusion from Fig. 14 that the stars in massive galaxies today formed on average earlier than those in low-mass galaxies.
Aperture effects could potentially affect the results of Fig. 14 because, at the low redshifts of the SDSS sample, the small-aperture SDSS fibres tend to sample the inner, bulge-dominated regions of massive galaxies with bulge+disc morphologies. Kewley et al. (2005, see also ) find that the influence of aperture effects on star-formation-rate estimates is significantly reduced when at least 20 percent of a galaxy’s light is gathered in the fibre. They show that, for the average SDSS galaxy, this corresponds to restricting studies to redshifts larger than . Since most galaxies more massive than in our sample lie at redshifts greater than this limit, aperture effects should have only a weak influence on the results of Figs 14b and c. Low-mass galaxies in Fig. 14a are not expected to be subject to strong aperture effects either, since their morphologies tend to be dominated by either a bulge or a disc, but not both. This is supported by the finding by Brinchmann et al. (2004) that low-mass SDSS galaxies show only weak colour gradients (we note that the star formation density in the lowest redshift bin in Fig. 14d, which is based on the spectra of only nearby low-mass galaxies, is highly uncertain). Thus, we conclude that aperture effects should not strongly influence the results of Fig. 14.
The evolution of the total star formation density of the Universe in Fig. 14d differs from that found by Heavens et al. (2004) in that we do not find any statistically significant peak in the star formation activity at redshift . This results in part from our more conservative treatment of the uncertainties associated to the star formation histories derived with MOPED (see Section 2.4). The relatively large uncertainties in Fig. 14 also reflect the limitations of current models for interpreting the high-pass spectra of observed galaxies (see the discussion at the end of Section 4.2). These uncertainties should be taken as very conservative, in the sense that they were constructed ignoring any possible correlation between the star formation histories of galaxies in different bins of velocity dispersion, 4000-Å discontinuity and redshift classes (see above). According to Fig. 14d, about percent of all stars in the Universe formed prior to redshift , and the star formation density has since been declining smoothly. These results are consistent with those obtained by Baldry et al. (2002) from the analysis of the stacked, low-resolution spectra of 166,000 galaxies at redshifts extracted from the Two-degree Field Galaxy Redshift Survey (2dFGRS; Colless et al. 2001). They conclude that the star formation density of the Universe must have peaked in the past () at a value at least three times the present-day one, while no more than 80 percent of all stars must have formed at redshifts .
5 Summary and Conclusions
We have presented a method for extracting star formation histories from medium-resolution galaxy spectra, which is free of uncertainties arising from the spectro-photometric calibration and intrinsic attenuation by dust in the galaxies. The method focuses on the interpretation of the high-pass signal in galaxy spectra, using a combination of the data compression algorithm MOPED (Heavens et al., 2000) with the medium-resolution population synthesis code of Bruzual & Charlot (2003), which covers the wavelength range 3650–8500 Å at a resolving power of . The principle of this method is to quantify the sensitivity of each pixel in a high-pass galaxy spectrum to the mass fraction of stars formed in 6 age bins spanning the age of the Universe. Given an observed spectrum, statistical estimates of the mass fraction of stars formed in each age bin allow one to constrain the entire star formation history of the galaxy. Our implementation of MOPED differs in several ways from previous applications of this algorithm to the interpretation of low-resolution galaxy spectra (Reichardt et al., 2001; Panter et al., 2003). Overall, these differences should lead to more conservative estimates of the errors in the derived star formation histories (Section 2.4). Our approach does not require prior knowledge of the metallicity but assumes that all stars in a given galaxy have the same metallicity, which should be regarded as the effective metallicity (i.e., the metallicity of the stars dominating the light).
We have tested in detail the ability of our method to recover star formation histories from model high-pass spectra of galaxies with different time-scales of star formation. We find that the method can recover the full star formation histories of these models, provided that the median signal-to-noise ratio per pixel is large, i.e. –30. Our method allows us to identify those spectral features that are most sensitive to the presence of stars of a given age in the integrated spectrum of a galaxy. We have exemplified how this could be used to define new ‘Lick-type’ spectral indices for studies of the star formation histories of galaxies (Section 3.4). The application of our method to model galaxy spectra also reveals a fundamental limitation in the recovery of the star formation histories of galaxies for which the optical signatures of intermediate-age stars are masked by those of younger and older stars. One of the consequences of this limitation is that the mass fraction of stars with ages around 1 Gyr is difficult to recover with accuracy in galaxies with smoothly declining star formation histories (i.e. with star formation time-scales of about 7 Gyr). Interestingly, this type of star formation history is expected to be representative of the Universe as a whole (Baldry et al., 2002).
As an illustration, we have used our method to derive star formation histories from high-quality galaxy spectra in the SDSS EDR. To perform this analysis, we have first removed emission lines from the observed spectra using the method outlined by Tremonti et al. (2004). We have found that the star formation histories of morphologically identified early- and late-type galaxies with stellar masses near the peak of the distribution in the local Universe, i.e. with , are in agreement with what is commonly assumed about these systems. Early-type galaxies appear to have formed most of their stars over 8 Gyr ago, although a small fraction of the total stellar mass of these galaxies may be accounted for by stars with ages down to 4 Gyr. In contrast, late-type galaxies appear to have formed stars at a roughly constant rate. We also examined the constraints set by the high-pass signal in the stacked spectra of a complete magnitude-limited sample of 20,623 SDSS-EDR galaxies on the global star formation history of the Universe and its distribution among galaxies in different mass ranges. Our results confirm that the stellar populations in the most massive galaxies today appear to have formed on average earlier than those in the least massive ones (Heavens et al., 2004). Our analysis does not reveal any statistically significant peak in the star formation activity of the Universe at redshifts below unity.
At present, the main limitation in the interpretation of medium-resolution galaxy spectra is the fixed, solar metal abundance ratios of the models at all metallicities while the abundance ratios of heavy elements are observed to vary in external galaxies (e.g., Worthey et al. 1992; Eisenstein et al. 2003). To minimize the consequences of this limitation, we have masked those regions of galaxy spectra that are known to strongly depend to changes in metal abundance ratios (Section 2.2). However, we suspect that at least part of the relatively large uncertainties affecting the star formation histories derived from the high-pass spectra of SDSS-EDR galaxies in Section 4 may result from this limitation. On the theoretical front, work is underway to develop the ability to model the spectral evolution of galaxies with various metal abundances ratios at medium resolution (e.g., Coelho et al., in preparation). It is worth noting that the (weak) constraints derived from our analysis on the metallicities of SDSS-EDR galaxies compare relatively well to the more refined ones derived for the same galaxies by Gallazzi et al. (2004) from the analysis of selected Balmer and metallic lines with weak dependence on metal-abundance ratios (Section 4.2).
The results obtained in this paper open the door to further refined interpretations of galaxy spectra in terms of star formation history, metallicity and dust content. For example, the low-pass signal in galaxy spectra, which is deliberately left aside in our analysis, contains valuable information about intrinsic attenuation by dust. In Section 2.3.3, we described how this information can be extracted from the low-pass signal, based on the constraints set by the high-pass signal on the star formation history (this requires that the spectra be spectro-photometrically well calibrated). Another interesting development should come from the application of our method to the interpretation of galaxy spectra gathered by high-redshift surveys, such as the VIRMOS-VLT Deep Survey (Le Fèvre et al., 2001) and the Deep Extragalactic Evolutionary Probe (Davis et al., 2003). Such analyses will allow a more precise accounting of the star formation history of galaxies at the epoch , which is poorly sampled by the analysis of local galaxies. These various developments should lead us to a deeper understanding of how galaxies formed and evolved.
Acknowledgements
We thank S. White, A. Boselli and B. Panter for useful discussions and A. Gallazzi for comparing our metallicity estimates for SDSS galaxies to her more refined estimates in advance of publication. We also thank the referee, A. Heavens, for helpful comments. H.M. thanks J. Silk for his encouragements and acknowledges support from PPARC. H.M. & S.C. thank the Alexander von Humboldt Foundation, the Federal Ministry of Education and Research, and the Programme for Investment in the Future (ZIP) of the German Government for their support. J.B. acknowledges the support of an ESA post-doctoral fellowship and an FCT fellowship BPD/14398/2003.
Funding for the creation and distribution of the SDSS Archive has been provided by the Alfred P. Sloan Foundation, the Participating Institutions, the National Aeronautics and Space Administration, the National Science Foundation, the U.S. Department of Energy, the Japanese Monbukagakusho, and the Max Planck Society. The SDSS Web site is http://www.sdss.org/.
The SDSS is managed by the Astrophysical Research Consortium (ARC) for the Participating Institutions. The Participating Institutions are The University of Chicago, Fermilab, the Institute for Advanced Study, the Japan Participation Group, The Johns Hopkins University, Los Alamos National Laboratory, the Max-Planck-Institute for Astronomy (MPIA), the Max-Planck-Institute for Astrophysics (MPA), New Mexico State University, University of Pittsburgh, Princeton University, the United States Naval Observatory, and the University of Washington.
References
- Baldry et al. (2002) Baldry I. K., Glazebrook K., Baugh C. M., Bland-Hawthorn J., Bridges T., Cannon R., Cole S., Colless M., Collins C., Couch W., et al. 2002, ApJ, 569, 582
- Balogh et al. (1999) Balogh M. L., Morris S. L., Yee H. K. C., Carlberg R. G., Ellingson E., 1999, ApJ, 527, 54
- Bell et al. (2003) Bell E. F., Wolf C., Meisenheimer K., Rix H.-W., Borch A., Dye S., Kleinheinrich M., Wisotzki L., McIntosh D. H., 2004, ApJ, 608, 752
- Brinchmann et al. (2004) Brinchmann J., Charlot S., White S. D. M., Tremonti C., Kauffmann G., Heckman T., Brinkmann J., 2004, MNRAS, 351, 1151
- Bruzual & Charlot (2003) Bruzual G., Charlot S., 2003, MNRAS, 344, 1000
- Chabrier (2003) Chabrier G., 2003, PASP, 115, 763
- Charlot & Fall (2000) Charlot S., Fall S. M., 2000, ApJ, 539, 718
- Colless et al. (2001) Colless M., Dalton G., Maddox S., Sutherland W., Norberg P., Cole S., Bland-Hawthorn J., Bridges T., Cannon R., Collins C., Couch W., Cross N., Deeley K., et al. 2001, MNRAS, 328, 1039
- Cowie et al. (1996) Cowie L. L., Songaila A., Hu E. M., Cohen J. G., 1996, AJ, 112, 839
- Davis et al. (2003) Davis M., Faber S. M., Newman J., Phillips A. C., Ellis R. S., Steidel C. C., Conselice C., Coil A. L., Finkbeiner D. P., Koo D. C., Guhathakurta P., et al. 2003, in Discoveries and Research Prospects from 6- to 10-Meter-Class Telescopes II. Edited by Guhathakurta, Puragra. Proceedings of the SPIE, Volume 4834, pp. 161-172 (2003). Science Objectives and Early Results of the DEEP2 Redshift Survey. pp 161–172
- Eisenstein et al. (2003) Eisenstein D. J., Hogg D. W., Fukugita M., Nakamura O., Bernardi M., Finkbeiner D. P., Schlegel D. J., Brinkmann J., Connolly A. J., Csabai I., Gunn J. E., et al. 2003, ApJ, 585, 694
- Gallazzi et al. (2004) Gallazzi A., Charlot S., Brinchmann J., White S. D. M., 2005, MNRAS, 362, 41
- Glazebrook et al. (2003) Glazebrook K., Baldry I. K., Blanton M. R., Brinkmann J., Connolly A., Csabai I., Fukugita M., Ivezić Ž., Loveday J., Meiksin A., Nichol R., Peng E., Schneider D. P., SubbaRao M., Tremonti C., York D. G., 2003, ApJ, 587, 55
- Heavens et al. (2004) Heavens A., Panter B., Jimenez R., Dunlop J., 2004, Nature, 428, 625
- Heavens et al. (2000) Heavens A. F., Jimenez R., Lahav O., 2000, MNRAS, 317, 965
- Jørgensen (1999) Jørgensen I., 1999, MNRAS, 306, 607
- Kauffmann & Charlot (1998) Kauffmann G., Charlot S., 1998, MNRAS, 297, 23
- Kauffmann et al. (2003) Kauffmann G., Heckman T. M., White S. D. M., Charlot S., Tremonti C., Brinchmann J., Bruzual G., et al. 2003, MNRAS, 341, 33
- Kauffmann et al. (2003) Kauffmann G., Heckman T. M., White S. D. M., Charlot S., Tremonti C., Peng E. W., Seibert M., Brinkmann J., Nichol R. C., SubbaRao M., York D., 2003, MNRAS, 341, 54
- Kauffmann et al. (2004) Kauffmann G., White S. D. M., Heckman T. M., Ménard B., Brinchmann J., Charlot S., Tremonti C., Brinkmann J., 2004, MNRAS, 353, 713
- Kewley et al. (2005) Kewley L. J., Jansen R. A., Geller M. J., 2005, PASP, 117, 227
- Kodama et al. (2004) Kodama T., Yamada T., Akiyama M., Aoki K., Doi M., Furusawa H., Fuse T., Imanishi M., Ishida C., Iye M., Kajisawa M., Karoji H., et al. 2004, MNRAS, 350, 1005
- Lahav (2001) Lahav O., 2001, in Banday A., Zaroubi S., Bartelmann M., eds, MPA/MPE/ESO Conference ‘Mining the Sky’ , 2000, Garching, Germany Compression and classification methods for galaxy spectra in large redshift surveys. Springer-Verlag : Heidelberg, p. 33
- Lawson & Hanson (1974) Lawson C. L., Hanson R. J., 1974, Solving least squares problems. Prentice-Hall
- Le Borgne et al. (2003) Le Borgne J.-F., Bruzual G., Pello R., Lancon A., Rocca-Volmerange B., Sanahuja B., Schaerer D., Soubiran C., Vilchez-Gomez R., 2003, A&A, 402, 433
- Le Fèvre et al. (2001) Le Fèvre O., Vettolani G., Maccagni D., Mancini D., Mazure A., Mellier Y., Picat J. P., et al. 2001, in Deep Fields The VIRMOS-VLT Deep Survey. pp 236–+
- Menanteau et al. (2001) Menanteau F., Abraham R. G., Ellis R. S., 2001, MNRAS, 322, 1
- Panter et al. (2003) Panter B., Heavens A. F., Jimenez R., 2003, MNRAS, 343, 1145
- Reichardt et al. (2001) Reichardt C., Jimenez R., Heavens A. F., 2001, MNRAS, 327, 849
- Rocha-Pinto et al. (2000) Rocha-Pinto H. J., Scalo J., Maciel W. J., Flynn C., 2000, ApJ, 531, L115
- Ronen et al. (1999) Ronen S., Aragon-Salamanca A., Lahav O., 1999, MNRAS, 303, 284
- Shimasaku et al. (2001) Shimasaku K., Masataka F., Doi M., Hamabe M., Ichikawa T., Okamura S., Sekiguchi M., Yasuda N., Brinkmann J., et al. 2001, AJ, 1238, 122
- Stoughton et al. (2002) Stoughton C., Lupton R. H., Benardi M., Blanton M. R., Burles S., Castander F. J., et al. 2002, AJ, 123, 485
- Strateva et al. (2001) Strateva I., Ivezic Z., Knapp G. R., Narayanan V. K., Strauss M. A., Gunn J. E., Lupton R. H., Schlegel D., Bahcall N., et al. 2001, AJ, 1861, 122
- Strauss et al. (2002) Strauss M. A., Weinberg D. H., Lupton R. H., Narayanan V. K., Annis J., Bernardi M., Blanton M., Burles S., Connolly A. J., Dalcanton J., Doi M., et a. 2002, AJ, 124, 1810
- SubbaRao et al. (2002) SubbaRao M., Frieman J., Bernardi M., Loveday J., Nichol B., Castander F., Meiksin A., 2002, in Astronomical Data Analysis II. Edited by Starck, Jean-Luc; Murtagh, Fionn D. Proceedings of the SPIE, Volume 4847, pp. 452-460 (2002). The Sloan Digital Sky Survey 1-Dimensional Spectroscopic Pipeline. pp 452–460
- Tegmark et al. (1997) Tegmark M., Taylor A. N., Heavens A. F., 1997, ApJ, 480, 22
- Thomas et al. (2003) Thomas D., Maraston C., Bender R., 2003, MNRAS, 339, 897
- Trager et al. (2000) Trager S. C., Faber S. M., Worthey G., Gonzalez J. J., 2000, AJ, 120, 165
- Trager et al. (1998) Trager S. C., Worthey G., Faber S. M., Burstein D., Gonzalez J. J., 1998, ApJS, 116, 1
- Tremonti et al. (2004) Tremonti C. A., Heckman T. M., Kauffmann G., Charlot S., Brinchmann J., White S. D. M., et al. 2004, ApJ, 613, 898
- Vazdekis (1999) Vazdekis A., 1999, ApJ, 513, 224
- Verde et al. (2003) Verde L., Peiris H. V., Spergel D. N., Nolta M., Bennett C. L., Halpern M., Hinshaw G., Jarozik N., Kogut A., et al. 2003, ApJS, 148, 195
- Worthey (1994) Worthey G., 1994, ApJS, 95, 107
- Worthey et al. (1992) Worthey G., Faber S. M., Gonzalez J. J., 1992, ApJ, 398, 69
- Worthey & Ottaviani (1997) Worthey G., Ottaviani D. L., 1997, ApJS, 111, 377