1]Department of Physics, Technion, Haifa 32000, Israel 2]School of Physics and Astronomy and the Wise Observatory, Tel-Aviv University, Tel-Aviv 69978, Israel
The High-Velocity Outflow of PG 1211+143: An Unbiased View Based on Several Observations
Abstract
We present and discuss high-resolution grating spectra of the quasar PG 1211+143 obtained over three years. Based on an early observation from 2001, we find an outflow component of about 3000 km s-1 in contrast with the much higher velocity of about 24000 km s-1 reported earlier for this source, and based on the same data set. Subsequent grating spectra obtained for PG 1211+143 are consistent with the first observation in the broad-band sense, but not all narrow features used to identify the outflow are reproduced. We demonstrate that the poor S/N and time variability seen during all existing observations of PG 1211+143 make any claims about the outflow precariously inconclusive.
1 Introduction
Typical mass outflow velocities of a few hundreds to a few thousands km s-1 have been measured by now in numerous Active Galactic Nuclei (AGNs; Crenshaw et al. 2003 and references therein). Recent studies of the X-ray spectra of certain quasars have led to claims of much higher outflow velocities reaching a significant fraction of the speed of light, e.g., APM 08279+5255 — Chartas et al. (2002) claim speeds of and 111Though Hasinger et al. (2002) using a different instrument prefer a more conservative interpretation by which the X-ray wind is much slower and consistent with the well known, UV broad absorption line wind of that source, outflowing at velocities of up to 12000 km s-1., PG 1115+080 — Chartas et al. (2003) find two X-ray absorption systems with outflow velocities of and . These measurements, however, were carried out using spectra obtained with CCD cameras and hence at moderate spectral resolving powers of . Using the XMM-Newton reflection gratings ( up to 500), high resolution X-ray spectra for several quasars have been obtained. For PG 1211+143 Pounds et al. (2003a, 2005) find a rich, well resolved spectrum featuring absorption lines of several ions, which they interpret as due to an outflow of 24000 km s-1. A similar interpretation was applied to a similar observation of PG 0844+349, where Pounds et al. (2003b) report even higher velocities reaching 60000 km s-1. In NGC 4051, Pounds et al. (2004) find a single absorption line at 7.1 keV, which they suggest may be Fe xxvi Ly at an outflow velocity of 6500 km s-1, or the He resonance absorption line of Fe xxv in which case the outflow velocity is 16500 km s-1. Yet another ultra-high-velocity (UHV, i.e., sub-) wind of 50000 km s-1 was reported by Reeves et al. (2003) for PDS 456. In all of these sources, the inferred hydrogen column densities through the wind is of the order of 1023 cm-2, which is about an order of magnitude higher than the typical values measured for the nearby Seyfert sources.
If indeed UHV outflows are common to bright quasars, this could have far reaching implications on our understanding of AGN winds and AGNs in general. For instance, if these winds carry a significant amount of mass as the high column densities may suggest, they would alter our estimates of the metal enrichment of the intergalactic medium by quasars. It remains to be shown theoretically what mechanism (e.g., radiation pressure) can drive these intense winds. Since the amount of mass in the wind is not well constrained, it is still unclear what effect it may have on the energy budget of the AGN. King & Pounds (2003) note that UHV winds have been found mostly for AGNs accreting near their Eddington limit. They provide a theory by which the UHV outflows are optically thick producing an effective photosphere, which is also responsible for the UV blackbody and soft X-ray (excess) continuum emission observed for these sources.
2 PG 1211+143 — first observation — second view
PG 1211+143 was observed with XMM-Newton during 2001 June 15 for about 55 ks. We retrieved the data for this observation from the XMM-Newton archive and reduced them using the Science Analysis System (SAS v5.3.0) in the standard processing chains as described in the data analysis threads and the ABC Guide to XMM-Newton Data Analysis. Overall, our data reduction results agree well with that of Pounds et al. (2003a, 2005) except for a few minor features which appear to be slightly different between the two reductions. We attribute these discrepancies to the different binning methods used and to the averaging of RGS1 and RGS2 in this work (see below). The results described in this section are presented in details in Kaspi & Behar (2006).
2.1 EPIC-pn
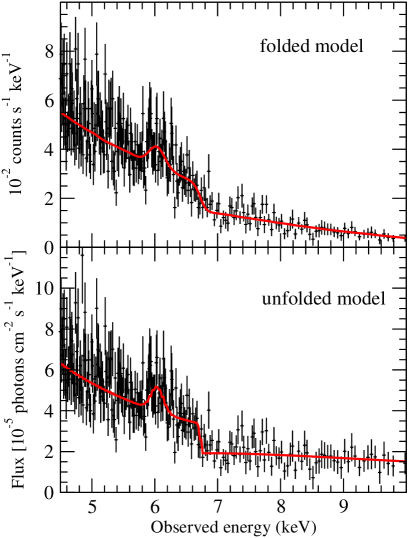
For the EPIC-pn data we first fitted the (line-free) rest-frame 2–5 keV energy range with a simple power law. The best fitted power law has a photon index of and a normalization of ph cm-2 s-1 keV-1 and gives for 487 degrees-of-freedom (d.o.f.). Extrapolating this power law up to a rest-frame energy of 11 keV, we find a flux excess above the power law at around 6.4 keV, which is indicative of an iron K line, and a flux deficit below the power law at energies above 7 keV. We add to the model a Gaussian emission line to account for the Fe K line and a photoelectric absorption edge to account for the deficit. Fitting for all parameters simultaneously, we find the best-fit Gaussian line center is at keV (or keV in the rest frame) and a line width () of keV. The total flux in the line is ph cm-2 s-1. For the edge, we find a threshold energy of keV, which is translated to a rest frame energy of keV. The optical depth at the edge is . The power law model with the Gaussian line and the absorption edge gives a for 613 d.o.f. This model is plotted in Figure 1 where we show the model, both folded through the instrument and fluxed (i.e., unfolded). We stress that this edge does not necessarily contradict the presence of the line detected by Pounds et al. (2003a, 2005), since K edges have lines right next to them.
We also observe the lines at 2.68 keV and 1.47 keV claimed by Pounds et al. (2003a, 2005) to be from S and Mg, only we identify them as different lines at much lower velocities. The 2.68 keV line is identified here as S xv He and the 1.47 keV line is identified as Mg xi He.
2.2 RGS
The RGS1 and RGS2 were operated in the standard spectroscopy mode resulting in an exposure time of ks. The spectra were extracted into uniform bins of 0.04 Å (which is about the RGS resolution and is 4 times the default bin width) in order to increase the signal-to-noise ratio (S/N). For the purpose of modeling narrow absorption lines, this rebinning method is better than the method used by Pounds et al. (2003a) of rebinning the spectrum to a minimum of 20 counts per bin, which distorts the spectrum especially around low-count-rate absorption troughs. To flux calibrate the RGS spectra we divided the count spectrum of each instrument by its exposure time and its effective area at each wavelength. Each flux-calibrated spectrum was corrected for Galactic absorption and the two spectra were combined into an error-weighted mean. At wavelengths where the RGS2 bins did not match exactly the wavelength of the RGS1 bins, we interpolated the RGS2 data to enable the averaging. The sky-subtracted combined RGS spectrum has in total counts and its S/N ranges from around 8 Å to around 18 Å with an average of 3. Statistics in the second order of refraction are insufficient, hence we did not include it in our analysis.
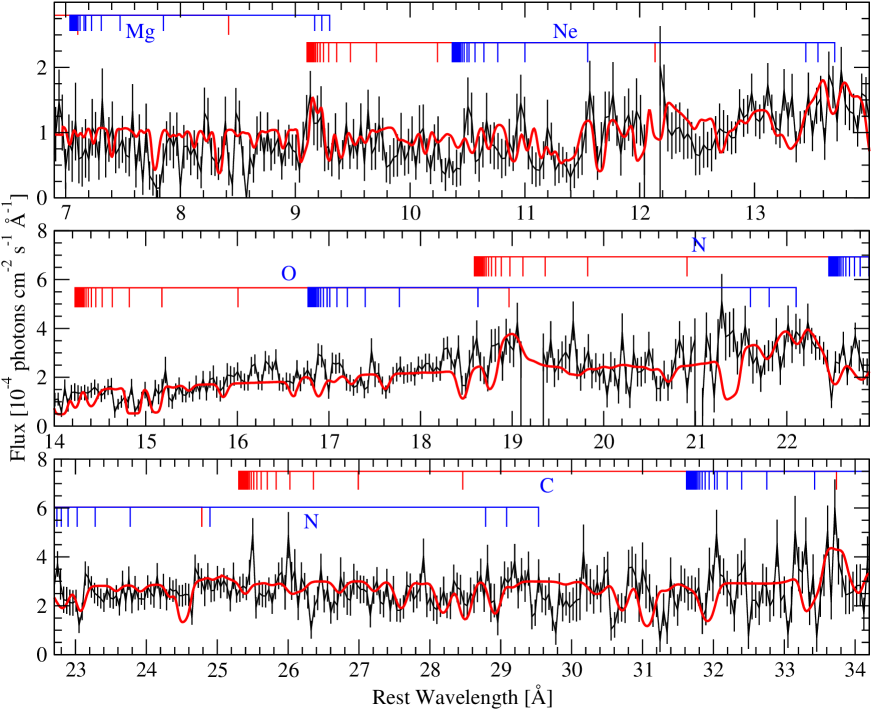
The combined RGS spectrum (RGS1 and RGS2) of PG 1211+143 is presented in Figure 2. Numerous absorption lines and several emission lines are detected. We identify K-shell lines of C, N, O and Mg and L-shell lines of O, Mg, Si, Ar, and Fe. The absorption line widths are consistent with the RGS resolution, and with the present S/N we are not able to resolve the intrinsic velocity widths. In emission, we identify significantly broadened lines of N vii Ly, O viii Ly, the forbidden line of O vii and its He resonance line, the forbidden line of Ne ix, and the Mg xi He resonance line, all in the rest frame of the source with no velocity shift.
In order to quantitatively explore the emission and absorption lines, we have constructed a model for the entire RGS spectrum. The present method is an ion-by-ion fit to the data similar to the approach used in Sako et al. (2001) and in Behar et al. (2003). We first use the continuum measured from the EPIC-pn data, but renormalized to the RGS flux level. This continuum is then absorbed using the full set of lines for each individual ion. Our absorption model includes the first 10 resonance lines of H- and He- like ions of C, N, O, Ne, and Mg as well as edges for these ions. The model also includes our own calculation for the L-shell absorption lines of Fe (Behar et al. 2001) as well as of Si, S, and Ar corrected according to laboratory measurements (Lepson et al. 2003, 2005). Finally, we include inner-shell K absorption lines of O and Mg (Behar & Netzer 2002), which we detect in the spectrum. The absorbed spectrum is complemented by the emission lines mentioned above, which are observed in the RGS spectrum.
By experimenting with the absorption line parameters, we find that the observed lines are all blueshifted by about 3000 km s-1 with an uncertainty of 500 km s-1. In the model we used a turbulence velocity of 1000 km s-1 to broaden the absorption lines. This width includes the instrumental broadening, which as noted above, we could not separate from the intrinsic broadening. Since the lines appear to be saturated, but no line goes to zero intensity in the trough, we obtain the best fit by assuming a covering factor of 0.7 for the X-ray continuum source. The best-fit column densities that we find for the different ions are consistent with a hydrogen column density of about – cm-2. The emission lines are modeled using Gaussians with uniform widths of km s-1 (resolved, but again, including the instrumental broadening), with no velocity shift, and assumed to be unabsorbed. These lines at FWHM km s-1 are even broader than those observed from the broad line region in the visible band ( km s-1; Kaspi et al. 2000). The entire best-fit spectrum is shown in Figure 2 (red curve). The spectrum beyond 25 Å is particularly challenging as it comprises many unresolved lines from L-shell ions of Si, S, and Ar while the RGS effective area drops rapidly. Several predicted lines may be observed here (e.g., Ar xiii - 28.92 Å, Si xii - 30.71 Å, Ar xii - 31.06 Å, S xiii - 31.93 Å; these wavelengths include the 3000 km s-1 shift). We are still unable to explain several features seen in the data, e.g., around 8.5 Å, 10.4 Å, or 29.8 Å, but the model gives a good fit to the data overall.
2.3 Conclusions - First Observation
We have provided a self consistent model to the ionized outflow of PG 1211+143 revealing an outflow velocity of approximately 3000 km s-1. Our model reproduces many absorption lines in the RGS band, although the S/N of the present data set is rather poor and some of the noise might be confused with absorption lines.
The present approach is distinct from the commonly used global fitting methods and also from the line-by-line approach used by Pounds et al. (2003a). It allows for a physically consistent fit to the spectrum and is particularly appropriate for a broad-ionization-distribution absorber as observed here for PG 1211+143.
The present model also features several broad (FWHM = 6000 km s-1) emission lines, which are observed directly in the data.
A broad and relatively flat ionization distribution is found throughout the X-ray outflow consistent with a hydrogen column density of roughly – cm-2. This is reminiscent of the outflow parameters measured in other well studied Seyfert galaxies.
We also detect Fe-K absorption, which was identified by Pounds et al. (2003a, 2005) as a strongly blueshifted Fe xxvi absorption line. We find that most of the Fe-K opacity can alternatively be attributed to several consecutive, low charge states of Fe, although it can not be assessed whether the absorber is co-moving with the outflow or not. Future missions with microcalorimeter spectrometers on board might be able to address this interesting question.
3 A second Observation of PG 1211+143
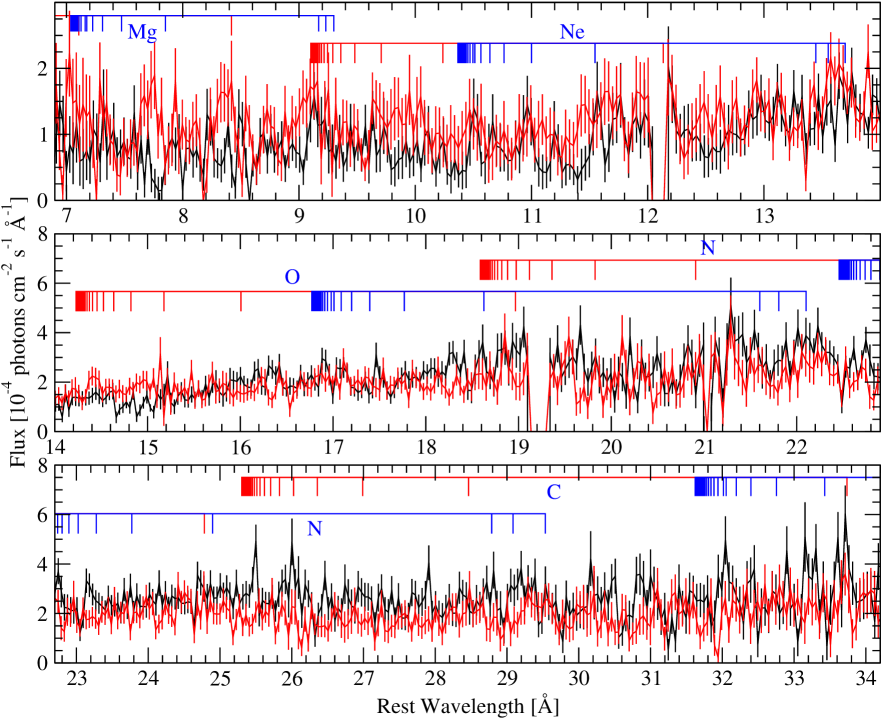
A second XMM-Newton observation of PG 1211+143 for ks was carried out on 2004 June 21, three years after the first observation of 2001 June 15 which is described above. We have retrieved the data of this second observation from the XMM-Newton archive and reduced it in exactly the same way described above for the first observation. The data of the second RGS observation are plotted (red line) in Figure 3 over the first observation (black line). The broad-band spectra of the two observations are generally consistent. However, not all narrow features are consistently reproduced. The total flux in the RGS band is the same in the two observations, though the continuum slope in the second observation the spectrum is somewhat harder.
When inspecting the detailed narrow features in the spectrum some have changed while others remain the same. For example, the second observations shows features which appear to be emission lines around 8 Å where the first observation had absorption lines. Also, around 15 Å the absorption lines seem to have disappeared in the second observation. Conversely, some features are the same in the two spectra, for example, the emission O vii triplet around 22 Å and the Ne ix triplet around 13.5 Å. From Figure 3, it can be seen that due to the poor S/N in both spectra, it is extremely hard to determine whether the differences between the two spectra are real, or a mere result of the data’s poor S/N.
4 Simultaneous observations of XMM-Newton and Chandra
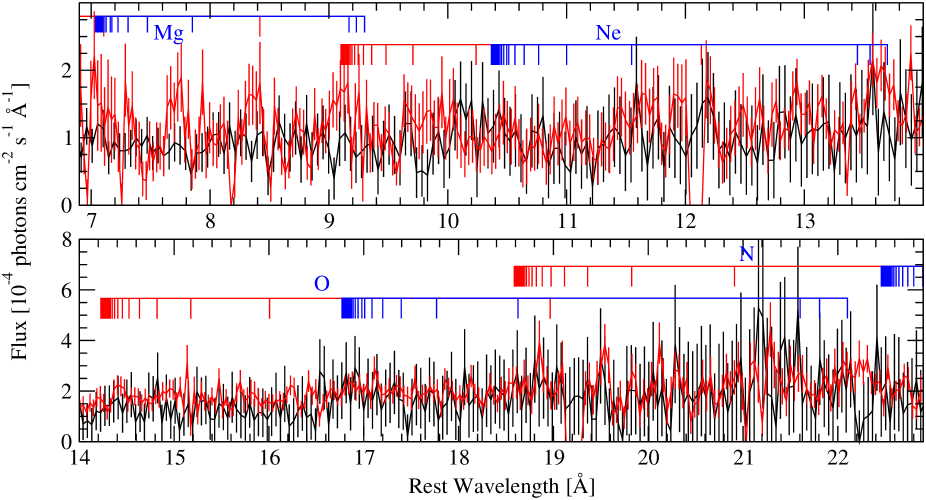
Simultaneously with the 2004 June 21 XMM-Newton observation, PG 1211+143 was also observed with the Low Energy Transmission Grating (LETG) on board the Chandra X-ray observatory. The LETG observation of ks has made use of the ACIS CCDs as the detector. We retrieved the data of this observation from the Chandra archive and reduced it using CIAO 3.2.1 and CALDB version 3.01, according to the updated CIAO threads. We have combined the +1 and -1 orders of the LETG spectrum using a weighted mean and the combined spectrum is represented in Figure 4 by a black line. The simultaneous RGS observation (the red data in Figure 3) is shown in red in Figure 4.
Although the simultaneous data from the two X-ray observatories are consistent overall, they differ in many details. For example, the RGS data between 7 to 9 Å show several emission-like features which the LETG data do not. Also, around 16.4 Å the LETG data show absorption-like features which are not present in the RGS data. These differences are consistent to within about 3 and are probably a result of the poor S/N of the observations
After the first 45 ks LETG observation of PG 1211+143 on 2004 June 21, which is described above, there were two more observations in consecutive orbits of the Chandra observatory. The second ks observation took place on 2004 June 23 and the third observation was on 2004 June 25. These data are not presented here, but their spectra is in overall agreement with the first LETG observation, except that the flux level in the last two observations was twice that of the first observation, i.e., during a period of days the flux level doubled. This is somewhat unexpected for a source that had retained its flux level of three years earlier (see Figure 3). Besides the change in flux between the three LETG observations, there is also a change in the absorption features seen between the first observation and the other two. Some of these features have disappeared between the first low-flux observation and the high-flux observations taken 2 days later, while other features seems to appear. The absorption features interpreted by Reeves et al. (2005) as evidence for sub-c gravitational infall are seen only in the second observation and not in the first or third ones. The fact that, again, absorption features are not reproduced in different spectra is rather confusing. If these lines are statistically significant (see Reeves et al. 2005) then they represent a transient flow.
5 Summary and Conclusions
We claim in Kaspi & Behar (2006) that an outflowing absorber at a velocity of 3000 km s-1 fits the first (2001) RGS data of PG 1211+143 better than a 24000 km s-1 model. Admittedly though, the poor S/N of those data can tolerate more than one interpretation.
A second RGS observation taken three years after the first observation shows general consistency with the first observation, but differs in important details of the absorption lines relevant to the outflow. Some features that appear in the first RGS observation disappear in the second one and vice versa. This could be a result of either short-time variability of the absorber (almost impossible to prove or refute) or the poor S/N of the data. Even more confusing is the fact that simultaneous observations of PG 1211+143 with RGS and LETG produce spectra that are partially incompatible in their absorption lines. This significantly reduces our confidence in the existence of the absorption lines and even more so in their identification. The poor S/N of the data calls for extra caution and careful modeling.
The three LETG observations indicate that the continuum source changes on a timescale of days. If the discrete features seen in these spectra are real, they too vary on short timescales. With the loss of the high-resolution X-ray spectrometer (XRS) on board Astro-E2, a very long observation of a good, bright UHV-wind source with Chandra or XMM-Newton gratings remains as the most viable approach toward testing what we feel is still a putative phenomenon of high velocity outflow.
Acknowledgments
This research was supported by the Israel Science Foundation (grant no. 28/03), and by a Zeff fellowship to S.K.
References
- Behar, Cottam, & Kahn (2001) Behar, E., Cottam, J. C., & Kahn, S. M. 2001, ApJ, 548, 966
- Behar & Netzer (2002) Behar, E., & Netzer, H. 2002, ApJ, 570, 165
- Behar et al. (2003) Behar, E., Rasmussen, A. P., Blustin, A. J., Sako, M., Kahn, S. M., Kaastra, J. S., Branduardi-Raymont, G., & Steenbrugge, K.C. 2003, ApJ, 598, 232
- Chartas, Brandt, Gallagher, & Garmire (2002) Chartas, G., Brandt, W. N., Gallagher, S. C., & Garmire, G. P. 2002, ApJ, 579, 169
- Chartas, Brandt, & Gallagher (2003) Chartas, G., Brandt, W. N., & Gallagher, S. C. 2003, ApJ, 595, 85
- Crenshaw, Kraemer, & George (2003) Crenshaw, D. M., Kraemer, S. B., & George, I. M. 2003, ARA&A, 41, 117
- Hasinger, Schartel, & Komossa (2002) Hasinger, G., Schartel, N., & Komossa, S. 2002, ApJ, 573, L77
- Kaspi & Behar (2006) Kaspi, S., & Behar, E. 2006, ApJ, 636, in press
- Kaspi et al. (2000) Kaspi, S., Smith, P. S., Netzer, H., Maoz, D., Jannuzi, B. T., & Giveon, U. 2000, ApJ, 533, 631
- King & Pounds (2003) King, A. R. & Pounds, K. A. 2003, MNRAS, 345, 657
- Lepson et al. (2003) Lepson, J. K., Beiersdorfer, P., Behar, E., & Kahn, S. M. 2003, ApJ, 590, 604
- Lepson et al. (2005) Lepson, J. K., Beiersdorfer, P., Behar, E., & Kahn, S. M. 2005, ApJ, 625, 1045
- Pounds et al. (2003a) Pounds, K. A., Reeves, J. N., King, A. R., Page, K. L., O’Brien, P. T., & Turner, M. J. L. 2003a, MNRAS, 345, 705
- Pounds, King, Page, & O’Brien (2003b) Pounds, K. A., King, A. R., Page, K. L., & O’Brien, P. T. 2003b, MNRAS, 346, 1025
- Pounds, Reeves, King, & Page (2004) Pounds, K. A., Reeves, J. N., King, A. R., & Page, K. L. 2004, MNRAS, 350, 10
- Pounds et al. (2005) Pounds, K. A., Reeves, J. N., King, A. R., Page, K. L., O’Brien, P. T., & Turner, M. J. L. 2005, MNRAS, 356, 1599
- Reeves, O’Brien, & Ward, (2003) Reeves, J. N., O’Brien, P. T., & Ward, M. J. 2003, ApJ, 593, 65
- Reeves, et al. (2005) Reeves, J. N., Pounds,K., Uttley, P., Kraemer, S., Mushotzky, R., Yaqoob, T., George, I. M., and Turner, T. J. 2005, ApJL, 633, L81
- Sako et al. (2001) Sako, M., et al. 2001, A&A, 365, L168