Dust-scattered X-ray halos around gamma-ray bursts: GRB 031203 revisited and the new case of GRB 050713A††thanks: Based on observations obtained with XMM-Newton, an ESA science mission with instruments and contributions directly funded by ESA Member States and NASA
Scattering by interstellar dust grains can produce time variable X-ray halos around gamma-ray bursts (GRB). In particular, an X-ray expanding ring is expected when a short pulse of X-ray radiation is scattered by a narrow layer of dust in our Galaxy. We present a new method to detect and analyze dust scattering expanding rings around gamma-ray bursts, using as an example XMM-Newton data of GRB 031203. Consistent with previous reports (Vaughan et al. (2004)), we find that the two expanding rings observed in this burst are due to dust unevenly distributed in two layers at distances of 870 and 1384 pc, with the more distant one responsible for 70% of the total optical depth. Our modelling of the rings indicates that the prompt X-ray emission of GRB 031203 was consistent with a power law spectrum with photon index =2.10.2 and 1–2 keV fluence of (3.60.2)10-7 erg cm-2. Thanks to the sensitivity of our technique, we discovered an expanding ring around another burst recently observed with XMM-Newton, GRB 050713A. In this case the dust layer is located at a distance of 364 pc and we derive a GRB fluence of (1.20.3)10-7 erg cm-2 (1–2 keV). A search for similar halos in other twelve bursts observed with XMM-Newton gave negative results.
Key Words.:
Gamma Rays: bursts - Methods: data analysis1 Introduction
Diffuse X-ray halos, produced by scattering on interstellar dust grains, have been observed around several bright sources (e.g. Mauche & Gorenstein (1986); Predehl & Schmitt (1995)). Since the scattering cross section depends on the grain properties, the study of the energy-dependent radial profile of the halos gives useful information on the dust grain size, composition, and spatial distribution along the line of sight (e.g. Mathis & Lee (1991); Draine (2003)). Most of the scattering halos observed to date involved X-ray sources with a steady luminosity (or with variations of amplitude and/or timescales not relevant for the observable halo properties).
Halo photons scattered at larger radii suffer greater time delays owing to their longer path lengths. Therefore, source variability causes time-dependent changes of the halo radial profile. Knowing the dust distribution along the line of sight it is possible to derive the distance of variable sources by studying their halos (Trümper & Schönfelder (1973)). This method was suggested as a way to discriminate between a galactic and a cosmological origin for Gamma-Ray Bursts (GRBs, Paczynski (1991); Klose (1994)), but could not be applied to this problem due to the lack of adequate X-ray telescopes. Although the GRB distance scale controversy has now been solved, the observation of dust scattering halos around GRBs can provide other interesting information and is within the capabilities of current satellites. Recently, Draine & Bond (2004) described how to measure the distance of galaxies through the dust scattering halos of background variable active galactic nuclei or GRBs.
The first detection of a GRB halo was obtained with a prompt XMM-Newton Target of Opportunity observation of GRB 031203 (Vaughan et al. (2004)), a burst at redshift z=0.1 quickly localized thanks to the INTEGRAL Burst Alert System (Mereghetti et al. (2003)). More recently another dust scattering halo has been discovered around GRB 050724 using Swift (Romano et al. (2005)).
Here we present a new method to detect and analyze time variable dust scattering halos like those expected for GRBs. As an illustration of our technique we apply it to GRB 031203, using data from the EPIC PN camera of XMM-Newton (Sect. 2). Our results on this burst provide an independent confirmation of those obtained from the EPIC MOS data (Vaughan et al. (2004)) for what concerns the dust distance, but we derive a different estimate of the burst emission properties (Sect. 3). We then analyze a recent XMM-Newton observation of another burst, GRB 050713A (Sect. 4), finding evidence for the presence of a scattering halo due to a dust layer located at a distance of 364 pc.
2 Detection of X-ray expanding rings
The general expression for the time delay of photons from a source at cosmological distance scattered by a dust layer at redshift is given by
,
where , , and are respectively the angular diameter distances of the source, of the dust layer and between the source and the dust layer, c is the velocity of light, and is the angle between the scattered photon and the source direction (Miralda-Escudé (1999)). When the scattering dust layer is in our galaxy, at distance , this equation simplifies to:
. (1)
A short pulse of X-rays, emitted during a GRB, will therefore produce a ring centered at the burst coordinates and with radius expanding with time according to eq. (1). The intrinsic width of the ring at a given time depends in a similar way on the duration of the X-ray pulse and on the thickness of the dust layer, while the observed width will also depend on the angular resolution of the detector and on the expansion of the ring during the exposure.
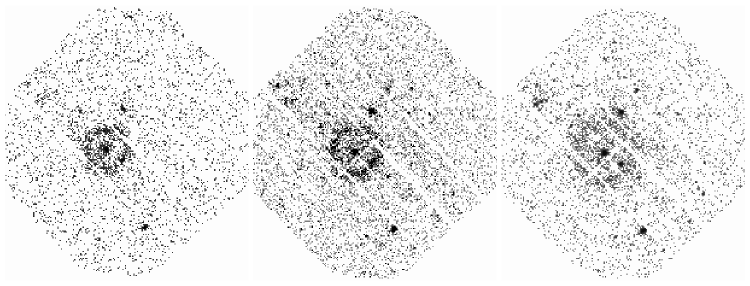
If the halo surface brightness is sufficiently high, the expanding ring can be easily detected by comparing X-ray images taken at different times, as illustrated in Fig. 1 for GRB 031203. The images shown in Fig. 1 are based on data obtained with the PN camera (Strüder et al. (2001)) of the XMM-Newton EPIC instrument, during a 56 ks long observation that started 6.5 hours after the burst. We propose an alternative method to visualize and detect an expanding X–ray ring, based on the construction of a dynamical image in which each count, detected with position xi,yi and arrival time Ti, is binned according to its new coordinates
Xi Ti – T0 = ti
Yi =
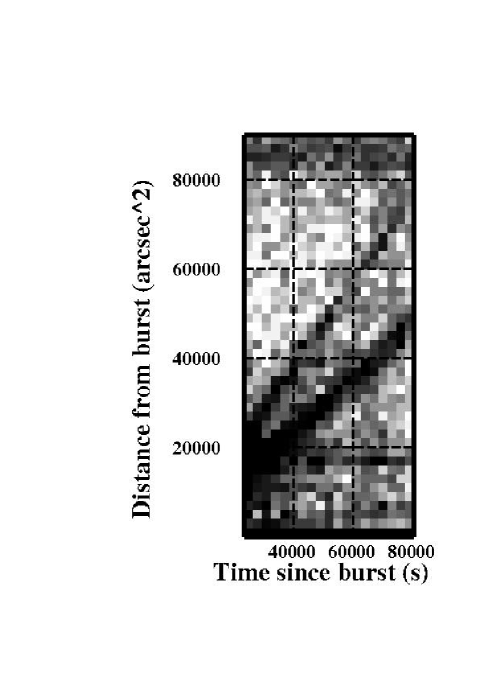
where T0 is the time of the burst and xB, yB are its coordinates. Each point of a dynamical image corresponds to an angular distance from the GRB and to a time delay. Celestial sources at fixed positions appear as horizontal lines, while expanding rings centered at the GRB position xB, yB are visible as inclined lines, with angular coefficient inversely proportional to the scattering dust distance ds.
Fig. 2 shows the dynamical image of GRB 031203, based on exactly the same EPIC PN counts of Fig. 1. The two expanding rings, produced by scattering in dust slabs at d900 pc and d1400 pc (Vaughan et al. (2004)) are clearly visible.
To estimate the dust distance and the flux in the halo we proceed as follows. After removing the brightest point sources, for each detected count we compute the quantity
= 827
The halo photons obey relation (1), contrary to the background counts and photons from other sources in the instrument field of view. Therefore, a halo is visible as a peak centered at ds in the distribution n(D) of the Di values. A spatially uniform instrumental background gives a contribution proportional to D-2 in the range from Dmin = 2c tmax/ to Dmax = 2c tmin/, where tmin, tmax, and delimit the rectangular region of the dynamical image from which the counts are extracted.
Fig. 3 shows the distribution of Di (in the range Dmin–Dmax) obtained selecting from the dynamical image of GRB 031203 the events with 1. The two peaks corresponding to the dust scattering rings are clearly visible, superimposed on the background contribution. A good fit to the data in Fig. 3 (=1.00 for 143 d.o.f.) is obtained with the sum of a power law with index 0.02 and two Lorentzian curves centered at 8705 pc and 13849 pc, and with FWHM of 82 pc and 24030 pc, respectively (all the errors are at the 90% c.l. for a single parameter of interest). These widths are compatible with the expected values of 100 pc and 200 pc, respectively, caused by the instrumental Point Spread Function of 6′′. The net number of halo counts, obtained by integrating the two Lorentzians, are 840 counts for the outer ring (ds=870 pc) and 1740 counts for the inner ring (ds=1384 pc).

3 Spectral analysis and prompt X-ray emission of GRB 031203
When both the scattered and unscattered radiation are measured, it is possible to deduce the properties of the dust. On the other hand, for GRB halos, we usually can measure only the scattered component of an X-ray pulse of unknown intensity emitted at (or close to) the time of the burst. In order to derive some information on such prompt X-ray emission from the observed halo, we must assume the dust properties and the optical depth for X-ray scattering (or deduce them from independent measurements). In the following, we adopt a model of dust composed by carbonaceous and silicate grains which is in good accord with several observations (Draine (2003)) and we assume AV=2 for the total extinction due to the two dust layers in the direction to GRB 031203 (Neckel & Klare (1980)).
The fluence FH of the radiation scattered in the halo between the angles and is related to that emitted from the source F(E) by the following relation:
FH(E,,) = F(E) (g(,E) – g(,E)) (2)
where g(,E) is the fraction of halo photons scattered at angles smaller than and is the scattering optical depth of the dust layer, related to the optical absorption AV by 0.15 AV E-1.8(keV) (Draine & Bond (2004)). For a narrow scattering layer close to the observer, which applies to our case, the halo profile is well approximated by
g(,E) ()2 / (1+()2) (3)
with = 360′′/E(keV) (Draine (2003)). Fitting the halo spectrum with eq. (2) it is then possible to derive the spectrum and intensity of the prompt emission.
To extract the background subtracted count spectra of the two rings we have applied the procedure described in Section 2 to the distributions n(D) relative to 16 energy channels in the range 0.8-2.2 keV (the halo has a very soft spectrum and is not visible at higher energy. Due to the small number of counts in each distribution, we have kept the centers and widths of the Lorentzians fixed at the best fit values previously found for the total energy range. We described F(E) as an absorbed power law with photon index , and implemented equation (2) as a spectral model in the XSPEC fitting package. This was used to fit simultaneously the counts spectra of the two rings. To reduce the number of free parameters, we kept the interstellar absorption fixed at the value derived from the afterglow emission NH=8.81021 cm-2 (Vaughan et al. (2004)) and linked the optical depths of the two dust layers using the total value corresponding to AV=2: = 0.3 E-1.8.
The best fit yielded a photon index =2.10.2 and a fluence of (3.60.2)10-7 erg cm-2 (1–2 keV) for the GRB emission, and A=0.60.05 (corresponding to AA=1.40.05).
These values can be compared with those obtained with a different method and using the EPIC MOS data by Vaughan et al. (2004). They concluded that, to match the power law photon index of the halo (3.30.15, from a spectrum extracted only in the first part of the observation), a value of 2 is required for the prompt X-ray emission. They also found that the best fit to the structure of the two rings is obtained by attributing 2/3 of the total column density to the more distant dust slab. These results are in accord with those derived in our analysis. Vaughan et al. obtain a time integrated flux for the prompt emission of 1600800 photons cm-2 keV-1 at 1 keV, while the revised value of 1320260 photons cm-2 keV-1 at 1 keV, has been recently reported by the same group (Watson et al. (2005)). For a power law spectrum with =2, the latter value corresponds to a fluence of (1.50.3) erg cm-2 in the 1-2 keV range, a factor 4 higher than our measurement. This discrepancy can be in part attributed to the different relation between and AV adopted by these authors.
4 The halo of GRB 050713A
The advantages of using the dynamical images are particularly evident when the scattering halos are not easily visible in the normal images, as in the case described here for GRB 050713A.
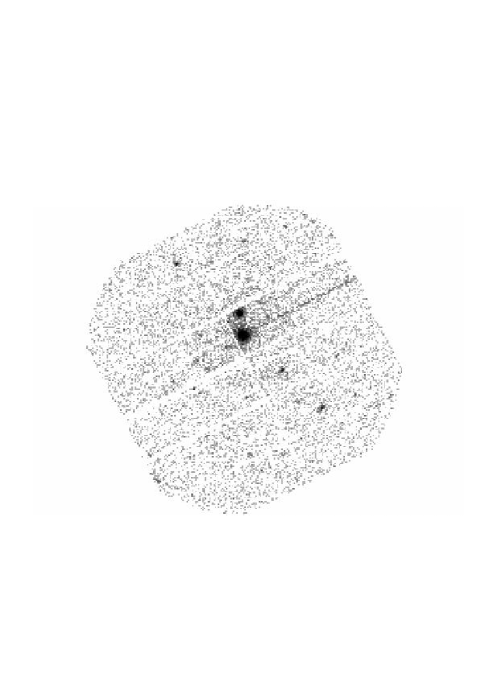
GRB 050713A was discovered and promptly localized (Falcone et al. (2005)) with the Swift satellite, which also detected its X-ray afterglow (Morris et al. (2005)). A Target of Opportunity observation was carried out with XMM-Newton (Loiseau et al. (2005); De Luca et al. (2005)) starting 23 ks after the GRB prompt emission. Part of the 30 ks long observation was badly affected by soft protons flares. Filtering out the time intervals with the highest background reduces the EPIC PN net exposure time to only 9.2 ks. The corresponding image in the 0.5–2 keV range (Fig. 4) shows the presence of some diffuse emission around the GRB position, but the short exposure time does not allow us to extract time resolved images sensitive enough to detect an expanding ring.
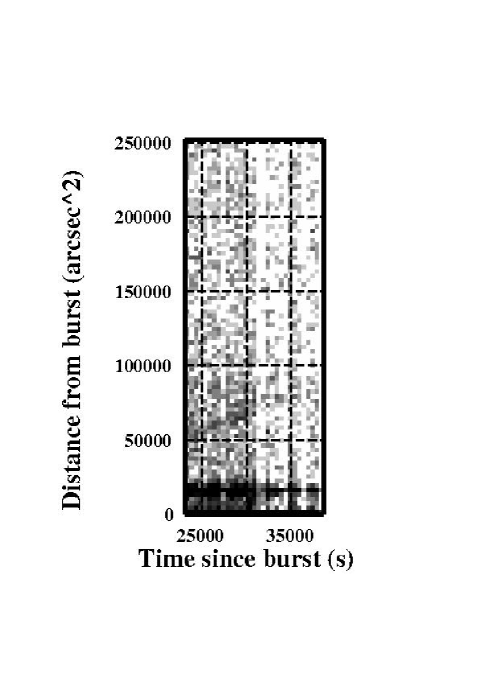
On the other hand, the presence of an expanding halo is manifested by the inclined line starting at 50,000 arcsec2 visible in the dynamical image (Fig. 5). More quantitative information is obtained from the distribution n(D) shown in Fig. 6. This has been obtained with the counts in the 0.5-2 keV energy range and excluding the brightest point sources. A fit with a power-law gives a of 1.70 for 92 d.o.f., while the addition of a Lorentzian centered at 364 pc improves it to 1.23 for 89 d.o.f.. The Lorentzian FWHM is 33 pc, consistent with the width of 30 pc caused by the PN angular resolution, and the total number of counts in the Lorentzian is 185. The best fit power-law index is –1.650.03.

Since in this case the presence of the peak is less compelling than in GRB 031203, we have also analyzed the MOS data. The MOS exposure started 40 minutes before the PN one and the MOS detectors are less sensitive than the PN to soft protons; therefore, after the exclusion of the time intervals with the highest background, the MOS exposure time is 2 times larger than the PN one. Figure 7 shows the distribution n(D) (in the range Dmin–Dmax corresponding to 110′) obtained from the events of the two MOS units selected in the 0.5–2 keV energy range, with pattern 0–12, and excluding the point sources. The fit results (=1.17 for 62 d.o.f.) are consistent with those obtained with the PN data: a power-law with index =0.02 and a Lorentzian centered at 3646 pc with a FWHM of 45 pc. The total number of counts in the Lorentzian is 290, consistent with the value found with the PN, that has a 30% larger effective area than the sum of the two MOS but a factor 2 shorter exposure time.
Due to the low number of counts detected in the halo of GRB 050713A, we used only three energy channels (0.5–1 keV, 1–1.5 keV, and 1.5–2 keV) to extract the halo spectra. The PN and MOS spectra were fit simultaneously using the same model applied to GRB 031203, with an appropriate correction factor to account for the time gaps produced by the soft protons filtering and for the different exposure times of the two instruments111the presence of time gaps translates into an incomplete sampling of the halo radial profile, that can be accounted for by a generalization of eq.(2). We assumed AV=0.5 mag (Hakkila et al. (1997)) and the X–ray absorption measured for the afterglow, NH=3.251021 cm-2 (De Luca et al. (2005)). The best fit yielded a power law photon index =1.40.6 and a fluence of (1.20.3)10-7 erg cm-2 (1–2 keV unabsorbed) for the prompt GRB emission.
The 1-2 keV fluence obtained by extrapolating the spectrum measured in the 15-350 keV range by Swift-BAT (Palmer et al. (2005)) is (3.61.1) erg cm-2, slightly higher than the value derived from our analysis.

5 Search for halos around other GRBs
To search for other dust scattering halos, we analyzed the EPIC PN data of all the GRB observations performed after a delay smaller than one day. The sample consists of the 14 GRBs listed in Table 1. Except for the two cases discussed above, the n(D) distributions did not show the presence of well defined peaks. For eleven GRBs, good fits ( in the range 0.9-1.2) were obtained with power laws indexes in the range from –2 to –1.9 (the results of the fits are summarized in Table 1). This range of values is consistent with that ( to ) found by analyzing the n(D) distributions of several EPIC PN observations of blank fields (we assumed and at the center of the field of view and T0 at 20,000 s before the start of the observation).
Only for GRB 050730 a power law gave a bad fit, but no well defined peaks are present in its n(D) distribution. A careful inspection of the PN image shows the presence of some diffuse emission in the field of GRB 050730, which is likely responsible for the deviations from the distribution expected for a uniform background.
| GRB | l | b | NH | tstart | tstop | (d.o.f.) | |
|---|---|---|---|---|---|---|---|
| name | (∘) | (∘) | (1020 cm-2) | (s) | (s) | ||
| GRB010220 | 135 | 1 | 86 | 63370 | 97200 | –1.960.01 | 1.11(286) |
| GRB011211 | 275 | 36 | 4.2 | 43630 | 73410 | –1.920.01 | 0.92(168) |
| GRB020321 | 308 | –23 | 8.2 | 42930 | 88110 | –1.9580.01 | 1.21(250) |
| GRB020322 | 113 | 29 | 4.6 | 55650 | 81950 | –1.9670.009 | 1.08(449) |
| GRB030227 | 181 | –14 | 22 | 46740 | 77110 | –1.950.01 | 1.19(181) |
| GRB031203 | 256 | –5 | 60 | 23500 | 79830 | –1.650.02 | 7.6(149) |
| GRB040106 | 293 | 15 | 8.6 | 22100 | 63160 | –1.920.02 | 1.06(174) |
| GRB040223 | 342 | 3 | 60 | 24100 | 60030 | –1.910.02 | 0.89(128) |
| GRB040827 | 346 | 34 | 8.4 | 25240 | 76580 | –1.950.01 | 0.94(222) |
| GRB050223 | 331 | –19 | 7.1 | 38830 | 96940 | –1.9750.008 | 1.00(601) |
| GRB050326 | 306 | –46 | 4.5 | 35530 | 75850 | –1.930.03 | 1.16(50) |
| GRB050713A | 112 | 19 | 11 | 23160 | 46260 | –1.650.03 | 1.70(92) |
| GRB050730 | 337 | 54 | 3.1 | 29520 | 59850 | –1.740.02 | 2.27(109) |
| GRB050820B | 288 | –17 | 8.4 | 21360 | 78000 | –1.9620.008 | 1.08(734) |
The Table reports the GRB Galactic coordinates, the Galactic absorption (Dickey & Lockman (1990)), the start and stop of the observation with respect to the time of the GRB prompt emission, the power law slope fitted to the n(D) distribution, and the value and number of degrees of freedom of the fit.
6 Discussion
In principle, from the observation and modelling of a dust scattering halo, it is possible to obtain useful information on the prompt GRB X–ray emission and the early phases of the afterglow, even when these are not directly observed. This is particularly interesting in the case of GRB 031203, since it has been suggested that this low red-shift burst (z=0.105, Prochaska et al. (2004)) was unusually under-energetic, despite having the properties of a normal, long duration GRB (Sazonov et al. (2004)). The high value of the soft X–ray fluence inferred from the dust halo is relevant for the overall energetics and spectral shape of this burst.
In the 20-200 keV energy range observed with INTEGRAL, GRB 031203 had a fluence of (2.00.4)10-6 erg cm-2, a spectrum well described by a power law with photon index =1.630.06, and a duration of about 40 s (Sazonov et al. (2004)). Watson et al. (2005) derived an X-ray fluence about one order of magnitude above the extrapolation of the INTEGRAL spectrum. To explain such a large discrepancy, these authors concluded that GRB 031203 consisted of two distinct pulses: the first one with a hard spectrum detected by INTEGRAL, followed by a softer one responsible for the bright X–ray scattering halo. The X-ray fluence obtained with our method, although smaller than that found by Watson et al., still indicates that the X-ray emission from GRB 031203 was not a simple extrapolation of that measured above 20 keV. This is also consistent with the fact that the spectrum we obtained for E2 keV (=2.10.2), is steeper than that measured with INTEGRAL (=1.630.06, Sazonov et al. (2004)).
We have discovered that also GRB 050713A has a dust scattering halo, produced by a thin (50 pc) dust layer at a distance of 3647 pc. This distance is small enough to be compatible with the rather high Galactic latitude (b=18.8∘) of this burst. Extrapolating to the 1–2 keV energy range the spectrum measured above 15 keV with Swift-BAT (a power law with =1.580.07, Palmer et al. (2005)), gives a fluence a factor 3 higher than that we estimated from the analysis of the scattering halo. Contrary to the case of GRB 031203, the difference could be explained by a spectral steepening between the XMM-Newton and Swift-BAT energy range. However, the spectral slope we inferred for the X–ray emission, although poorly constrained (=1.40.6), is consistent with that measured with Swift-BAT. Therefore, another possibility to reconcile the fluence values is that we overestimated the amount of dust in the scattering layer, which was derived from the assumption of AV=0.5 mag.
Finally, we note that the best fit values of the power-law indexes found for the n(D) distributions of GRB 031203 and GRB 050713A are significantly different from those seen in XMM-Newton blank fields and in observations of other GRB afterglows. The latter have values of only slightly flatter than –2, as expected due to the non–uniform background distribution over the field of view. The large values of =–1.8 and –1.7 seen only in GRB 031203 and 050713A could be somehow related to the presence of the scattering halos. Different phenomena might produce this effect. Two equivalent possibilities are scattering of the prompt X–ray emission by dust distributed at different distances along the line of sight, and the scattering of the X–ray afterglow (i.e. emission occurring after the GRB) by the same dust layers responsible of the Lorentzian peaks. Another likely effect is the presence of photons undergoing more than a single scattering by the dust grains. Note that in this case there is no univocal relation between time delay and . The resulting faint diffuse emission around the GRB position will only affect the continuum distribution of n(D), leaving the peaks due to single scattering at definite distances unaltered.
7 Conclusions
We have developed a simple method to analyze dust scattering expanding rings around GRBs, and applied it to XMM-Newton data of GRB 031203, the first burst to show a time variable dust scattering halo (Vaughan et al. (2004)). Similar to these authors, who used a different method and data set, we found that the dust responsible for the two observed expanding rings is unevenly distributed in two narrow (100 pc and 270 pc, respectively) layers at distances of 8705 and 13849 pc, with the more distant one responsible for 70% of the total optical depth.
Thanks to the sensitivity of our method, we could show that also GRB 050713A has a dust scattering halo, produced by a thin (50 pc) dust layer at a distance of 3647 pc. Moreover this method allows very accurate determinations of the dust cloud distances.
We can expect that a growing number of dust scattering halos around GRBs will be detected in the near future, thanks to the rapid GRB localizations provided by currently operating satellites and the possibility to perform sensitive follow-ups with good quality X-ray imaging instruments. Most of these halos will probably be relatively faint and not easily visible in time resolved images, while using the method proposed here it will be possible to detect them.
XMM-Newton observations of mid galactic latitude GRBs are ideal to uncover more dust scattering halos, thanks to the high sensitivity and large field of view of the EPIC instrument. The response time for XMM-Newton rapid follow-ups (from 5 to 8 hours) is well matched to the time delays expected from dust layers in our Galaxy at distances in the range from 100 pc to a few kpc, and the angular resolution of EPIC is adequate for the resulting structures, typically of the order of a few arcmin radius. Earlier observations could reveal rings with smaller radii, but this also requires a good angular resolution, as obtainable e.g. with Chandra222which, however, has in general a longer reaction time than XMM-Newton for GRB follow-up observations, to disentangle the emission of the expanding halo from that of the central afterglow source.
It is evident from the two GRB halos discussed above that the derivation of quantitative information on the unscattered X-ray emission is presently subject to large systematic uncertainties due to the assumptions required in the halo modelling. In this respect, the observation with XMM-Newton and/or Swift-XRT, of dust halos around GRBs for which bright prompt X-ray (or early afterglow) emission is detected by Swift would be extremely useful, since it could give the chance to compare the X–ray properties inferred from the halo with those actually observed. The dust halo reported around GRB 050724 (Romano et al. (2005)) has already demonstrated the Swift capabilities to detect such features. A systematic application of the method presented here to all GRB follow-up observations would possibly enlarge the sample through the detection of fainter halos, not immediately seen in the traditional X–ray images.
Acknowledgements.
This research has been partially supported by the Italian Space Agency. We thank N.Schartel and the staff of the XMM-Newton Science Operation Center for performing the GRB follow-up observations.References
- De Luca et al. (2005) De Luca A. et al. 2005, GCN Circ. n. 3695
- Dickey & Lockman (1990) Dickey J.M. & Lockman F.J. 1990, ARA&A 28, 215
- Draine (2003) Draine B.J. 2003, ApJ 598, 1096
- Draine & Bond (2004) Draine B.J. & Bond N.A. 2004, ApJ 617, 987
- Falcone et al. (2005) Falcone A. et al. 2005, GCN Circ n. 3581
- Hakkila et al. (1997) Hakkila, J., Myers, J. M., Stidham, B. J., & Hartmann, D. H. 1997, AJ 114,2043
- Loiseau et al. (2005) Loiseau N. et al. 2005, GCN Circ. n. 3594
- Mathis & Lee (1991) Mathis J.S. & Lee C.-W. 1991, ApJ 376, 490
- Mauche & Gorenstein (1986) Mauche C.W. & Gorenstein P. 1986, ApJ 302, 371
- Mereghetti et al. (2003) Mereghetti S., Götz D., Borkowski J., Walter R. & Pedersen H., 2003, A&A 411, L291
- Miralda-Escudé (1999) Miralda-Escudé J. 1999, ApJ 512, 21
- Morris et al. (2005) Morris D. et al. 2005, GCN Circ. n. 3606
- Neckel & Klare (1980) Neckel T. & Klare G. 1980, A&AS 42, 251
- Klose (1994) Klose S. 1994, A&A 289, L1
- Palmer et al. (2005) Palmer D. et al. 2005, GCN Circ. n. 3597
- Paczynski (1991) Paczynski B. 1991, Acta Astronomica 41, 257
- Predehl & Schmitt (1995) Predehl P. & Schmitt J.H.M.M. 1995, A&A 293, 889
- Prochaska et al. (2004) Prochaska J.X. et al. 2004, ApJ 611, 200
- Romano et al. (2005) Romano P. et al. 2005, GCN Circ. n. 3685
- Sazonov et al. (2004) Sazonov S.Y., Lutovinov A.A. & Sunyaev R.A. 2004, Nature 430, 646
- Strüder et al. (2001) Strüder L. et al. 2001, A&A 365, L18
- Trümper & Schönfelder (1973) Trümper J. & Schönfelder V. 1973, A&A 25, 445
- Vaughan et al. (2004) Vaughan S., Willingale R., O’Brien P.T., et al. 2004, ApJ 603, L5
- Watson et al. (2005) Watson D., Vaughan S.A., Willingale R., et al. 2005, ApJ Letters in press, astro-ph/0509477