Abundances in red giant stars of NGC 2808 and correlations between chemical anomalies and global parameters in globular clusters11affiliation: Based on data collected at the European Southern Observatory, Chile, during the FLAMES Science Verification program with the UVES spectrograph at VLT-UT2.
Abstract
We present the abundance analysis of stars from the tip of the red giant branch (RGB) to below the RGB-bump in the globular cluster NGC 2808, based on high resolution echelle spectra. We derived abundances of Al, -process elements (Si I, Ca I, Ti I and Ti II) and Fe-group elements (Sc II, V I, Cr I, Cr II, Mn I, Co I, Ni I). Apart from Mg being somewhat reduced, likely because it has been depleted at the expense of Al in the MgAl cycle, the other -element ratios show the overabundance typical of halo stars of similar metallicity. Mn is underabundant, whereas Fe-group elements have typical abundance ratios near the solar value. We detect star-to-star differences in Al abundances from the RGB tip down to the faintest star below the RGB-bump, correlated with Na abundances at all luminosities. The slope of the Na-Al correlation is similar to the one found in M 13 by Sneden et al. (2004), but it is different from those in other globular clusters of similar metallicity. We find that the amount of chemical inhomogeneities along the Na-O and Mg-Al anticorrelations in globular cluster red giants is correlated with the present day cluster mass and ellipticity. Moreover, we find for the first time a correlation between the spread in proton-capture elements and orbital parameters of clusters. The chemical anomalies are more extended in clusters having large-sized orbits and longer periods, and in clusters with larger inclination angles of the orbit with respect to the Galactic plane.
1 Introduction
Galactic globular clusters (GCs) are a real gold mine to dig out important informations in a variety of astrophysical issues ranging from dating the Universe through stellar clocks, to stellar evolution studies, to the formation and early chemical evolution of the Galaxy. Nevertheless, little is known about origin and formation processes. Typical present-day masses for GCs are tantalizingly close to those characteristic of protogalactic clouds as estimated, e.g., from the surprisingly small scatter observed in Mg and other elements in extremely metal-poor stars (Carretta et al., 2002). However, the exact formation mechanism is still unknown, even if a few tentative models have been proposed, starting with the pioneering work by Cayrel (1986) (see also Parmentier 2004 and references therein).
Fortunately, the detailed chemical composition of their stars can help us with this issue: in low-mass, long-living GC stars there is a “black box” where the conditions existing when the clusters converted its gas into stars are recorded (apart from a few alterations due to stellar evolution).
Although present theoretical models seem to show a lag in (at least quantitatively) correctly reproducing all the observations, abundance analyses are unveiling a more and more defined, though complex, pattern. In particular, light elements (C, N, O, Na, Mg, Al) involved in proton-capture synthesis seem to play a key role in shaping the overall chemical composition of GC stars (see the review by Gratton, Sneden & Carretta 2004 for a summary and updated references). The discovery of anticorrelations (and correlations) between elements arising from capture chains such as NeNa and MgAl in unvevolved cluster stars (Gratton et al., 2001; Carretta et al., 2004b; Ramírez & Cohen, 2002, 2003) provides a fundamental piece of information. The temperature in the H-burning shell of low mass stars presently observed in GCs cannot be high enough to efficiently operate the MgAl chain (Langer & Hoffman, 1995); moreover, unevolved stars burn H only in their cores and do not have convective envelope able to mix out products of inner nuclear processes. Thus the inference is that this synthesis took place in a prior generation of more massive stars already evolved and died in the few 108 yrs since the cluster formation (see Carretta et al. 2005 for a detailed discussion about the mass ranges of likely candidates).
Hence, these light elements are direct witnesses of the very early phases in the lifetime of a GC and deriving accurate abundances of capture elements in a large number of stars for an extensive sample of GCs is a crucial goal.
The target of the present study, NGC 2808, is a peculiar cluster of intermediate metallicity, famous for the bimodal distribution of stars on the horizontal branch (HB), maybe related to the He content imprinted early in the cluster life (see for instance D’Antona & Caloi 2004). Despite its peculiarity, NGC 2808 had not received a great deal of attention in stellar abundance analyses until very recently, but is now becoming one of the most well studied clusters. Carretta et al. (2003) analyzed more than 80 red giants to derive Na abundances, unveiling for the first time in this cluster large star-to-star variations in the abundance of a capture element. Afterwards, Carretta et al. (2004a) found that the well-known Na-O anticorrelation discovered by the Lick-Texas group (exhaustive references in Gratton, Sneden & Carretta 2004) is also present in NGC 2808, where large levels of O depletion and Na enhancement are observed. The study of the Na-O signature will be soon extended to a sample of 130 stars in a forthcoming paper (Carretta et al. 2005, in preparation).
Nevertheless, nothing has been said yet about the elements heavier than Na. In the present work we fill this gap by studying the detailed composition of 19 RGB stars and by deriving abundances for species from Al to Ni. A comparison with M 5 and M 4, clusters with metallicity very similar to the value [Fe/H] dex111We adopt the usual spectroscopic notation, [X]= log(X) log(X)⊙ for any abundance quantity X, and log (X) = log (NX/NH) + 12.0 for absolute number density abundances. found for NGC 2808 (Carretta et al., 2004a), will greatly help to highlight similarities and differences in the abundance patterns, since analyses of comparable resolution, quality and sample size are available for these three clusters.
Finally, we put together a sample of well studied GCs, with abundance analyses from high resolution spectra of at least 20 stars per cluster, to search for correlations between chemical inhomogeneities and global cluster parameters. We show that the amount of spread along the Na-O and Mg-Al anticorrelations seems to be somewhat related to the present day masses and ellipticities of GCs. Moreover, we uncovered for the first time a well defined relation between the chemical anomalies in elements originated from capture reactions and orbital parameters of the clusters.
The paper is organized as follows: Sections 2, 3 and 4 are devoted to the observations and analysis; Section 5 presents the derived abundances and in Section 6 we define a quantitative estimate of the amount of chemical inhomogeneity in a cluster and its possible correlation with chemistry, structural and orbital cluster parameters.
2 Observations and data reduction
The program stars were observed during the FLAMES Science Verification program at the ESO Paranal Observatory in 2003, January 24-25. Thirteen RGB stars were selected from the database of Bedin et al. (2000) in the uppermost 0.8 mag interval from the tip (). The other 7 targets were chosen to sample the 2.5 fainter magnitudes; the two faintest stars are located just below the RGB-bump (at in this cluster, Bedin et al. 2000). All these stars were observed with the fiber fed Red Arm of the high resolution spectrograph UVES (, fibers of 1 arcsec entrance aperture, grating centered at 5800 Å with spectral coverage of about 2000 Å).
NGC 2808 is quite concentrated and our targets are within a 7 radius from the cluster center; all stars were chosen to be free from companions closer than 2.4 arcsec and brighter than , where is the target magnitude.
Data reduction of the UVES spectra, using an ad hoc Data Reduction Software (Mulas et al., 2002), included bias subtraction, flat-fielding correction, correction for scattered light, spectra extraction and wavelength calibration using a reference Th-Ar calibration lamp. The reduction is described at length in Cacciari et al. (2004), where details of the observations can be found, as well as magnitudes and coordinates of the program stars.
Multiple exposures for the same stars were coadded, after a shift to zero radial velocity, to enhance the values. However, the ratios vary a lot, since the selection of stars in the Science Verification program was optimized for studying mass loss, not for abundance analysis. Final values are listed in Table 1 of Carretta et al. (2004a). As found in that study, the spectrum of star 34013 (below the magnitude of the RGB-bump, with a ) was mostly useless to derive reliable equivalent widths, so this star was dropped from further analysis.
3 Atmospheric parameters and Iron abundances
The procedure adopted to derive effective temperatures and surface gravities is reported in detail in Cacciari et al. (2004). Briefly summarizing, we used magnitudes taken from the Point Source Catalogue of 2MASS (Cutri et al., 2003) and transformed to the TCS photometric system.
We obtained Teff’s and bolometric corrections from dereddened colors, by employing the relations by Alonso et al. (1999, eqs. 7 and 17, with the erratum of 2001). Surface gravities log ’s were obtained from effective temperatures and bolometric corrections, assuming that the stars have masses of 0.85 M⊙. The adopted bolometric magnitude of the Sun is .
We adopted a distance modulus of =15.59 and a reddening of = 0.22 (from Harris 1996)222As updated at http://physun.physics.mcmaster.ca/Globular.html, and the relations , , and (Cardelli et al., 1989). The magnitudes, colors and derived parameters for all stars in our sample are listed in Cacciari et al. (2004).
In Cacciari et al. (2004) an average internal error of 70 K in temperature was derived over the magnitude range sampled by the FLAMES Science Verification program. This is likely an overestimate of the actual error affecting the brighter stars in the present study: judging from photometric errors quoted by Bedin et al. (2000) and those associated to 2MASS magnitudes333See www.ipac.caltech.edu/2mass/releases/allsky/doc/sec2_2.html#pscphotprop, a more realistic estimate would be K for this group of stars (including a contribution from errors in reddening), increasing up to 52 K for the faintest stars in our sample, where 2MASS errors increase from 0.02 mag to 0.04 mag. However, because the observed stars cover such a large range in magnitude, in the following we keep 70 K as a conservative estimate of random errors in Teff.
In the upper panel of Figure 1 we plot the values of the slopes of the abundances from neutral Fe I lines with respect to the excitation potential for individual stars in our sample, as a function of the adopted Teff’s from photometry. This Figure supports the reliability of the adopted temperature scale: it seems to reproduce quite well the excitation equilibrium within the errors: the average value of the slope dex/eV with dex/eV corresponds to about 60 K.
Since surface gravities are derived from the position of stars in the color-magnitude diagram, internal errors should take into account uncertainties in bolometric corrections, distance moduli, adopted temperatures and masses. Summing in quadrature all these contributions (see e.g. Carretta et al. 2004b) we find internal errors not larger than 0.1 dex associated to the adopted gravities. The good ionization equilibrium found for Fe (Carretta et al., 2004a) supports the adopted values of .
Microturbulent velocities were derived for each star by eliminating trends in the relations between expected line strength (see Magain 1984) and abundances from neutral Fe lines. In the lower panel of Figure 1 we show the resulting slopes for the sample. Random error of km s-1 can be estimated from typical uncertainties in the slopes of the above relationships.
Finally, we interpolated in the Kurucz (1993) grid of model atmospheres (with the overshooting option set on) choosing the model with the appropriate atmospheric parameters whose metal abundance was the best match to the derived Fe abundance. Internal errors in metallicity, as evaluated from the star-to-star scatter, are about 0.05-0.06 dex.
Table 1, reproduced from Carretta et al. (2004a), lists the stellar atmospheric parameters and the ratios of our sample of stars in NGC 2808, as well as the derived abundances of [Fe/H] from Fe I and Fe II. The 1 rms value about the mean abundance is also listed for each stars, together with the number of lines used.
4 Analysis
The abundances were derived using the atmospheric parameters discussed in the previous Section, the Kurucz (1993) set of stellar atmospheres and measured equivalent widths (s) for features of Al, of -process elements (Mg I, Si I, Ca I, Ti I and Ti II) and of Fe-group elements (Sc II, V I, Cr I, Cr II, Mn I, Co I, Ni I, in addition to Fe I and Fe II). Abundances of oxygen from the spectrum synthesis of the forbidden [O I] lines at 6300-63 Å and of Na from s measured on these same spectra were presented in Carretta et al. (2004a).
The s444s are available only in the electronic edition of the Astronomical Journal. were measured on the spectra using automatic routines of the recently updated ROSA package (Gratton, 1988), with Gaussian fits to measured profiles and iterative clipping to derive a local continuum around each line. The procedure is explained in details in Bragaglia et al. (2001). The list of lines and their atomic parameters are those given in Gratton et al. (2003); in particular the updated treatment of collisional damping from Barklem et al. (2000) is used, when available. Reference solar abundances are as in Gratton et al. (2003).
The abundance ratios [X/Fe] are summarized in Table 2 and Table 3, and are computed using Fe abundances from Fe I lines for neutral species and from Fe II lines for ionized species. For each species the number of measured lines, the average abundance ratio for individual stars, and the 1 rms, i.e. the standard deviation about the mean abundance, are listed. Our Al abundances rest on the doublet at 6696-98 Å, the only feature for this species falling in the covered spectral range and are listed in Table 2.
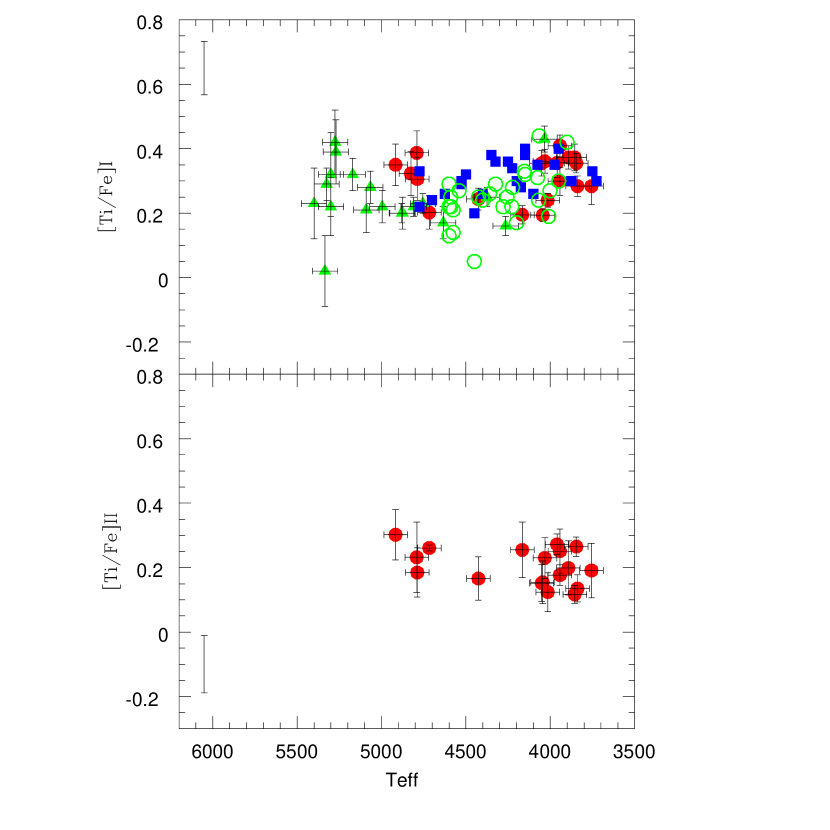
Among the -elements we derived abundances of Ti from lines in two different stages of ionization: this allows us an additional check for evidence of departures from the LTE assumption (we recall that Carretta et al. 2004a did not find any convincing evidence in their analysis of Fe abundances). On average, we found [Ti/Fe]II - [Ti/Fe]I , with an rms=0.08 dex (19 stars) and no trend with temperature. Moreover, almost half of this difference might be explained as due to typical internal errors in temperature (see below) affecting the ionization equilibrium of Ti. Hence, we do not regard this average difference as very significant. Abundance ratios of -process elements are given in Table 2.
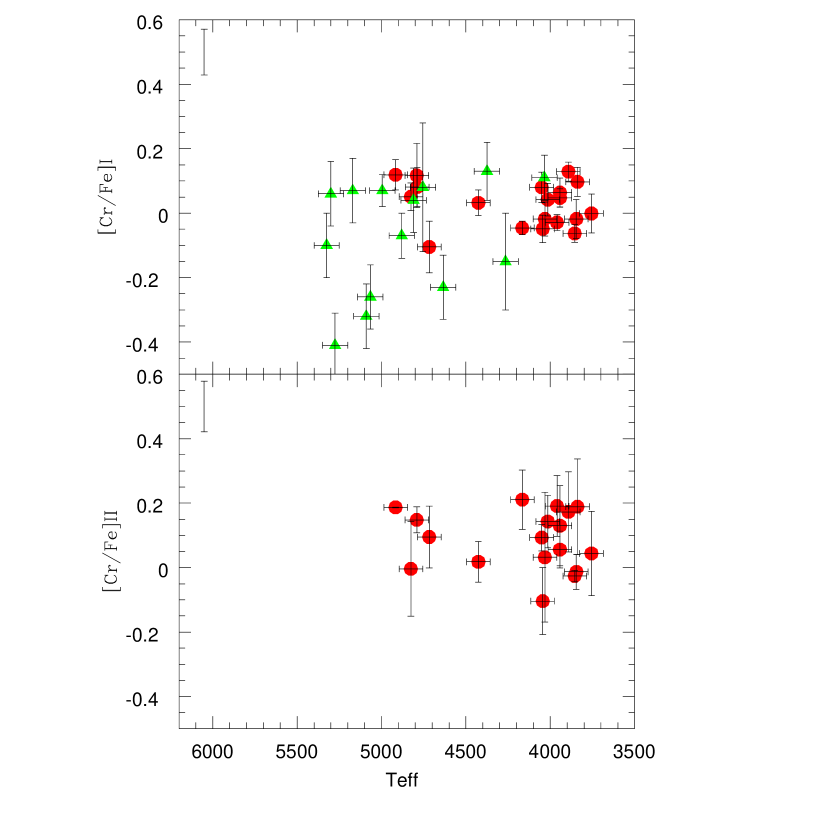
Besides Fe, lines of several elements of the Fe-group were measured. Corrections for elements with not negligible hyperfine structure splitting (Sc II, V I, Mn I) were applied; references are given in Gratton et al. (2003). For the ionization equilibrium of Cr we found on average [Cr/Fe]II - [Cr/Fe]I , with an rms=0.09 dex (18 stars), again with no trend with Teff. A typical random error of K is able by itself to produce such a shift in the Cr ionization equilibrium. Again, we regard this result as a good support for the adopted gravities and a fair argument against the existence of strong departures from the LTE assumption. Abundances of Fe-group elements are listed in Table 3.
Table 4 shows the sensitivity of the derived abundance ratios to variations in the adopted atmospheric parameters for Fe and the other elements in the present study. The entries in this Table were obtained by re-iterating the analysis while changing each time only one of the parameters. The variation in the parameter (shown in the table heading) was chosen to be equal to the typical random error previously estimated for the parameter; hence, this table represents the sensitivity of the abundances to the uncertainties in the adopted atmospheric parameters. Column 7 of Table 4 allows us to estimate the effect of errors in the s; this was obtained by weighting the error in the abundance derived from an individual line (0.116 dex, from the average error for Fe I over all stars) with the square root of the mean number of lines measured for each element. The total error bar is given in the last column as the quadratic sum of all the contributions. This exercise was done for star 48889 (among the brightest ones, near the RGB tip) and for star 43217, the faintest in our sample.
5 Derived abundances
Mean abundances for individual elements in the stars of NGC 2808 are given in Table 5, where also the average values found by Carretta et al. (2004a) for Na, O and Fe are listed; Na abundances include corrections for departures from the LTE assumption according to Gratton et al. (1999). For each average abundance we give the number of stars used in the average (column 2) and the observed star-to-star scatter (standard deviation about the mean abundance, column 3). This scatter might be compared with the total uncertainty as derived from Table 4 and listed in column 4: this value can be regarded as the predicted total error expected from the uncertainties in the atmospheric parameters combined with errors in measurements.
A quantitative test of the presence of intrinsic star-to-star variations in a given ratio may be obtained from the comparison of values in columns 3 and 4 (this approach is very similar to the so-called spread ratio introduced by Cohen & Melendez 2005). For most species, the observed star-to-star scatter is equal or even lower than expected on the basis of the error analysis. Apart from Sc II and Mn, where the small number of lines and the effects of HFS correction might combine to enhance the observed scatter, the elements clearly standing out are O, Na, Al and Mg. According to Table 4 and Table 5 these are the species whose range of abundances among stars on the RGB in NGC 2808 can be regarded as real star-to-star variations. Of course, this is exactly what is expected, because these are the elements involved in the capture reactions in H-burning at high-temperature (see Gratton, Sneden & Carretta 2004 for references) whose action is well known to provide a large spread in these abundance ratios in every globular cluster studied up to date.
The technique of using the mean and standard deviation to describe the spread of data works at best when the distributions are symmetrical, with no outliers, which may not be the case here. A graphical illustration of the spread of elements in NGC 2808 is provided by Figure 2 which is a box-and-whiskers plot (Tukey, 1977), a method well suited to explore whether a distribution is skewed and whether there are potential outliers. This kind of plot is useful to display immediately the median and the distributions of values in the range derived for each element in our sample, how they are skewed, and if there are outliers.
Figure 2 summarizes the pattern of elemental abundances in NGC 2808, quite similar to that of a typical globular cluster: the elements involved in the proton-capture processes are very spread out, the -fusion elements are overabundant and the Fe-group elements are more or less solar.
Different groups of elements are discussed in the following. To better place the issue of abundances in NGC 2808 in the framework of the typical pattern (if any does exist, see Ivans et al. 2001) of clusters at [Fe/H] we will compare the [X/Fe] ratios found in the present study with those recently obtained for cluster of similar metallicity from high resolution echelle spectra of comparable quality. We then used as a comparison stars in M4 and M 5 ([Fe/H] and dex on the metallicity scale by Carretta & Gratton 1997, a good match for the value [Fe/H] derived for NGC 2808). For M 4 we used the work by Ivans et al. (1999), and for M 5 we adopted the results from two different studies: Ramírez & Cohen (2003), who observed stars spanning a large magnitude range along the RGB, and Ivans et al. (2001).
We used the quoted or known solar reference abundances used in the original papers to apply offsets to published [X/Fe] ratios, bringing them onto our own scale (Gratton et al., 2003). Although systematic shifts due to the temperature scale or to different adopted scales of transition probabilities and (to a much lesser extent) to the grids of model atmospheres might affect the comparison, we are confident that the net effect cannot be very large. On the other hand, due to the different adopted solar abundances, offsets as large as about 0.30 dex (e.g. between our [Al/Fe] values and those from the quoted analyses) might well be present. These offsets were taken into account, before comparing the different datasets.
5.1 Proton-capture elements
Carretta et al. (2004a) presented for the first time the classical Na-O anticorrelation in NGC 2808, based on the same sample of stars analyzed here. They show that large Na and O abundance variations are found from the RGB tip down to the luminosity of the RGB-bump. In this respect, NGC 2808 simply joins the growing number of clusters where this signature of capture processes at high temperature is observed. However, it seems that stars in NGC 2808 are able to reach very large O depletions, as also seen in M 13, the paradigm cluster for these chemical anomalies. For the most O-poor star (50119) an limit of [O/Fe] dex was derived from spectral synthesis of a quite high- spectrum. This abundance well agrees with the minimum value of [O/Fe] dex (after correction to our solar reference abundances) found for star IV-25 in M 13 in the recent study of Sneden et al. (2004)555Since it is not otherwise stated, we will assume that every O abundance in M 13 is based on actual detections, not upper limits.. It seems that super O-poor stars are not an unique prerogative of M 13.
However, Na enhancements appear to be somewhat larger in M 13 than in NGC 2808: taking into account corrections for NLTE and the offset discussed above, a maximum of [Na/Fe] dex is measured for star M 13 IV-25, compared with a maximum of +0.64 dex found in NGC 2808.
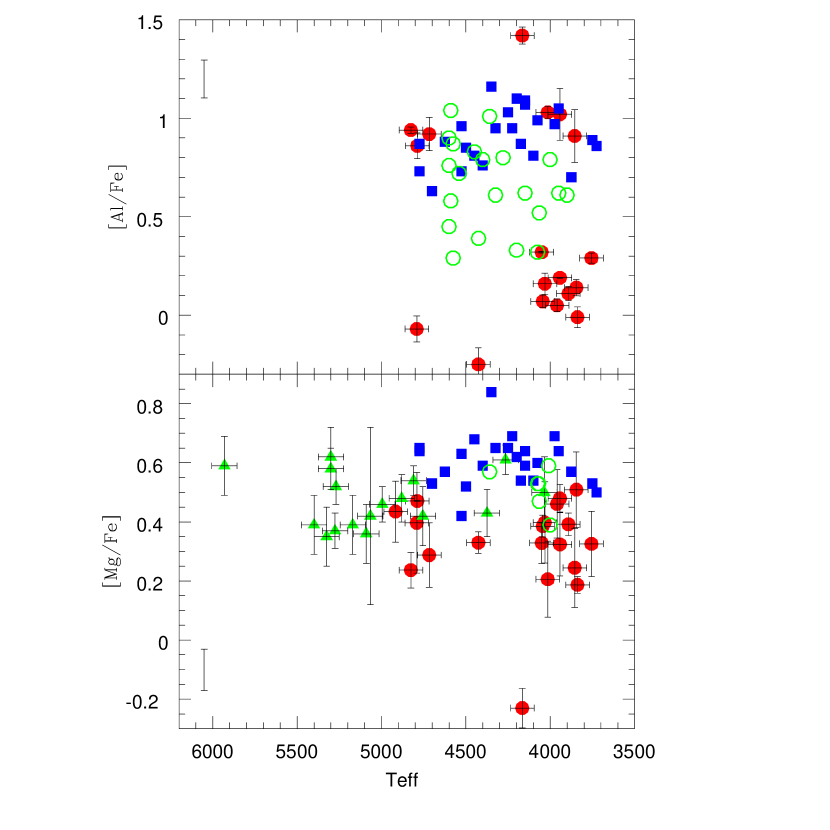
Mg and Al are the heaviest elements among those involved in the capture reactions near or within the H-burning shell in cluster giants. The production of Al at the expense of Mg the MgAl-cycle (see e.g. Langer & Hoffman 1995) does not result into a well-defined anticorrelation as the Na-O one. In fact, large variations in Al are often accompanied by much smaller changes in Mg abundances.
In Figure 3 we display the abundance ratios of Al and Mg against Teff for stars in NGC 2808, M 4 and M 5 from the present study and the quoted papers. Associated to each star we plot the typical random error in Teff and the statistical error of the mean abundance ( where N is the number of lines used for that star). This is a formal statistical uncertainty, it includes internal errors only and may be useful to give an idea of the number of features for a given element and how reliably they could be measured over all the (sometime large) magnitude range of the samples. No such errors are available for the samples in M 4 and M 5 studied by Ivans et al. (1999) and Ivans et al. (2001). The error bar with no associated point is the total internal error as given by the mean of the total uncertainties found for stars 48889 and 43217 in Table 4, to give an average estimate over all the sampled magnitude range in NGC 2808.
From Figure 3 the distribution of Al abundances in NGC 2808 appears to be bimodal, with two groups of stars clustered at high (about 1 dex) and low values of [Al/Fe]. This is clearly different from the behavior found by Ivans et al. (1999) and Ivans et al. (2001) in M 4 and M 5, respectively. A quite large spread exists in M 5, where however the distribution is rather continuous, extending from high [A/Fe] ratios down to the level corresponding to Al-poor stars in NGC 2808. In M 4 the Al abundances are more clustered around [Al/Fe] dex. In neither clusters there is evidence of two distinct groupings. Unfortunately, no Al abundance was derived in M 5 by Ramírez & Cohen (2003).
On the other hand, although we can not totally exclude that the separation in two groups in NGC 2808 is a spurious effect due to small sample statistics, the gap well exceeds the internal errors. There is no correlation between Al abundances and values; hence, bright and faint stars are present in both groups, suggesting that (i) the separation is not likely to be an artifact of the analysis and (ii) there is not strong evidence of a change or a segregation according to the evolutionary status, at least for the 3 magnitudes below the RGB tip. In turn, point (ii) suggests that the observed spread was produced in other stars, massive enough to reach the high temperature in the H shell required to forge Al. As a consequence, we do not expect an evolutionary pattern such as the increase of anomalies (here in the [Al/Fe] ratio) approaching the tip of RGB.
In the lower panel of Figure 3 [Mg/Fe] ratios in NGC 2808, M4 and M 5 are compared. Mg abundances do not show a clear anticorrelation with Al, and in M 5 and NGC 2808 the average [Mg/Fe] ratio is typical of halo stars of similar metallicity (see e.g. Gratton et al. 2003); the average ratio in M 4 seems to be slightly larger than in the other two clusters.
Star 50119 stands out with a [Mg/Fe] ratio well below the solar value; this star is also showing the highest abundance of Al in the sample. This is hardly surprising, since this star is the most O-poor presently observed in NGC 2808: very low O, high Na, high Al and low Mg are the classical signature of matter processed through the high-temperature NeNa and MgAl cycles polluting the gas out of which the stars formed. The extreme values shown by abundance ratios in this star suggest that a fraction of stars in NGC 2808 might have been subjected to heavily polluted matter: among more than 60 giants in Figure 3, star 50119 shows the most severe depletion in Mg, even exceeding those observed in the template cluster M 13.
The sum MgAl, available for 18 stars, is quite constant over all the magnitude range. On average, log(Mg+Al) = 6.68, dex (18 stars). Notice that the observed spread is well below the combined error of about 0.12 dex expected from the contribution of uncertainties in atmospheric parameters and measurement. Even the heavily polluted star 50119 has a sum of 6.70 dex ,in very good agreement with the average Mg+Al sum. The inescapable conclusion is that we are seeing a reshuffling of Al and Mg abundances in NGC 2808.
5.1.1 The Na-Al correlation
Better informations can be obtained from the expected correlation of elements such as Na and Al, predicted to be simultaneously enhanced when the NeNa and MgAl cycles are both acting: features of these elements are in general easier to measure and the associated changes in abundance are usually larger than for O and Mg.
Observing large variations in Al is a clearcut confirmation that the chemical pattern is manufactured in stars more massive than those under scrutiny, because presently evolving low-mass giants are unable to reach the high temperature required to overcome the higher Coulomb barriers of heavier elements such as Mg and Al, with respect to O and Na (Langer et al., 1997).
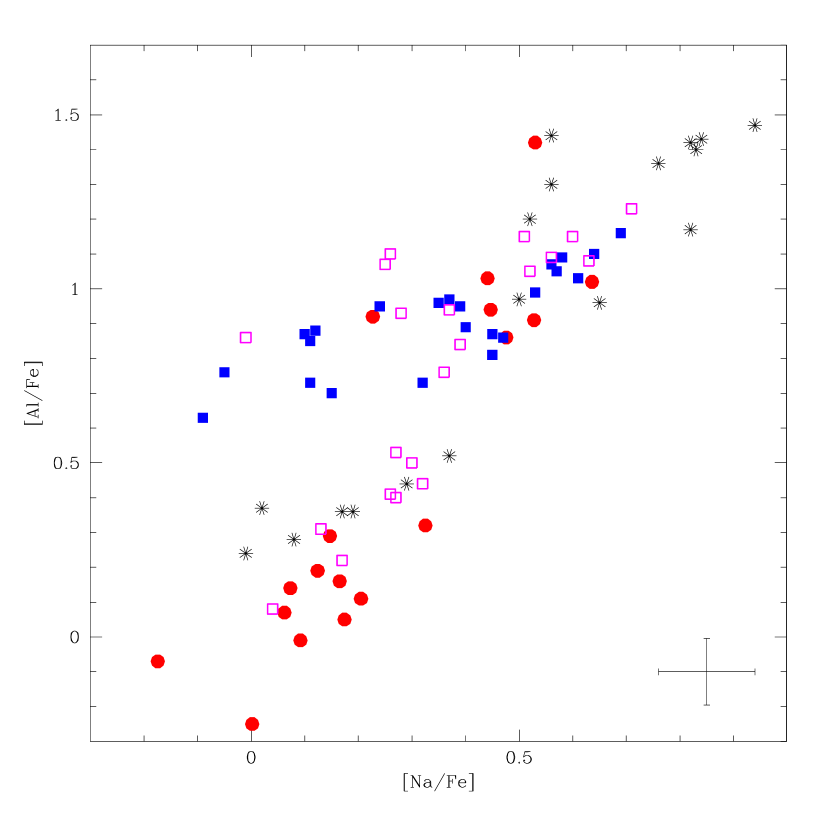
In Figure 4 we show the correlation between Na and Al abundances in a number of clusters. In the left panel we plotted data for M 4, NGC 2808 and for red giants in M 3 and M 13 from the recent work by Sneden et al. (2004). Although slightly more metal-poor than the other clusters ([Fe/H] dex on the Carretta & Gratton 1997 scale), these two other datasets help to highlight a possible feature in these diagram, maybe overlooked before. We tentatively put forward a working hypothesis: that what we are seeing is not a scattered plot, but a two-branches diagram. In other words, while a single set of data would have the appearance of a single Na-Al correlation with some scatter, the superposition of several clusters would seem to define two main loci, with differently sloped correlations. In the lower branch, from [Na/Fe],[Al/Fe]0.0,0.0 to 0.4,0.8, a change of about 0.5 dex in Na corresponds to a variation of about 0.8 dex in Al; in the upper branch (from to about 0.5,1.0), the slope is much shallower and 0.5 dex in [Na/Fe] seems to translate into a change of only 0.3 dex in [Al/Fe]. At about 0.5,1.0 the two branches intercept with each other.
The various clusters seem to differently populate these two putative lower and upper branches in what we can call a “LU-plot” (L and U refer to lower and upper branch, respectively). Stars of NGC 2808 are spread mainly along the L-branch, with some stars defining a stubby U-branch; the same occurs for M 3, even if its U-branch seems to be more extended and defined than in NGC 2808. However, stars in M 13 (the second-parameter twin of M 3) populate the L-branch, no one is falling along or near the U-branch. On the other hand, stars in M 4 seem to exclusively populate the U-branch or its prosecution to higher Na,Al values.
To strengthen the reliability of this LU-plot, we note that abundances for both M 3 and M 13 come from the very same study and a highly homogeneous procedure; hence, it would seem rather difficult to think of some effects in the abundance derivation able to produce a scatter in [Na/Fe] vs [Al/Fe] for some giants in M 3. In fact about 0.5 dex in Na abundances would be required to force all the M 3 sample to lie along a single and well defined relation as for M 13.
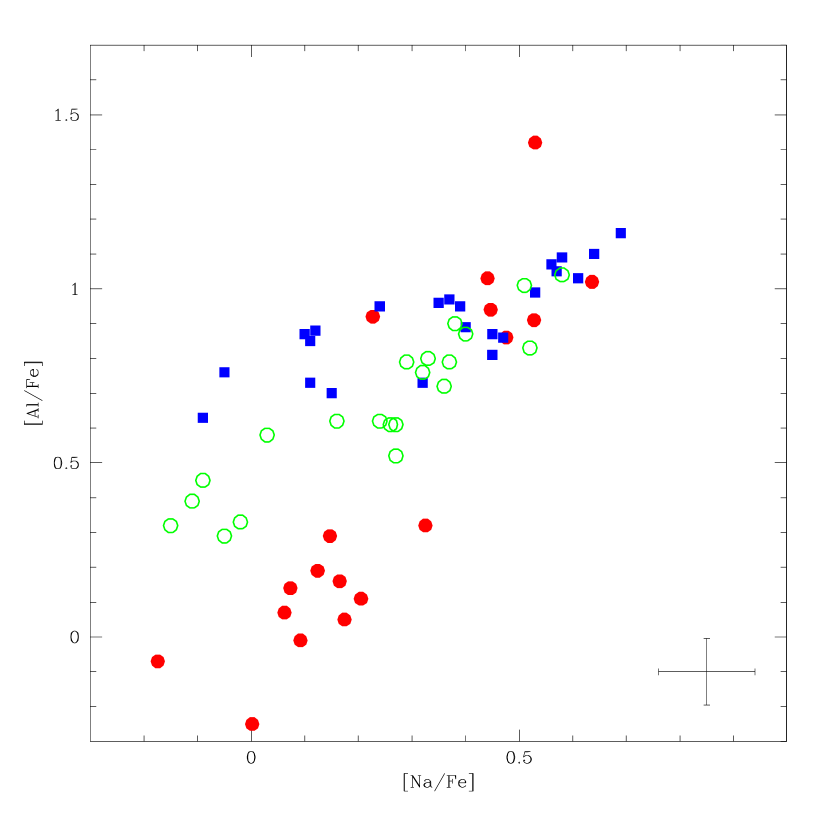
For sake of clarity, in the right panel of Figure 4 we plotted again for reference the data for NGC 2808 and M 4, and we superimposed the Na-Al relation for M 5. The case of M 5 seems more controversial, since its stars appear to fall in between the two branches and with a slope intermediate between those of M 4 and NGC 2808.
However, additional offsets might be needed, depending on whether the corrections for NLTE in Na are taken into account or not in the original studies. In their last analysis of M 3 and M 13 Sneden et al. (2004) included the corrections, based on our same prescriptions (Gratton et al., 1999); however, neither M 5 nor M 4 were treated in this way, and an additional offset in [Na/Fe] (estimated at about +0.1 dex in this metallicity and temperature range) could be required for these two clusters. This would shift stars in M 5 nearer to the L-branch, at least partly eliminating the M 5 discrepant behavior.
To have a deeper insight into the LU-plot we divided the stars plotted in the left panel of Figure 4 into sub-samples, considering three slices in [Na/Fe] ratios: (a) [Na/Fe] dex, (b) [Na/Fe] dex and (c) [Na/Fe] dex. The corresponding distributions in [Al/Fe] are plotted in Figure 5. This Figure clearly shows how the gap in [Al/Fe] between the L and U branches of the LU-plot decreases as the two branches approach the intersection point. To investigate the statistical significance of the bimodality we performed a Kolmogorov-Smirnov test: the probability that distributions (a), where the gap in the LU-plot is most prominent, and (b), where the two branches merge, are extracted from the same parent population is . This probability decreases to 0.003 when comparing distributions (b) and (c). Finally, the probability for distributions (a) and (b) being extracted from the same parent population is only .
A full re-analysis of literature results is beyond the purpose of the present study; anyway, regardless of the precise attribution of clusters to either one of the LU-branches, what seems to be a rather robust conclusion is that the slope in the Na-Al relation is not unique. In M 4 it is shallower than in M 13 and NGC 2808, and in M 5 it be somewhat steeper than in M 4. We also note that different slopes and intercepts were noticed between the Na-O anticorrelations in NGC 288 and NGC 362 by Shetrone & Keane (2000).
If this result will be confirmed by more extended databases and more homogeneous analyses, what are the implications? Is there a change in the rates or efficiencies of the NeNa and MgAl cycles related to some cluster properties? The global metallicity of M 5, M 4 and NGC 2808 is virtually the same, yet the Na-Al correlation is differently sloped. The forging of Na and Al in capture reactions requires different temperatures (Langer & Hoffman, 1995; Langer et al., 1997): do the different slopes observed imply a different temperature profile in the interior of stars that contributed the yields? In turn, this could imply a different range of the involved masses. Although this is only a working hypothesis, a real difference in the slope of the Na-Al correlation, if confirmed, could provide precious constraints to the theoretical modeling of the input physics required to fully explain the nucleosynthesis products seen in cluster stars.
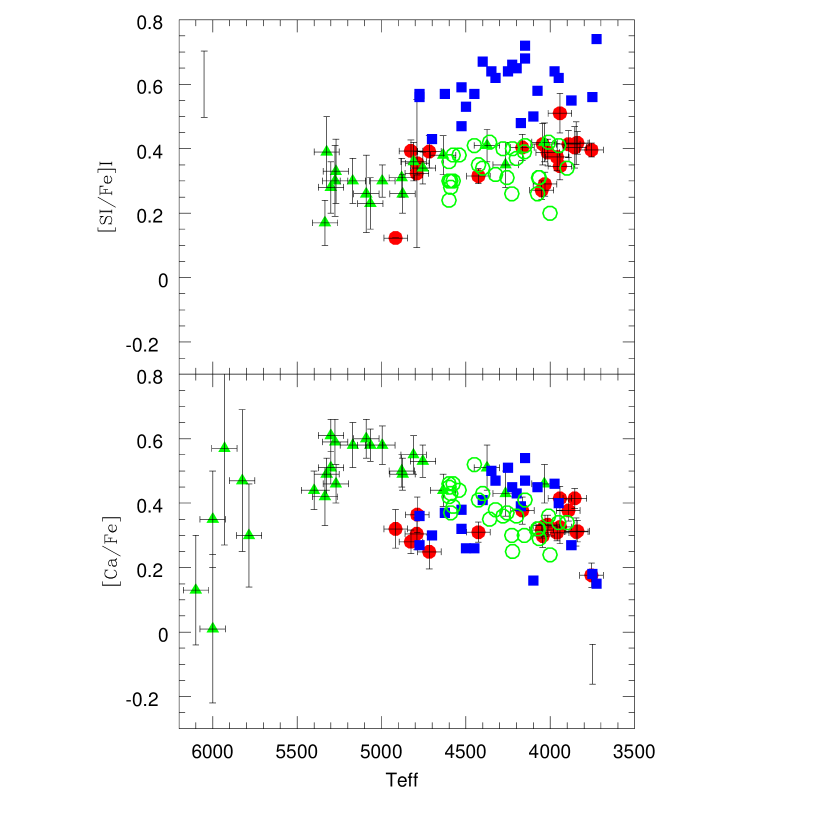
5.2 elements
Abundances of process elements in stars of NGC 2808 are shown in Figure 6 and Figure 7. The element ratios show the normal overabundance above the solar value typical of the halo stars of similar metallicity. When compared to the average overabundances found in field stars of the dissipative component of our Galaxy (Gratton et al., 2003) with [Fe/H] in a dex range centered on the metallicity of NGC 2808, the mean values in Table 5 for Si, Ca, Ti I and Ti II differ by only a few hundredths of dex. The only exception is Mg, for which we found an average difference (NGC 2808 - field) = -0.13 dex: this result agrees with the Mg being somewhat reduced in NGC 2808, due to the depletion resulting in large Al enhancements.
After correcting for the different solar reference abundances, we confirm the finding by Ivans et al. (1999) of an unusual overabundance of [Si/Fe] in M 4, at least with respect to other clusters of very similar metallicity. The other elements seems to be at the same level in M 5, M 4 and NGC 2808; however, Ca abundances in NGC 2808 present a more reduced scatter than in the other two clusters. The average of elements (Mg+Si+Ca+Ti I+Ti II) we found in NGC 2808 is /Fe], ( dex, 19 stars).
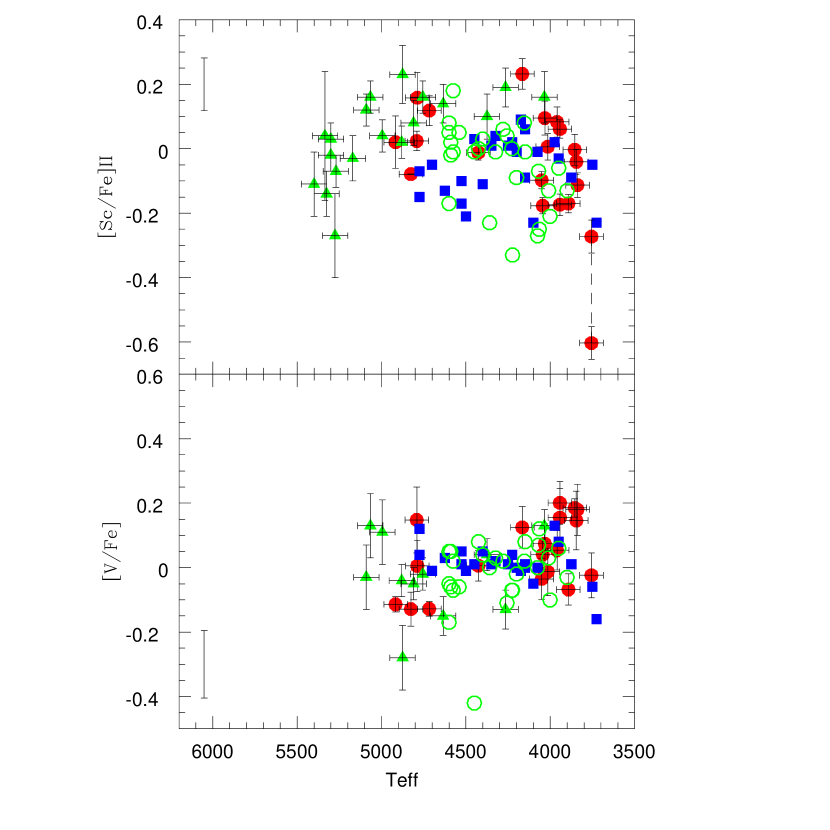
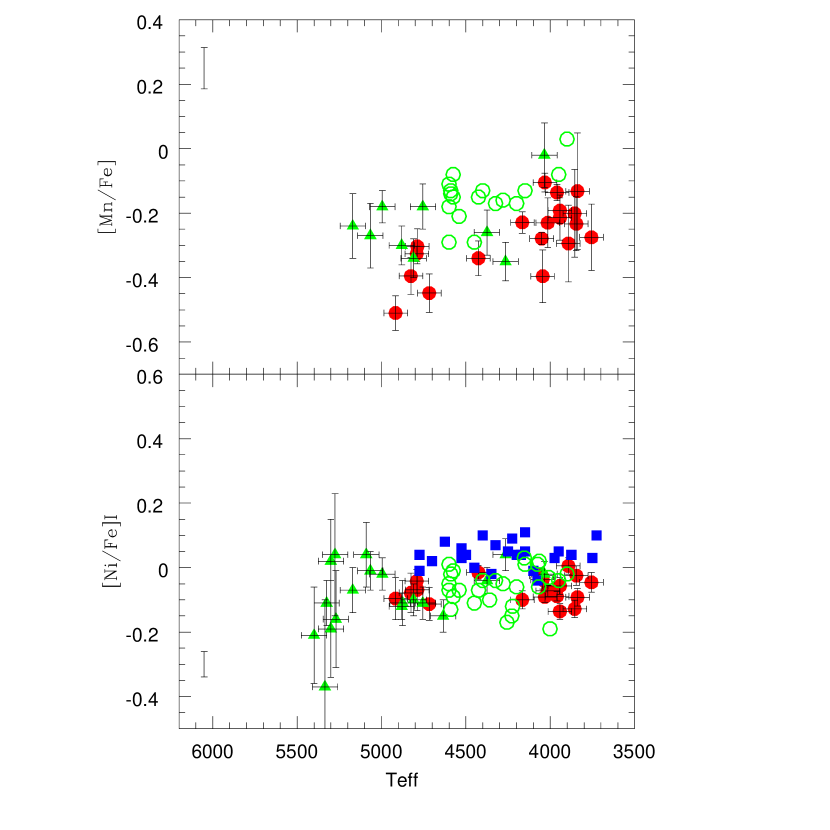
5.3 Fe-group elements
Figure 8, Figure 9 and Figure 10 show the run of elements in the Fe-group for NGC 2808, as compared to the values in M 4 and M 5.
For Sc II the dashed line in Figure 8 connects two values of the [Sc/Fe]II ratio for star 50761 in NGC 2808: the lower value was computed using the [Fe/H]II value derived for this star, and the upper one using the average value, [Fe/H]II, found for NGC 2808. Since this star is the coolest in the sample, its abundance of FeII could be not completely reliable.
We do not consider the scatter in this Figure as very significant, since in addition to the possible offsets due to differences in the model atmosphere grids, temperature and scales and solar analysis there is the further uncertainty due to the corrections for the hyperfine structure, adopted from different sources in different studies.
Apart from Mn, the Fe-group elements have typical average ratios near the solar value.
6 Hunting for correlations between pollution and cluster parameters
The present study allows to add another point to the growing set of clusters with modern abundance analysis based on high resolution spectra of a statistically significant number of stars (N) per cluster. The lack of consistent sets of abundances for elements involved in capture reactions has been one major limit in searching for correlations between the degree of chemical anomalies and other global globular cluster parameters. In turn, these links, if found, can tell us a lot about the first billion years in the history of the cluster itself.
To explore this long standing issue we selected a number of clusters with recent abundance analysis for the key elements O, Na, Mg and Al: to the already mentioned studies for M 4, M 5, M 3 and M 13, we added NGC 6752 (Yong et al., 2003), NGC 6838 (M 71, Ramírez & Cohen 2002) and NGC 7078 (M 15, Sneden et al. 1997). This allows to well sample the whole metallicity range ([Fe/H]) covered by the bulk of galactic globular clusters. Note that this represents our only selection criterion, apart from availability of adequate quality abundance analysis of red giant stars.
An additional problem was to find a good estimator of the amount of chemical anomalies in each cluster. We believe that lack of an objective criterion has somewhat hampered fruitful researches in this direction up to now. Carretta & Gratton (1996) explored possible connections with the HB morphology using [O/Fe], the difference between the maximum and minimum [O/Fe] ratio observed in a given cluster; however, these values might be affected by small numbers statistics, even in clusters with a fair number of sampled stars.
Hence, we propose here that the interquartile range (IQR) of a distribution of abundance ratios is not only a good graphical representation of the spread, but also an optimal tool to define the extension of chemical inhomogeneities within a cluster and to compare it with other clusters. In fact, as mentioned above, box-and-whisker plots are ideal for comparing distributions because the center, spread and overall range are immediately apparent. The IQR can be used as a measure of how much spread-out the values are and it is less subject to sampling fluctuations in highly skewed distributions.
As before, the abundance ratios [O/Fe], [Na/Fe], [Mg/Fe] and [Al/fe] were shifted onto our set of solar reference abundances and we derived values of median and IQR for each element. Inclusion of corrections for NLTE in Na abundances only affects the relative values of medians, not the IQRs.
In Table Abundances in red giant stars of NGC 2808 and correlations between chemical anomalies and global parameters in globular clusters11affiliation: Based on data collected at the European Southern Observatory, Chile, during the FLAMES Science Verification program with the UVES spectrograph at VLT-UT2. we list the derived values for O, Na, Mg and Al, and the ratios [O/Na] and [Mg/Al]: in other words, these are the most objective measure possible of the spread along the Na-O and the Mg-Al anticorrelations in each cluster. The median value and IQR for [Mg/Al] in M 5 are more uncertain, because they are based on only a few stars: Ramírez & Cohen (2003) did not have any Al features in their study and only a few [Mg/Fe] ratios were derived by Ivans et al. (2001).
Armed with this set of diagnostics, we can now check for possible correlations with chemistry, structural parameters and, for the first time to our knowledge, orbital parameters of the clusters.
6.1 Chemistry
A first indication about how much useful the IQRs are is provided by the left panel in Figure 11, where we plot the IQR along the Mg-Al anticorrelation against those along the Na-O anticorrelation. Despite the fact that in each cluster the Na-O relation is much more well defined than the Mg-Al one, these two quantities are quite well correlated: the spread in [Mg/Al] is increasing as the spread in [O/Na] increases.
Although it has long been known (Denisenkov & Denisenkova, 1989; Langer et al., 1993) that these element are linked in the capture chains of reactions, this quite good correlation is a clearcut evidence that NeNa and MgAl cycles involved are likely coming from the very same source. In turn, since the MgAl cycle can work only at temperatures of T or larger (Langer et al., 1993), unreachable in low mass RGB stars, this figure confirms without ambiguity that the bulk of inhomogeneities are established in conditions only possible in the interiors of more massive stars (see Carretta et al. 2005 for a more thorough discussion on different classes of candidate polluters and associated problems). Evolutionary effects, if any, might be present only a secondary noise superimposed to the output from these massive and more short-living stars.
In particular, the only cluster where evolutionary alterations seem to be on average quite important is M 13 (Pilachowski et al., 1996). Indeed, in other clusters an opposite trend can be seen (for instance in M 5, Ivans et al. 2001). In the right panel of Figure 11 we display the median values along the Na-O anticorrelation as a function of metallicity. All objects are clustered around an average value median[O/Na], dex: the only one that stands well out is M 13, off by more than 8 from the others. It appears that M 13 is the real exception among all clusters considered here. Although also in NGC 2808 we found stars with O abundances as low as in the super O-poor stars in M 13, it seems that in the latter the pollution was able to produce a median value of [O/Na] well below those of typical globular clusters: the main difference lies not in the minimum [O/Fe] or maximum [Na/Fe] ratios reachable, but in the spread along the Na-O anticorrelation. While this is hardly a new result, it is now on more quantitative grounds, showing the utility of using the IQR as a new indicator.
At present, however, the question on why M 13 is so unique among its fellows has still to remain unanswered.
Going back to Table Abundances in red giant stars of NGC 2808 and correlations between chemical anomalies and global parameters in globular clusters11affiliation: Based on data collected at the European Southern Observatory, Chile, during the FLAMES Science Verification program with the UVES spectrograph at VLT-UT2. we can see that the IQRs of individual [X/Fe] are also correlated with each other, although the relations involving IQR[Mg/Fe] are somewhat shallower than the others.
Finally, no correlation whatsoever is found between IQR[O/Na],IQR[Mg/Al] and either metallicity or age indicators: it appears that whatever the epoch of formation is, globular clusters formed with the pattern of anticorrelated Na-O and Mg-Al already established early on. This in turn suggests that we are probably dealing with something intimately related to the very same mechanism of cluster formation.
6.2 Pollution and structural parameters
In the previous Section we confirmed and gave new quantitative strength to the concept that the bulk of chemical inhomogeneities is from a (likely very early) pollution. We need to test now whether the amount of this pollution can be related to the structural parameters of clusters.
In Figure 12 and Figure 13 we plot the IQRs of distribution along the Na-O, Mg-Al anticorrelations and those of individual [X/Fe] ratios as a function of the morphological HB type, the absolute visual magnitude and the ellipticity of the clusters, taken from the updated catalog by Harris (1996). To test the statistical significance (or its lack of significance) of these correlations, we computed the Spearman rank correlation coefficient, shown in each panel; if a value is in brackets, it refers to the same correlation, but obtained after exclusion of M 5 (see below).
The spread in the various distributions does not seem to depend on the HB type. Ivans et al. (2001) noted a trend for clusters having a red HB morphology to be segregated from those having a more marked blue HB morphology, as far as the pattern along the Na-O anticorrelation was concerned. However, from the plots in Figure 12 and Figure 13 we cannot confirm any strong dependence of chemical inhomogeneities on HB type. If the chemical composition on the RGB has some influence on the distribution function of stars onto the HB, it has to be modulated by some other factors, since clusters with very different HB morphologies present the same amount of inhomogeneities.
More promising is the run of IQRs as a function of the present-day cluster mass, as represented by the total absolute magnitude: there is a trend for the spread to increase with the cluster mass, particularly marked when Al is involved. In the line of though of a gas reservoir polluted by matter processed by a previous generation of stars, out of which the second stellar generation might form, this correlation may indicate a better ability of more massive clusters to retain the ejecta.
However, things are not so straightforward, since the present day mass of clusters may be different from the one at the epoch of cluster formation (some 10-12 Gyr ago). On the other hand, the influence of disruptive processes following the cluster formation does not seem to be significant. In this respect, the paradigm case is provided by the low mass globular cluster Pal 5, where Smith et al. (2002) found evidence of chemical anomalies similar to those observed in more massive clusters. Yet, Pal 5 has a mass of only about a few 104 M⊙, although its tidal tails suggest that it once was much more massive. It is thus possible that the correlation with the mass of the cluster might indeed be the record of its past capability to retain and transmute a larger amount of polluted matter into stars.
The trend for chemical anomalies to increase with increasing ellipticity of the cluster is also well visible in almost all the element ratios, and quite evident for the spread in the Na-O and Mg-Al anticorrelations, although the uncertain value for IQR[Mg/Al] in M 5 is somewhat masking the latter trend. This is not a completely new result, because it is reminiscent of a positive correlation found to exist (Norris, 1987) between the degree of CN enrichment in RGB stars of a given cluster and the apparent flattening of that system. The so-called CN-signature was among the first ones to be noticed among the outcomes of capture reactions in H-burning: the enhancement of the CN band-strength is explained as the conversion of C into N in the CN-cycle. We must however recall that no dependence on present-day cluster mass was found for the degree of cyanogen enhancement, which involves the lighter species in the capture chains (Smith & Norris, 1981).
At that time, the observed correlation was though to be established via transfer of angular momentum from individual stars to the system: an higher (on average) individual angular momentum could result into higher systematic cluster rotation and consequently into a more marked flattening. The bottom line was that internal stellar rotation could be responsible for both the overall shape of the cluster and its degree of chemical inhomogeneity through internal mixing. At present, the correlations in Figure 12 would be rather hard to explain in the scenario where the bulk of anomalies is likely to be primordial: it is not easy to see why an enhanced degree of pollution should necessarily be associated to a more flattened cluster.
However, we note that in our sample more massive clusters also show a more pronounced ellipticity (Harris, 1996): it is possible that the two correlations with cluster mass and flattening are two expression of the same phenomenon.
While we cannot completely rule out that the observed correlation is simply measuring the modulation of evolutionary effects in the cluster red giants, we cannot draw any firmer conclusion before the same IQRs are available for significantly large samples of unevolved stars, unaffected by any kind of mixing.
Moreover, when looking for possible explanations, we came to notice that the shape of clusters, as represented by their ellipticities, seems to be strongly related to their orbital characteristics. This link appears to have been neglected in previous comprehensive reviews on various properties of Galactic GCs (for instance in Djorgovski & Meylan 1994), likely due to the lack of good sets of absolute proper motions, at that time. We will discuss such newly found correlations in the next Section.
6.3 Chemical anomalies and orbital parameters: a true surprise?
The inference from the previous Section is that the spread of abundances for elements involved in capture reactions is more or less congenital in each globular cluster; the next logical step is thus to look for phenomena that might interfere with or modify the primordial pattern. The first idea is thus to look at the parameters that locate a cluster into the Galaxy.
A growing body of accurate absolute proper motions is presently available for globular clusters, and this allows to derive reliable orbital parameters for these objects. We have taken values from the most recent and extensive work by Dinescu et al. (1999) to explore possible relationships between chemical inhomogeneities and the features of the cluster orbits.
Unfortunately there are no proper motions available yet for NGC 2808, hence this cluster cannot be included in this comparison. For three of the clusters in Table Abundances in red giant stars of NGC 2808 and correlations between chemical anomalies and global parameters in globular clusters11affiliation: Based on data collected at the European Southern Observatory, Chile, during the FLAMES Science Verification program with the UVES spectrograph at VLT-UT2. (M 3, M 5, M 15) Dinescu et al. (1999) note that systematic errors may dominate over their formal error estimates and they caution that the orbits are poorly constrained, although some informations such as the total energy of the cluster and the shape of the orbit are still useful. Among these objects, they note that clusters with large total energy (for instance M 5) may have more uncertain orbital parameters.
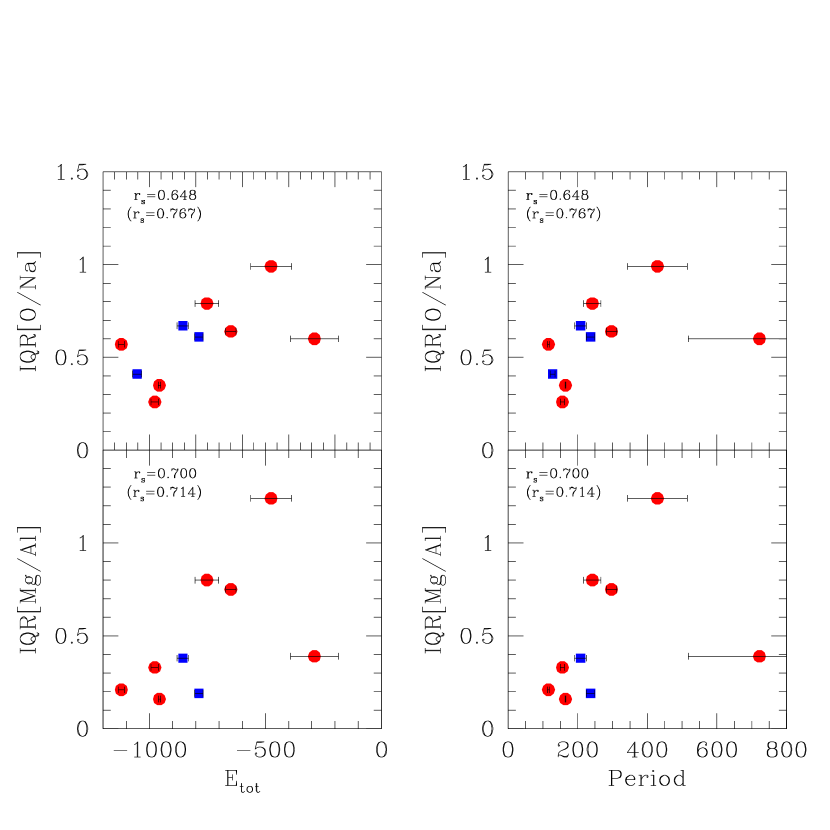
In Figure 14 we show the correlations we found for the clusters in our sample (filled circles) between the amount of chemical anomalies in the Na-O and Mg-Al anticorrelations and orbital parameters. There is a quite good correlation between IQR[O/Na], IQR[Mg/Al] and both the total energy and the period P of revolution around the axis, in particular when disregarding M 5. This is the first time, to our knowledge, that such a link between chemistry of p-capture elements and orbital characteristics is found.
To test the reliability of this finding, we relaxed somewhat our selection criteria, and in order to add more clusters we computed IQR[O/Na] and IQR[Mg/Al] for three other systems having less than stars analyzed per cluster, namely NGC 288, NGC 362 (Shetrone & Keane, 2000) and M 10 (Kraft et al., 1995). The values found for IQR[O/Na] (IQR[Mg/Al]) are +0.61 (0.19), +0.67 (+0.38) and 0.41666For M 10 no Al abundances were derived by Kraft et al. (1995). for NGC 288, NGC 362 and M 10, respectively. When added in Figure 14 (squares), these three additional clusters nicely follow the trend defined by our “main” sample: the largest spread along the Na-O and Mg-Al anticorrelations is for clusters with the largest period P and . In turn, gives a measure of the major semi axis of the orbit, hence Figure 14 is showing that globular clusters with large-sized orbits have an enhanced impact of pollution in element from capture reactions, with respect to the clusters with small-sized orbits.
The correlation is fairly well defined (again, the statistical significance is higher when disregarding M 5): the spread increases by a factor of in [O/Na] and by about one order of magnitude in [Mg/Al] when orbital parameters increase by a factor of 2.
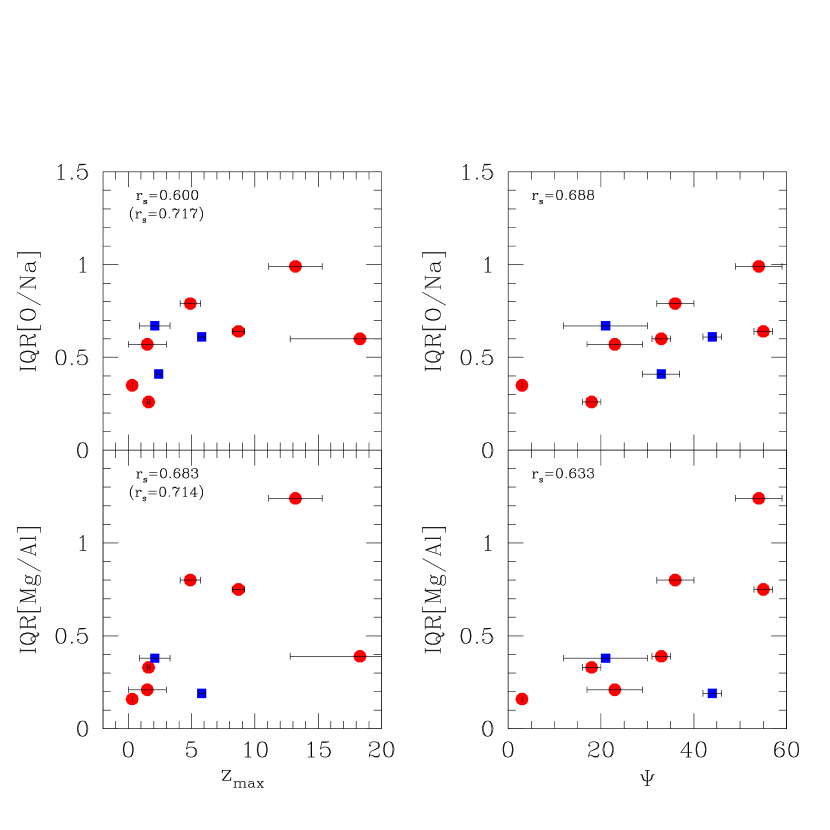
The same chemical indicators are also plotted in Figure 15 as a function of the maximum height above the plane and of the inclination angle with respect to the Galactic plane. Again, apart from the straggler M 5 with its larger uncertainties in derived orbital parameters, all clusters partake of a quite good correlation between increasing IQRs (in both Na-O and Mg-Al) as the parameters and increase.
We note that all the subgroups in the Zinn (1996) classification (disk, RHB, BHB and metal-poor clusters) are represented in our sample of Table Abundances in red giant stars of NGC 2808 and correlations between chemical anomalies and global parameters in globular clusters11affiliation: Based on data collected at the European Southern Observatory, Chile, during the FLAMES Science Verification program with the UVES spectrograph at VLT-UT2. (plus additional clusters): clusters of any metallicity or HB type lie onto these relations, regardless of their membership to the disk or halo kinematical subgroups (for instance, both NGC 6752 and M 10 are metal-poor, yet they show a thick disk-like kinematics, according to Dinescu et al. 1999).
What is the meaning of these up to now unexplored correlations? A direct inference from these diagrams is that the largest chemical inhomogeneities are observed in clusters that spend most of their lifetime farther away from the Galactic plane, thanks to their large-sized orbits (, P) and/or their orbital shapes (, ). Thus, the simplest way to explain this behavior would seem to postulate that clusters less affected by the major disturbance due to interactions with the disk are also less prone to be stripped of a large amount of their gas reservoir.
However, these orbital parameters are determined as averages over a number of cycles on a 10 Gyr integration time (Dinescu et al., 1999). On the other hand, stars presently participating in the Na-O or Mg-Al anticorrelations must have formed rather early and in a short time in the cluster history: the narrowness of the main sequence in the color-magnitude diagrams of GCs and the old ages derived from the turn-off points strongly support that low mass stars in clusters are coeval and old. Hence, the observed relations with the average parameters should be better interpreted as a consequence of the proto-clusters being away from the plane and afterward left relatively undisturbed for long intervals of time. In this respect, Figure 14 and Figure 15 may be considered a snapshot of the initial conditions (in both chemistry and kinematics) at the epoch of the major burst of star formation in globular clusters.
This view is supported also by relations we found between structural and orbital parameters. We plot in Figure 16 the values of cluster ellipticities from Harris (1996) as a function of orbital parameters , P, and inclination angle . In these plots we highlight M 5 as the cluster with larger uncertainties in derived orbital parameters; instead, the three additional clusters are indicated with the same symbols as the clusters in our main sample.
There is a quite good correlation between the flattening of clusters and, again, quantities that, in a sense, are measuring how much time the system may spend far away from the major disturbance of the Galactic disk. A possible interpretation is that near the Galactic plane the effects of relaxation which acts to cancel out the anisotropy of orbits in a given cluster are more important. The net effect would then be that clusters spending most of their lifetime far from the disk would also have a greater chance to maintain a certain degree of flattening. At the same time, these objects on highly energetic orbits (and/or with large inclination about the plane) are also able to better save the memory of the initial conditions in which their presently observed low mass stars formed.
7 Summary and conclusions
We analyzed the chemical abundances of 19 red giant stars in the globular cluster NGC 2808. Abundance ratios for Al, process and Fe-group elements have been derived for stars from the tip of RGB down below the RGB-bump. We found no trend of abundance ratios as a function of effective temperatures.
Elements involved in the NeNa, MgAl cycles of capture reactions in high temperature H-burning show large star-to-star variations in this cluster. There is evidence that synthesis of Na and Al in these reactions was large enough to leave some stars in NGC 2808 heavily polluted by the outcome of this burning. This cluster hosts at least some stars super O-poor as their counterparts in M 13, the paradigm clusters for large chemical inhomogeneities. These stars are also Mg-depleted and Na,Al-enhanced, just the kind of pattern expected.
We found that the correlation of Na and Al abundances seems to be different in slope among clusters of similar metallicity such as NGC 2808, M 4 and M 5.
We defined the interquartile range of the [X/Fe] distribution as a good quantitative measure of the degree of inhomogeneities in a cluster. Using a set of clusters with abundance analysis from high resolution spectroscopy in a fairly large number of star per cluster, we explored possible relations with global cluster parameters. None is found with cluster metallicity, age or HB morphological type.
Rather good correlations are found with both the present day mass of clusters and with the cluster flattening as measured by ellipticity. We note that these two quantities are correlated with each other in our cluster sample.
The most striking relationships are found, for the first time to our knowledge, between the amount of spread along the Na-O and Mg-Al anticorrelations and orbital parameters of the clusters: the larger the orbit sizes and revolution periods, the larger the amount of inhomogeneities. Larger spreads in [O/Na] and [Mg/Al] distributions are clearly found also for clusters with large maximum heights above the Galactic plane and/or with larger inclination angles of the orbit with respect to the plane.
We put forward the working hypothesis that these correlations are a reflex of the initial conditions at the time the presently observed cluster stars formed out of the proto cluster gas, likely polluted by the ejecta of a prior generation of more massive stars. In GCs later spending most of their life far away from the major disturbance of close interactions with the Galactic disk there is a greater chance that most of the gas reservoir was retained to form stars showing large signature of pollution. This view is also well supported by the observed correlations found between cluster ellipticity and orbital parameters: we regard these tight relations as evidence of a reduced action of relaxation processes in erasing the anisotropy of stellar orbits in clusters standing far from the disk for large periods of their lifetime.
The emerging scenario is that a complex interaction of initial conditions, dynamical and chemical evolution might be required to explain all the features and relations found for the global parameters in globular clusters.
References
- Alonso et al. (1999, eqs. 7 and 17, with the erratum of 2001) Alonso, A., Arribas, S. & Martinez-Roger, C. 1999, A&AS, 140, 261
- Barklem et al. (2000) Barklem, P.S., Piskunov, N., O’Mara, B.J. 2000, A&AS, 142, 467
- Bedin et al. (2000) Bedin, L.R., Piotto, G., Zoccali, M., Stetson, P.B., Saviane, I., Cassisi, S., & Bono, G. 2000, A&A, 363, 159
- Bragaglia et al. (2001) Bragaglia, A., et al. 2001, AJ, 121, 327
- Cacciari et al. (2004) Cacciari, C., Bragaglia, A., Rossetti, E., Fusi Pecci, F., Mulas, G., Carretta, E., Gratton, R.G., Momany Y. & Pasquini, L. 2004, A&A, 413, 343
- Cardelli et al. (1989) Cardelli, J.A., Clayton, G.C., & Mathis, J.S. 1989, ApJ, 345, 245
- Carretta et al. (2004a) Carretta, E., Bragaglia, A. & Cacciari, C. 2004, ApJ, 610, L25
- Carretta et al. (2003) Carretta, E., Bragaglia, A., Cacciari, C. & Rossetti, E. 2003, A&A, 410, 143
- Carretta & Gratton (1996) Carretta, E., Gratton, R.G. 1996, in “Formation of the Galactic Halo…Inside and Out”, eds. H. Morrison and A. Sarajedini, ASP Conf.Ser. 92, 363
- Carretta & Gratton (1997) Carretta, E., Gratton, R.G. 1997, A&AS, 121, 95
- Carretta et al. (2004b) Carretta, E., Gratton, R.G., Bragaglia, A. , Bonifacio, P. & Pasquini, L. 2004, A&A, 416, 925
- Carretta et al. (2002) Carretta, E., Gratton, R.G., Cohen, J.G., Beers, T.C. & Christlieb, N. 2002, AJ, 124, 481
- Carretta et al. (2005) Carretta, E., Gratton, R.G., Lucatello, S., Bragaglia, A., Bonifacio, P. 2005, A&A, 433, 597
- Cayrel (1986) Cayrel, R. 1986, A&A, 168, 81
- Cohen & Melendez (2005) Cohen, J.G. & Meléndez, J. 2005, AJ, 129, 303
- Cutri et al. (2003) Cutri, R.M., et al. 2003, VizieR On-line Data Catalog: II/246, Originally published in: University of Massachusetts and Infrared Processing and Analysis Center, (IPAC/California Institute of Technology)
- D’Antona & Caloi (2004) D’Antona, F. & Caloi, V. 2004, ApJ, 611, 871
- Denisenkov & Denisenkova (1989) Denisenkov, P.A., Denisenkova, S.N. 1989, A.Tsir., 1538, 11
- Dinescu et al. (1999) Dinescu, D.I., Girard, T.M., van Altena, W.F. 1999, AJ, 117, 1792
- Djorgovski & Meylan (1994) Djorgovski, S. & Meylan, G. 1994, AJ, 108, 1292
- Gratton (1988) Gratton, R.G. 1988, Rome Obs. Preprint, 29
- Gratton et al. (2003) Gratton, R.G., Carretta, E., Claudi, R., Lucatello, S. & Barbieri, M. 2003, A&A, 404, 187
- Gratton et al. (1999) Gratton, R.G., Carretta, E., Eriksson, K., & Gustafsson, B. 1999, A&A 350, 955
- Gratton, Sneden & Carretta (2004) Gratton R.G., Sneden, C. & Carretta, E. 2004, ARA&A,
- Gratton et al. (2001) Gratton, R.G. et al. 2001, A&A, 369, 87
- Harris (1996) Harris, W. E. 1996, AJ, 112, 1487
- Ivans et al. (2001) Ivans, I.I., Kraft, R.P., Sneden, C., Smith, G.H., Rich, M.R., Shetrone, M. 2001, AJ, 122, 1438
- Ivans et al. (1999) Ivans, I.I., Sneden, C., Kraft, R.P., Suntzeff, N.B., Smith, V.V., Langer, G.E., Fulbright, J.P. 1999, AJ, 118, 1273
- Kraft et al. (1995) Kraft, R.P., Sneden, C., Langer, G.E., Shetrone, M.D., Bolte, M. 1995, AJ, 105, 2586
- Kurucz (1993) Kurucz, R.L. 1993, ATLAS9 Stellar Atmosphere Programs and 2 km s-1 Grid, CD-ROM 13, (Cambridge, MA:SAO)
- Langer & Hoffman (1995) Langer, G.E., & Hoffman, R. 1995, PASP, 107, 1177
- Langer et al. (1993) Langer, G.E., Hoffman, R., & Sneden, C. 1993, PASP, 105, 301
- Langer et al. (1997) Langer, G.E., Hoffman, R., & Zaidins, C.S. 1997, PASP, 109, 244
- Magain (1984) Magain, P. 1984, A&A, 134, 189
- Mulas et al. (2002) Mulas, G., Modigliani, A., Porceddu, I. & Damiani, F. 2002, Automatic data reduction in support of the FLAMES-UVES VLT facility, 2002, Proc. of SPIE, 4844, 310
- Norris (1987) Norris, J. 1987, ApJ, 313, L65
- Parmentier (2004) Parmentier, G. 2004, MNRAS, 351, 585
- Pilachowski et al. (1996) Pilachowski, C.A., Sneden, C., Kraft, R.P., Langer, G.E. 1996, AJ, 112, 545
- Ramírez & Cohen (2002) Ramírez S.V. & Cohen J.G. 2002, AJ, 123, 3277
- Ramírez & Cohen (2003) Ramírez S.V. & Cohen J.G. 2003, AJ, 125, 224
- Shetrone & Keane (2000) Shetrone, M.D., Keane, M.J. 2000, AJ, 119, 340
- Smith & Norris (1981) Smith, G.H. & Norris, J. 1981, ApJ, 254, 149
- Smith et al. (2002) Smith, G.H, Sneden, C., Kraft, R.P. 2002, AJ, 123, 1502
- Sneden et al. (2004) Sneden, C., Kraft, R.P., Guhathakurta, P., Peterson, R.C., Fulbright, J.P. 2004, AJ, 127, 2162
- Sneden et al. (1997) Sneden, C., Kraft, R.P., Shetrone, M.D., Smith, G.H., Langer, G.E., Prosser, C.F. 1997, AJ, 114, 1964
- Tukey (1977) Tukey, J. W. 1977, “Box-and-Whisker Plots”, in Explanatory Data Analysis. Reading, MA: Addison-Wesley, pp. 39-43, 1977
- Yong et al. (2003) Yong, D., Grundahl, F., Lambert, D.L., Nissen, P.E., Shetrone, M.D. 2003, A&A, 402, 985
- Zinn (1996) Zinn, R. 1996, in “Formation of the Galactic Halo…Inside and Out”, eds. H. Morrison and A. Sarajedini, ASP Conf.Ser. 92, 211
| Star ID | Teff | n | [Fe/H]I | n | [Fe/H]II | |||||
|---|---|---|---|---|---|---|---|---|---|---|
| K | dex | km s-1 | dex | dex | dex | dex | ||||
| 10201 | 45 | 4717 | 2.02 | 1.20 | 51 | 1.06 | 0.13 | 8 | 1.21 | 0.05 |
| 13983 | 40 | 4826 | 2.17 | 0.60 | 33 | 1.08 | 0.08 | 5 | 1.09 | 0.13 |
| 32685 | 30 | 4788 | 2.03 | 0.83 | 34 | 1.15 | 0.09 | 5 | 1.41 | 0.07 |
| 34013aaFor this star measurements of s were scarcely reliable, hence this star is disregarded from further discussion and is reported here only for the sake of completeness. | 20 | 5110 | 2.51 | 0.80 | 29 | 0.89 | 0.21 | 3 | 1.84 | 0.12 |
| 37872 | 120 | 4015 | 0.71 | 1.68 | 96 | 1.10 | 0.11 | 14 | 1.06 | 0.08 |
| 42886 | 30 | 4791 | 2.14 | 0.85 | 47 | 1.16 | 0.14 | 4 | 1.38 | 0.10 |
| 43217 | 30 | 4916 | 2.41 | 0.80 | 33 | 1.00 | 0.12 | 7 | 1.17 | 0.13 |
| 46099 | 80 | 4032 | 0.76 | 1.72 | 60 | 1.18 | 0.12 | 10 | 1.19 | 0.12 |
| 46422 | 100 | 3943 | 0.52 | 1.85 | 95 | 1.17 | 0.12 | 14 | 1.08 | 0.09 |
| 46580 | 65 | 4051 | 0.74 | 1.68 | 89 | 1.15 | 0.11 | 15 | 1.03 | 0.13 |
| 47606 | 110 | 3839 | 0.44 | 1.66 | 85 | 1.12 | 0.14 | 14 | 1.14 | 0.16 |
| 48609 | 110 | 3846 | 0.44 | 1.78 | 58 | 1.22 | 0.12 | 8 | 1.11 | 0.13 |
| 48889 | 85 | 3943 | 0.52 | 1.80 | 99 | 1.15 | 0.15 | 13 | 1.22 | 0.12 |
| 50119 | 70 | 4166 | 0.93 | 1.73 | 119 | 1.08 | 0.15 | 18 | 1.21 | 0.13 |
| 50761 | 120 | 3756 | 0.31 | 1.75 | 81 | 1.22 | 0.12 | 10 | 0.81 | 0.07 |
| 51454 | 120 | 3893 | 0.51 | 1.65 | 90 | 1.26 | 0.11 | 14 | 1.11 | 0.13 |
| 51499 | 85 | 3960 | 0.57 | 1.70 | 104 | 1.25 | 0.10 | 18 | 1.24 | 0.12 |
| 51983 | 95 | 3855 | 0.47 | 1.77 | 71 | 1.15 | 0.11 | 13 | 1.16 | 0.12 |
| 53390 | 60 | 4426 | 1.43 | 1.30 | 106 | 1.12 | 0.10 | 19 | 1.14 | 0.13 |
| 56032 | 70 | 4045 | 0.87 | 1.70 | 103 | 1.10 | 0.10 | 17 | 0.99 | 0.12 |
| Star | n | [Al/Fe] | n | [Mg/Fe] | n | [Si/Fe] | n | [Ca/Fe] | n | [Ti/Fe]I | n | [Ti/Fe]II | ||||||
|---|---|---|---|---|---|---|---|---|---|---|---|---|---|---|---|---|---|---|
| 10201 | 2 | +0.92 | 0.12 | 3 | +0.29 | 0.19 | 5 | +0.39 | 0.11 | 15 | +0.25 | 0.20 | 16 | +0.20 | 0.21 | 2 | +0.26 | 0.01 |
| 13983 | 2 | +0.94 | 0.02 | 2 | +0.24 | 0.09 | 5 | +0.39 | 0.08 | 16 | +0.28 | 0.15 | 8 | +0.32 | 0.19 | 0 | ||
| 32685 | 2 | +0.86 | 0.09 | 1 | +0.47 | 5 | +0.36 | 0.08 | 9 | +0.36 | 0.17 | 9 | +0.31 | 0.20 | 3 | +0.19 | 0.13 | |
| 37872 | 2 | +1.03 | 0.04 | 4 | +0.21 | 0.26 | 7 | +0.39 | 0.11 | 17 | +0.33 | 0.12 | 12 | +0.24 | 0.08 | 7 | +0.12 | 0.16 |
| 42886 | 2 | 0.07 | 0.09 | 2 | +0.40 | 0.24 | 2 | +0.32 | 0.33 | 17 | +0.31 | 0.20 | 11 | +0.39 | 0.23 | 3 | +0.23 | 0.19 |
| 43217 | 0 | 2 | +0.44 | 0.15 | 1 | +0.12 | 15 | +0.32 | 0.22 | 10 | +0.35 | 0.21 | 2 | +0.30 | 0.11 | |||
| 46099 | 2 | +0.16 | 0.08 | 4 | +0.40 | 0.28 | 5 | +0.29 | 0.08 | 12 | +0.33 | 0.12 | 18 | +0.36 | 0.16 | 7 | +0.23 | 0.17 |
| 46422 | 2 | +0.19 | 0.00 | 4 | +0.48 | 0.09 | 6 | +0.35 | 0.10 | 14 | +0.33 | 0.19 | 17 | +0.30 | 0.18 | 6 | +0.18 | 0.08 |
| 46580 | 2 | +0.32 | 0.01 | 3 | +0.33 | 0.12 | 6 | +0.27 | 0.07 | 16 | +0.32 | 0.10 | 20 | +0.36 | 0.18 | 5 | +0.15 | 0.13 |
| 47606 | 2 | 0.01 | 0.08 | 3 | +0.19 | 0.05 | 7 | +0.42 | 0.09 | 13 | +0.31 | 0.12 | 16 | +0.28 | 0.13 | 5 | +0.14 | 0.09 |
| 48609 | 2 | +0.14 | 0.06 | 4 | +0.51 | 0.26 | 7 | +0.42 | 0.18 | 11 | +0.31 | 0.15 | 14 | +0.36 | 0.11 | 6 | +0.27 | 0.07 |
| 48889 | 2 | +1.02 | 0.19 | 3 | +0.32 | 0.19 | 6 | +0.51 | 0.15 | 18 | +0.42 | 0.16 | 18 | +0.41 | 0.14 | 5 | +0.25 | 0.15 |
| 50119 | 2 | +1.42 | 0.06 | 3 | 0.23 | 0.12 | 8 | +0.40 | 0.12 | 17 | +0.38 | 0.17 | 25 | +0.20 | 0.14 | 5 | +0.26 | 0.19 |
| 50761 | 2 | +0.29 | 0.04 | 4 | +0.33 | 0.22 | 7 | +0.40 | 0.06 | 14 | +0.18 | 0.14 | 16 | +0.28 | 0.23 | 5 | +0.19 | 0.19 |
| 51454 | 2 | +0.11 | 0.05 | 3 | +0.40 | 0.07 | 7 | +0.41 | 0.11 | 18 | +0.38 | 0.14 | 16 | +0.37 | 0.14 | 7 | +0.20 | 0.22 |
| 51499 | 2 | +0.05 | 0.05 | 3 | +0.46 | 0.20 | 6 | +0.37 | 0.11 | 15 | +0.31 | 0.10 | 18 | +0.36 | 0.19 | 4 | +0.27 | 0.07 |
| 51983 | 2 | +0.91 | 0.19 | 4 | +0.25 | 0.27 | 8 | +0.40 | 0.18 | 16 | +0.42 | 0.13 | 18 | +0.37 | 0.18 | 4 | +0.12 | 0.06 |
| 53390 | 2 | 0.25 | 0.12 | 4 | +0.33 | 0.07 | 8 | +0.32 | 0.07 | 17 | +0.31 | 0.13 | 24 | +0.24 | 0.17 | 8 | +0.17 | 0.19 |
| 56032 | 2 | +0.07 | 0.05 | 4 | +0.39 | 0.07 | 8 | +0.41 | 0.18 | 15 | +0.30 | 0.14 | 17 | +0.19 | 0.08 | 6 | +0.15 | 0.16 |
| Star | n | [Sc/Fe]II | n | [V/Fe] | n | [Cr/Fe]I | n | [Cr/Fe]II | n | [Mn/Fe] | n | [Ni/Fe] | ||||||
|---|---|---|---|---|---|---|---|---|---|---|---|---|---|---|---|---|---|---|
| 10201 | 6 | +0.12 | 0.11 | 6 | 0.13 | 0.06 | 8 | 0.11 | 0.23 | 4 | +0.10 | 0.19 | 5 | 0.45 | 0.13 | 13 | 0.11 | 0.18 |
| 13983 | 1 | 0.08 | 4 | 0.13 | 0.11 | 4 | +0.05 | 0.09 | 2 | 0.00 | 0.21 | 6 | 0.40 | 0.14 | 5 | 0.08 | 0.14 | |
| 32685 | 5 | +0.16 | 0.18 | 3 | +0.01 | 0.14 | 8 | +0.08 | 0.17 | 0 | 5 | 0.30 | 0.12 | 11 | 0.07 | 0.21 | ||
| 37872 | 6 | +0.01 | 0.10 | 5 | 0.01 | 0.17 | 13 | +0.04 | 0.18 | 5 | +0.14 | 0.18 | 4 | 0.23 | 0.15 | 31 | 0.07 | 0.10 |
| 42886 | 5 | +0.02 | 0.07 | 4 | +0.15 | 0.21 | 4 | +0.12 | 0.20 | 2 | +0.15 | 0.06 | 6 | 0.33 | 0.06 | 8 | 0.04 | 0.11 |
| 43217 | 5 | +0.02 | 0.22 | 5 | 0.11 | 0.05 | 5 | +0.12 | 0.11 | 1 | +0.19 | 6 | 0.51 | 0.13 | 7 | 0.10 | 0.17 | |
| 46099 | 7 | +0.10 | 0.14 | 5 | +0.07 | 0.14 | 10 | 0.02 | 0.17 | 2 | +0.03 | 0.29 | 4 | 0.11 | 0.06 | 25 | 0.09 | 0.08 |
| 46422 | 7 | 0.17 | 0.09 | 6 | +0.16 | 0.22 | 12 | +0.06 | 0.15 | 4 | +0.06 | 0.11 | 3 | 0.21 | 0.12 | 32 | 0.06 | 0.14 |
| 46580 | 7 | 0.10 | 0.07 | 7 | 0.04 | 0.17 | 14 | +0.08 | 0.18 | 4 | +0.09 | 0.08 | 4 | 0.28 | 0.04 | 32 | 0.03 | 0.12 |
| 47606 | 7 | 0.11 | 0.10 | 6 | +0.18 | 0.19 | 10 | +0.10 | 0.14 | 2 | +0.19 | 0.21 | 3 | 0.13 | 0.31 | 25 | 0.09 | 0.14 |
| 48609 | 7 | 0.04 | 0.10 | 4 | +0.15 | 0.18 | 9 | 0.02 | 0.18 | 2 | 0.01 | 0.08 | 3 | 0.23 | 0.15 | 25 | 0.03 | 0.15 |
| 48889 | 7 | +0.06 | 0.08 | 5 | +0.20 | 0.15 | 10 | +0.05 | 0.09 | 3 | +0.13 | 0.22 | 3 | 0.19 | 0.07 | 32 | 0.14 | 0.14 |
| 50119 | 6 | +0.23 | 0.12 | 7 | +0.13 | 0.17 | 12 | 0.05 | 0.07 | 3 | +0.21 | 0.16 | 4 | 0.23 | 0.07 | 35 | 0.10 | 0.16 |
| 50761 | 6 | 0.60 | 0.13 | 5 | 0.02 | 0.16 | 8 | 0.00 | 0.17 | 2 | +0.04 | 0.19 | 4 | 0.28 | 0.21 | 30 | 0.05 | 0.17 |
| 51454 | 6 | 0.17 | 0.07 | 4 | 0.07 | 0.10 | 8 | +0.13 | 0.08 | 3 | +0.17 | 0.22 | 4 | 0.29 | 0.24 | 38 | +0.01 | 0.16 |
| 51499 | 7 | +0.08 | 0.12 | 7 | +0.05 | 0.16 | 14 | 0.03 | 0.09 | 5 | +0.19 | 0.21 | 3 | 0.14 | 0.04 | 30 | 0.09 | 0.08 |
| 51983 | 7 | 0.00 | 0.13 | 6 | +0.19 | 0.07 | 13 | 0.06 | 0.10 | 2 | 0.03 | 0.03 | 3 | 0.20 | 0.24 | 24 | 0.13 | 0.13 |
| 53390 | 6 | 0.01 | 0.06 | 10 | +0.01 | 0.15 | 15 | +0.03 | 0.15 | 5 | +0.02 | 0.14 | 4 | 0.34 | 0.11 | 33 | 0.02 | 0.12 |
| 56032 | 7 | 0.18 | 0.07 | 7 | +0.04 | 0.13 | 17 | 0.05 | 0.17 | 3 | 0.10 | 0.18 | 4 | 0.40 | 0.16 | 36 | 0.04 | 0.17 |
| Ratio | [A/H] | EW | tot. | ||||
| (+70 K) | (+0.1 dex) | (+0.1 dex) | (+0.1 km/s) | (dex) | |||
| Star 48889: , Teff//=3943/0.52/1.80 | |||||||
| Mg/FeI | +0.001 | 0.017 | 0.005 | +0.008 | 4 | +0.058 | 0.061 |
| Al/FeI | +0.044 | 0.012 | 0.019 | +0.009 | 2 | +0.082 | 0.096 |
| Si/FeI | 0.081 | +0.012 | +0.005 | +0.024 | 7 | +0.044 | 0.096 |
| Ca/FeI | +0.069 | 0.021 | 0.022 | 0.031 | 15 | +0.030 | 0.087 |
| Sc/FeII | +0.085 | 0.013 | 0.005 | 0.022 | 7 | +0.044 | 0.099 |
| Ti/FeI | +0.116 | 0.014 | 0.022 | 0.022 | 18 | +0.027 | 0.123 |
| Ti/FeII | +0.064 | 0.019 | 0.010 | 0.019 | 6 | +0.047 | 0.085 |
| V/FeI | +0.127 | 0.008 | 0.017 | 0.044 | 6 | +0.047 | 0.143 |
| Cr/FeI | +0.078 | 0.020 | 0.020 | +0.000 | 12 | +0.033 | 0.090 |
| Cr/FeII | +0.023 | 0.016 | 0.017 | +0.009 | 3 | +0.067 | 0.075 |
| Mn/FeI | +0.036 | 0.006 | 0.010 | 0.014 | 4 | +0.058 | 0.071 |
| Fe/HI | +0.025 | +0.010 | +0.012 | 0.041 | 90 | +0.012 | 0.052 |
| Fe/HII | 0.104 | +0.049 | +0.033 | 0.022 | 14 | +0.031 | 0.125 |
| Ni/FeI | 0.021 | +0.008 | +0.004 | +0.008 | 31 | +0.021 | 0.032 |
| Star 43217: , Teff//=4916/2.41/0.80 | |||||||
| Mg/FeI | 0.013 | 0.026 | +0.011 | +0.027 | 3 | +0.067 | 0.079 |
| Al/FeI | 0.039 | +0.006 | 0.001 | +0.031 | 2 | +0.082 | 0.096 |
| Si/FeI | 0.075 | +0.020 | +0.008 | +0.035 | 3 | +0.067 | 0.109 |
| Ca/FeI | 0.014 | 0.010 | 0.003 | +0.007 | 14 | +0.031 | 0.036 |
| Sc/FeII | +0.027 | +0.000 | +0.000 | +0.009 | 4 | +0.058 | 0.064 |
| Ti/FeI | +0.018 | +0.003 | 0.007 | +0.008 | 10 | +0.037 | 0.042 |
| Ti/FeII | +0.025 | 0.002 | 0.004 | 0.035 | 2 | +0.082 | 0.093 |
| V/FeI | +0.015 | +0.005 | 0.002 | +0.030 | 4 | +0.058 | 0.067 |
| Cr/FeI | +0.019 | 0.002 | 0.006 | 0.010 | 6 | +0.047 | 0.052 |
| Cr/FeII | 0.001 | +0.000 | 0.007 | +0.011 | 2 | +0.082 | 0.083 |
| Mn/FeI | +0.003 | +0.008 | 0.002 | +0.023 | 5 | +0.052 | 0.057 |
| Fe/HI | +0.090 | 0.011 | 0.005 | 0.039 | 38 | +0.019 | 0.100 |
| Fe/HII | 0.027 | +0.040 | +0.029 | 0.030 | 5 | +0.052 | 0.082 |
| Ni/FeI | 0.011 | +0.013 | +0.003 | +0.011 | 8 | +0.041 | 0.046 |
| Ratio | Nstar | Mean | ||
|---|---|---|---|---|
| O/FeaaValues used in this average are from Carretta et al. (2004a); Na abundances do include corrections for departures from LTE according to Gratton et al. (1999) | 19 | +0.01 | 0.37 | 0.14 |
| Na/FeaaValues used in this average are from Carretta et al. (2004a); Na abundances do include corrections for departures from LTE according to Gratton et al. (1999) | 19 | +0.22 | 0.25 | 0.09 |
| Mg/Fe | 19 | +0.32 | 0.16 | 0.07 |
| Al/Fe | 18 | +0.45 | 0.49 | 0.10 |
| Si/Fe | 19 | +0.37 | 0.08 | 0.10 |
| Ca/Fe | 19 | +0.32 | 0.06 | 0.06 |
| Sc/FeII | 19 | 0.04 | 0.18 | 0.08 |
| Ti/FeI | 19 | +0.31 | 0.07 | 0.08 |
| Ti/FeII | 18 | +0.20 | 0.06 | 0.09 |
| V/Fe | 19 | +0.04 | 0.11 | 0.11 |
| Cr/FeI | 19 | +0.03 | 0.07 | 0.07 |
| Cr/FeII | 18 | +0.09 | 0.09 | 0.08 |
| Mn/Fe | 19 | 0.27 | 0.10 | 0.06 |
| Fe/HI | 19 | 1.14 | 0.07 | 0.08 |
| Fe/HII | 19 | 1.14 | 0.13 | 0.10 |
| Ni/Fe | 19 | 0.07 | 0.04 | 0.04 |
| Cluster | [Fe/H]aaMetallicity is either from Carretta et al. (2004a) or from Carretta & Gratton (1997). | median | IQR | median | IQR | median | IQR | median | IQR | median | IQR | median | IQR | ref |
|---|---|---|---|---|---|---|---|---|---|---|---|---|---|---|
| [O/Fe] | [O/Fe] | [Na/Fe] | [Na/Fe] | [Mg/Fe] | [Mg/Fe] | [Al/Fe] | [Al/Fe] | [O/Na] | [O/Na] | [Mg/Al] | [Mg/Al] | |||
| NGC 2808 | 1.14 | 0.13 | 0.49 | 0.17 | 0.37 | 0.33 | 0.19 | 0.29 | 0.85 | 0.08 | 0.83 | +0.20 | 0.98 | 1 |
| NGC 5272 M3 | 1.34 | 0.20 | 0.26 | 0.28 | 0.34 | 0.39 | 0.22 | 0.86 | 0.64 | 0.08 | 0.64 | 0.49 | 0.75 | 2 |
| NGC 5904 M5 | 1.11 | 0.13 | 0.36 | 0.29 | 0.36 | 0.53 | 0.10 | 0.72 | 0.29 | 0.18 | 0.60 | 0.40bbThese values are uncertain due to the small number of stars with both Al and Mg abundances available for M 5. | 0.39bbThese values are uncertain due to the small number of stars with both Al and Mg abundances available for M 5. | 3 |
| NGC 6121 M4 | 1.19 | 0.38 | 0.20 | 0.40 | 0.41 | 0.62 | 0.11 | 0.89 | 0.22 | +0.01 | 0.57 | 0.31 | 0.21 | 4 |
| NGC 6205 M13 | 1.39 | 0.02 | 0.46 | 0.61 | 0.46 | 0.31 | 0.24 | 1.17 | 1.03 | 0.65 | 0.99 | 0.57 | 1.24 | 2 |
| NGC 6752 | 1.42 | 0.25 | 0.16 | 0.44 | 0.18 | 0.67 | 0.03 | 1.04 | 0.28 | 0.17 | 0.26 | 0.36 | 0.33 | 5 |
| NGC 6838 M71 | 0.70 | 0.36 | 0.22 | 0.42 | 0.16 | 0.59 | 0.11 | 0.59 | 0.11 | 0.07 | 0.35 | +0.05 | 0.16 | 6 |
| NGC 7078 M15 | 2.12 | 0.26 | 0.32 | 0.40 | 0.48 | 0.59 | 0.24 | 1.14 | 0.60 | 0.10 | 0.79 | 0.45 | 0.80 | 7 |
References. — (1) this study; (2) Sneden et al. (2004); (3) Ivans et al. (2001); (4) Ivans et al. (1999); (5) Yong et al. (2003): (6) Ramirez & Cohen (2002); (7) Sneden et al. (1997)