Prospects for population synthesis in the H band:
NeMo grids of stellar atmospheres compared to observations
Abstract
Context. For applications in population synthesis, libraries of theoretical stellar spectra are often considered an alternative to template libraries of observed spectra, because they allow a complete sampling of stellar parameters. Most attention in published theoretical spectral libraries has been devoted to the visual wavelength range.
Aims. We present a detailed comparison of theoretical spectra in the range 1.57-1.67m, for spectral types from A to early M and for giants and dwarf stars, with observed stellar spectra at resolutions around 3000, which would be sufficient to disentangle the different groups of late type stars.
Methods. We have selected the NeMo grids of stellar atmospheres to perform such a comparison.
Results. We first demonstrate that after combining atomic and molecular line lists, it is possible to match observed spectral flux distributions with theoretical ones very well for almost the entire parameter range covered by the NeMo grids at moderate resolution in the visual range. In the infrared range, although the overall shape of the observed flux distributions is still matched reasonably well, the individual spectral features are reproduced by the theoretical spectra only for stars earlier than mid F type. For later spectral types the differences increase and theoretical spectra of K type stars have systematically weaker line features than those found in observations. These discrepancies are traced back to stem primarily from incomplete data on neutral atomic lines, although some of them are also related to molecules.
Conclusions. Libraries of theoretical spectra for A to early M type stars can be successfully used in the visual regions for population synthesis but their application in the infrared is restricted to early and intermediate type stars. Improving atomic data in the near infrared is a key element in making the construction of reliable libraries of stellar spectra in the infrared feasible.
Key Words.:
stars: atmospheres - infrared: stars1 Introduction
Due to the rapidly increasing spectral resolution of galaxy surveys (e.g. Sloan Digital Sky Survey), modelling any galaxy with spectral synthesis technique requires a high spectral resolution stellar library.
Over the last years much progress has been made in synthesis models (e.g. Pelat Pel97 (1997); Leitherer et al. Lei99 (1999); Moultaka & Pelat Mou00 (2000); Bruzual & Charlot Bru03 (2003); Le Borgne et al. LeB04 (2004); Cid Fernandes et al. Cid05 (2005)). Moderate to high spectral resolution observations of stars in order to construct reliable template libraries have also been performed in the visible domain (e.g. STELIB of Le Borgne et al. LeB03 (2003); UVES of Bagnulo et al. Bag03 (2003); CoudeFed of Valdes et al. Val04 (2004)) and in the IR (e.g. Dallier et al. Dal96 (1996); Meyer et al. Mey98 (1998); Ivanov et al. Iva04 (2004)). However, the major limitation of all these libraries is the sampling of stellar parameters such as metallicity.
One way to avoid such a difficulty is to build libraries of theoretical stellar spectra in order to choose the desired physical parameters. In this sense, some extensive libraries of synthetic spectra have appeared recently for the visible range.
Murphy & Meiksin (Mur04 (2004)), based on Kurucz’s ATLAS9 model atmospheres (Kurucz 1993a ), have built a high resolution () stellar library over an extended visible range (3000 to 10000 Å). The convection zone is treated using the Mixing Length Theory (MLT) with the overshooting treatment of Kurucz (cf. Castelli et al. Cas97 (1997)). This library provides spectra for 54 values of effective temperature from 5250 to 50000 K, 11 values of log surface gravity from 0.0 to 5.0 and 19 metallicities from -5.0 to 1.0. They compared their synthetic library with observed spectra (STELIB library of Le Borgne et al. LeB03 (2003)) for the colours and the Lick indices and found in general a good agreement.
Still based on Kurucz’s models, but with enhanced molecular line lists and the overshooting option switched off, Munari et al. (Mun05 (2005)) also present a library of synthetic spectra, for a similar wavelength range (2500 to 10500 Å). They use a new grid of ATLAS9 model atmospheres (Castelli & Kurucz Cas03 (2003)). The effective temperature of these spectra is contained between 3500 and 47500 K, the log surface gravity between 0.0 and 5.0 and the metallicity between -2.5 and 0.5. These spectra are computed at a resolving power of and then Gaussian convolved to lower resolution ( 20 000). In contrast with Murphy & Meiksin (Mur04 (2004)), the predicted energy level lines are not included into the line lists used to build this library, as Munari et al. (Mun05 (2005)) favour the spectroscopic use rather than the photometric use of the synthetic spectra. The addition of these “predicted lines” permits to have a better statistical flux distribution, but individual wavelengths can be wrong by up to 5%.
We would like to point out here that usually only the lower lying energy levels of atoms have been determined in the laboratory, particularly for complex spectra such as those from neutral or singly ionized iron. If only those transitions were taken into account, the atmospheric line blanketing computed from such data would be severly incomplete. A lot of weak lines, possibly unidentified even in the solar spectrum but nevertheless present, would be missed. This would lead to an overestimation of the ultraviolet flux which in turn would be “compensated” by a lack of flux in the visual (Kurucz Kur92 (1992)). To avoid this deficiency and to improve the temperature structure of the model atmospheres, the spectrophotometric flux distribution, and the photometric colors requires to account for lines for which one or both energy levels have to be predicted from quantum mechanical calculations. This has been one of the main goals of the ATLAS9 models of Kurucz (Kur92 (1992); 1993a ). As the theoretical predictions are accurate to only a few percent, individual wavelengths can be wrong by up to a few 100 Å in the visual. Also the line oscillator strengths are sufficiently accurate merely in a statistical sense. This still permits to improve the total flux within a wavelength band of a few dozen Å in the visual, but individual features do appear in the wrong part of the spectrum. For spectroscopy at higher resolutions, particularly if the spectrum is rectified or when working within small wavelength bands, adding the predicted energy level lines “pollutes” the theoretical spectrum with extra “noise”. This has to be avoided in libraries devoted to automatic fitting procedures or if particular line features are essential to identify a certain spectral type (lines predicted for the wrong wavelength will make this more difficult). Hence, with present atomic data, either choice is only a compromise solution.
By combining three different model atmospheres, the high-resolution stellar library of Martins et al. (Mar05 (2005)) provides the largest coverage in effective temperature (from 3000 to 50000 K) and log surface gravity (from -0.5 to 5.5). This library, still in the visible wavelength range (3000 to 7000 Å), uses the non-LTE model atmosphere TLUSTY (Hubeny Hub88 (1988), Hubeny & Lanz Hub95 (1995), Lanz & Hubeny Lan03 (2003)) for , the Kurucz’s ATLAS9 model for and Phoenix/NextGen models (Allard & Hauschildt All95 (1995), Hauschildt et al. Hau99 (1999)) which use spherical symmetry for cooler stars with low surface gravity. A comparison with observed spectra (from the STELIB library of Le Borgne et al. LeB03 (2003) and the Indo-US library of Valdes et al. Val04 (2004)) shows the good agreement of this theoretical library with observations.
Thus, the visible range is now quite well covered by theoretical libraries, for photometric use as well as spectroscopic use and for a wide range of physical parameters. All the comparisons with observations show that these theoretical spectra can reasonably well mimic real stars, at least at the spectral resolution where the comparisons were made.
The goal of the present work is to go one step further, exploring the near-infrared range where few observed fully calibrated and no theoretical libraries are available. This research takes place in a more general framework which consists in the synthesis of the stellar population of galaxies hosting active galactic nuclei by an inverse method, described in Pelat (Pel97 (1997)) and Moultaka & Pelat (Mou00 (2000)). The H-band provides very good luminosity discriminators for stars later than K0 (cf Dallier et al. Dal96 (1996)) and the particular region 1.57-1.64 m of the H-band is clear of strong emission lines (except Brackett lines). It allows to sample the stellar content of the very nucleus of Seyfert 1 galaxies, at the contrary of the visible range where the strong broad emission lines of the active nucleus contaminate so much the spectra of the galactic inner part that there are too few absorption lines from the stellar component to synthesize this region.
The lack of stellar observations at medium resolution for the near-infrared range, especially for super-metallic stars, drove us to work with theoretical spectra. But the behavior of model atmospheres and fluxes is not very well known in the infrared.
Decin et al. (Dec03 (2003)) have compared several observed stars with theoretical spectra computed with the MARCS models (Gustafsson et al. Gus75 (1975), Plez et al. Ple92 (1992)) in the range 2.38 to 12 m for the ISO-SWS calibration, at a resolving power . This study points out the difficulties of modelisation due to strong molecular opacities and the bad accuracy and completeness of the atomic data in these wavelength ranges.
In this paper, we compute theoretical spectra using the NeMo (Vienna New Model) grid of atmospheres (Heiter et al. Hei02 (2002), Nendwich et al. Nend04 (2004)) based on the model atmosphere code ATLAS9 by Kurucz (1993a , Kur98 (1998)) and Castelli et al. (Cas97 (1997)), combined with the list of absorption lines VALD (Vienna Atomic Line Database, Kupka et al. Kup99 (1999)), eventually completed by molecular data collected by one of us (VT). These models are described in Sect. 2. Synthetic stellar spectra are computed with the code SynthV (built by VT), as shown in Sect. 3, using the model atmospheres described in Sect. 2 as input. Several tests on the input parameters of the spectra are done in Sect. 4.
In a first step of applying our synthesis calculations (Sect. 5), we compare a set of observed stellar spectra with their corresponding models in the visible wavelength range (5000 to 9000 Å) to check the range of validity of the NeMo grid, exploring the whole range of physical parameters (effective temperature, surface gravity and metallicity). In a second step, we generate synthetic spectra in the near-infrared range and compare them with observed ones. The results of this comparison are described in Sect. 6, as are tests which demonstrate that the particular choice of model atmospheres can be expected to be less important than the set of line lists used for the computation of spectra. Our conclusions are summarized in Sect. 7.
2 Description of the model atmospheres
NeMo differs from the original grids of model atmospheres based on ATLAS9 in the treatment of the convective energy transport. It provides also a higher vertical resolution of the atmospheres and a finer grid in effective temperature and surface gravity.
This model grid of stellar atmosphere uses convection treatment without overshooting. The overshooting prescription has been introduced by Kurucz (1993a , Kur98 (1998)) and modified by Castelli et al. (Cas97 (1997)). It was supposed to take into account the change in the temperature gradient of the stable atmosphere layers near a convective zone due to the overshooting of gas from that zone into the stellar atmosphere. But this prescription is left aside in the present work, because, even if the properties of various numerical simulations are well described and in good agreement when compared to observations of the Sun, models with overshooting are worse than models without for other stellar types (see Heiter et al. Hei02 (2002) for a detailed discussion).
The NeMo grids offer a choice among different convection models. One of them is the mixing length theory (MLT), with . The parameter represents the ratio between the characteristic length (distance traveled by an element of fluid before its dissolution) and the scale height of the local pressure. This parameter is subject to discussion: according to comparisons between observed and computed energy distributions for the Sun done by Castelli et al. (Cas97 (1997)), should be set at least to 1.25, but Van’t Veer & Mégessier (vVe96 (1996)), using the same codes and input data as Castelli et al. (Cas97 (1997)), but different observations for the Sun, found that is required to fit both Hα and Hβ profiles. Fuhrmann et al. (Fur93 (1993)) were the first to notice that a value of 0.5 for the parameter is needed to reproduce the Balmer line profiles of cool dwarf stars. In addition, this parameter has to span a large domain (from 1 to 3) to reproduce the red giants (Stothers & Chin Sto97 (1997)). The alternative convective models available in the NeMo grids are of ”Full Spectrum Turbulence” (FST) type. Introduced by Canuto & Mazzitelli (Can91 (1991), Can92 (1992); thereafter CM model) and Canuto, Goldman & Mazzitelli (Can96 (1996); thereafter CGM model), these models avoid the one-eddy approximation of MLT. In addition, both models were suggested to be used with a scale length different from the usual multiple of the local pressure scale height (see Heiter et al. Hei02 (2002) for further details).
The latter models were introduced in NeMo to allow a choice among different treatments of the internal structure of the stars, depending on the aim of the model computation and its underlying assumption of how to describe the convective energy transport within the limitations of a simple convection model (using only algebraic rather than differential equations).
Two levels of vertical resolution are also offered and hence we can either work with 72 or 288 layers. The MLT models are computed with 72 layers, CM models with 288 and CGM ones are computed for both values.
The metallicity of the model atmopheres covers a large range between -2.0 and +1.0 dex and have 13 different values. This range of metallicity is enough for our purpose. The super metal rich stars, in particular, are represented with five different levels of metallicity (+0.1, +0.2, +0.3, +0.5 and +1.0 dex) reaching the highest possible value for a real star.
NeMo provides model atmospheres for effective temperatures between 4000K and 10000K, by successive steps of 200K; for lowest temperatures, the model atmospheres computed with ATLAS9 become inadequate, mainly because of the molecular opacities which become very important for cool stars. The MARCS6 models (Gustafsson et al. Gus75 (1975), Plez et al. Ple92 (1992)), more dedicated to the cool stars, handle this problem with a more complete treatment of molecular opacity.
The available values for the surface gravity (log g) of the stellar atmospheres in the NeMo grid span a range from 2.0 to 5.0 with steps of 0.2. It is bounded at 2.0 owing to the plane-parallel approximation used in ATLAS9; for lower values of log g, spherically symmetric geometry should be used instead (cf. Hauschildt et al. Hau99 (1999) and Baraffe et al. Bar02 (2002)).
Other models, working with the appropriate geometry like MARCS6 or Phoenix/NextGen (Allard & Hauschildt All95 (1995), Hauschildt et al. Hau99 (1999)) are necessary for these small values. Indeed, MARCS6, whose main purpose is to model cool stars, uses also the approximation of spherically symmetric geometry to reproduce supergiants and the cool giants stars, which have a low surface gravity (Plez et al. Ple92 (1992)). NextGen models, like ATLAS9, assume LTE and plane-parallel geometry for dwarf stars, but a spherical symmetry is used for low-gravity giant and pre-main sequence stars (log g 3.5, see Hauschildt et al. Hau99 (1999)).
Contrary to NeMo and MARCS6, NextGen can use a non-LTE model for high temperature stars. But using NLTE does not improve significantly the modelisation of our observed stars, as NLTE effects begin to occur only from 7000 K to higher effective temperature (Hauschildt et al. Hau99 (1999)), but are still small to at least 10000 K. Moreover, NextGen does not reproduce well enough the individual lines owing to the treatment of atomic and molecular lines with a direct opacity sampling method. Indeed, working with opacity distribution functions, like in ATLAS9, would ask too much computer resources when using NLTE calculations (Hauschildt et al. Hau99 (1999)). In addition to that, too few layers are used in the published models to describe the bottom part of the photosphere.
However, NextGen could be an alternative to ATLAS9 type model atmospheres in a next step of our project, for generating spectra of stars with a log g below 2.0 (for which spherical symmetry is needed) and/or an effective temperature above 10000 K.
Bertone et al. (Ber04 (2004)) have compared both ATLAS9 and NextGen models to observations in the visible range along the whole spectral-type sequence. The conclusions of this work are that both models reproduce very well the spectral energy distribution of F type stars and earlier but this good agreement decreases at lower temperature, especially for K stars, owing to the lack of molecular treatment in those models. ATLAS9 provides a better fit, in general, from B to K type stars but as said previously NextGen is more suitable for M stars, due to the use of spherical geommetry for the giants and a more complete molecular line opacity. However, Martins et al. (Mar05 (2005)) note that this comparison is made with a previous generation of NextGen models, using for example a mixing length parameter of 1 instead of 2, preferred by hydrodynamic models. This is also true for the ATLAS9 models, as Bertone et al. (Ber04 (2004)) did not use the latest versions of ATLAS9, including new opacity distribution functions (Castelli & Kurucz Cas03 (2003)), computed with more up-to-date solar abundances and molecular contributions than the previous one.
Thus, a new comparison with observations in the visible range is not unnecessary. Moreover, an extensive comparison of spectra based on the NeMo grid of model atmospheres for the entire range of A to early M stars including both dwarfs and giants has not been done before. We hence begin our comparison with observations in the visual before proceeding to the infrared. The implications of changing abundances or the description of convection at spectral resolutions relevant for studies of galaxies are included as part of the discussion of our comparisons.
3 Obtaining a theoretical spectrum
First of all, we downloaded the model atmospheres corresponding to the stellar types wanted from the NeMo website (http://ams.astro.univie.ac.at/nemo/). The models are classified according to the convection model (CM, CGM or MLT) and to the number of layers representing the atmosphere. The model CGM with 72 layers is detailed enough for our purpose. Models with 288 layers are used only for specific applications like the calculation of the convective scale length in stellar interior models (Heiter et al. Hei02 (2002)). Reduced to the medium resolution of our observations, both computations of a model with 72 and 288 layers respectively give similar spectra.
The next parameter to determine is the microturbulence velocity. For cool dwarf stars, this velocity is low: about 0–1 km/s, but the value is increasing towards higher luminosities, reaching values as high as 5 km/s (Gray Gra92 (1992)). A few stars do not follow this rule: hot stars, like B and O type, have a negligible microturbulence velocity and some specific types of A stars can either have a null velocity (Ap type stars, for them magnetic field effects are important instead) or a velocity of 4 km/s (Am type stars). As the microturbulence velocity has only a small influence on the overall shape of the spectra and on the line profiles at our spectral resolution, we can use a common value of 2 km/s for comparison with all our stellar spectra, composed by A to early-M type dwarf and F to K type giant stars, as 2 km/s is a good compromise for these stars (Gray Gra92 (1992)).
Then, the three main physical parameters of the star have to be chosen. The metallicity, the effective temperature and the surface gravity of the theoretical stellar spectrum should correspond as good as possible to the observed star to be compared. Therefore, once the stellar characteristics are determined, the nearest set of parameters (T, log g, Z) in the NeMo grid is taken.
The metallicity is taken from Nordstroem et al. (Nor04 (2004)), Cayrel de Strobel et al. (Cay01 (2001)) and Barbuy & Grenon (Bar90 (1990)) when available for individual stars of the sample, otherwise assumed to be solar.
Nordstroem et al. (Nor04 (2004)) have determined the effective temperature of most of the dwarf stars in our sample, for other stars the effective temperature is assumed, as well as the surface gravity, according to their spectral type from the corresponding values of temperature and gravity as given in Schmidt-Kaler (Sch82 (1982)) and Gray (Gra92 (1992)).
Once the most suitable model atmosphere is determined, we can generate a theoretical flux calibrated spectrum with the code SynthV (by VT). This code requires several input parameters such as the wavelength range for which the spectrum will be computed, as well as the wavelength step. This step has to be small enough compared to 2.5 Å as the desired opacity in each wavelength point includes absorption from all nearest lines within 2.5 Å, so large wavelength steps would give wrong results. We take 0.1 Å in the visible and in the infrared range. Then, we can enter a rotation profile for the star, if needed, and indicate a list of absorption lines to be used. For our work, we take the Vienna Atomic Linelist Database (VALD), completed by several molecular line lists (C2, CN, CO, H2, CH, NH, OH, MgH, SiH, SiO, TiO, H2O 111file VColl_molec.lns built by VT from Kurucz’ CDROMs 15, 24, 25, and 26, see Kurucz 1993b and Kur99 (1999); the file is available from V. Tsymbal upon request). The line profiles are approximated by a Voigt function. SynthV also provides the possibility to change individual abundances.
The final theoretical spectrum has to be reduced to the same resolution and the same sampling as the observed spectrum for further comparisons. So, the calculated spectrum is Gaussian smoothed and resampled by Fourier interpolation to the same step as the observed spectrum.
4 Testing parameters
The determination of the physical parameters of the observed stars is not as acurate as we would like. So it is necessary to investigate the nearest values of Teff / log g / Z of the grid. The chemical abundances can also be changed; as these abundances are not very well determined, it is crucial to notice how a variation of the abundance of one element modifies the spectrum.
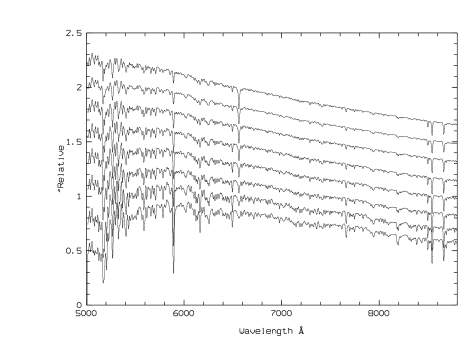
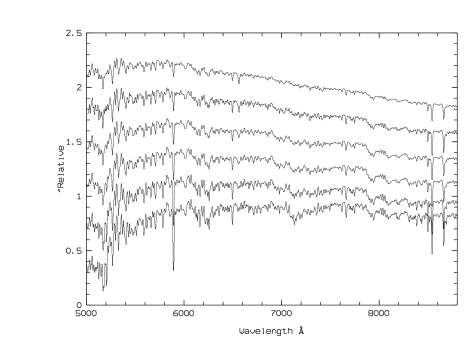
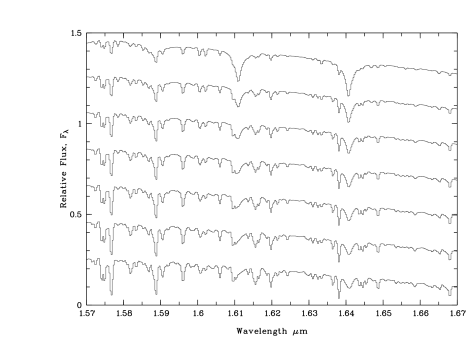
The most important change is caused by the temperature. Indeed, the step of 200 K as was chosen for the grid computation is still quite large for our purpose and a deviation of this range can be dramatic for the slope of the spectrum. The coldest stars (M, K and even G type) are the ones most affected by a change of 200 K.
Fig. 1 and 2 show the evolution of the spectra with temperature in the visible range for the dwarfs and the giants, respectively, and Fig. 3 shows this evolution for dwarf stars in the infrared range. We can see that for intermediate temperature, there is mainly a difference in continuum. But for the extreme values, the modification of the spectrum is more dramatic, as it affects also the absorption line features.
A change in log g causes a variation of the line profiles. This parameter is not very well known for observed stars. So it is important to test different values around a first guess. Even if the variation caused by a gap of 0.2 in log g is not very important, it can improve the comparison.
The metallicity has an influence on the slope of the continuum: increasing the metallicity of a theoretical spectrum has a similar influence on the continuum as decreasing the temperature (see e.g. Ramírez & Meléndez, 2005, for a detailled discussion). A variation of metallicity has also a clear influence on the strength of the absorption lines.
The variation of individual abundances can also cause some changes in the spectra. SynthV uses by default solar abundances of Anders & Grevesse (And89 (1989)). But some studies more recent like Kurucz (1993a ) or Holweger (Hol01 (2001)) give different values for various elements (like He, Fe, O, C, N…). These changes can be quite important (up to 0.2 dex for Fe). A simple test to probe the influence of different abundances was made comparing two spectra assuming the same physical parameters, except for the solar abundance of Holweger (Hol01 (2001)) in one case and the one used by Kurucz (1993a ) in the other. The result shows only slight differences, and the comparison with our observations cannot determine whether one is better than the other. For our work, we chose the values given by Holweger (Hol01 (2001)).
In order to fit metallic stars, it is also important to check the influence of the modification of an individual element abundance on the synthetic spectrum. A change of the individual abundances of O and C leads to a modification of OH and CO line strengths, respectively. Indeed, when the ratio C/O increases, more CO molecules will be formed; on the other hand, when it decreases, more oxygen will be left to form OH molecules (see Decin et al. Dec00 (2000)).
For the hottest stars, it is important to take into account rotational velocity. At the medium resolution of our observations, a convolution with a Gaussian profile is good enough to reproduce this effect. Hence, we do not need to include a more accurate description of the change in the profile of the lines caused by the rotational velocity. Consequently, even though SynthV allows to compute spectra with a rotational velocity profile for the lines, we compute the spectra without rotational velocity in order to save computation time and convolve them afterwards with a gaussian profile.
Additional tests have been made with a different microturbulence velocity for a very cool star (4 km/s for a M0V-type spectrum in the visible range) and a different number of layers for the convection model (288 instead of 72 for the same CGM model and the same physical parameters). At the resolution of the observed samples, these modifications do not lead to any difference.
5 Results in the visible range
Although our goal is to explore spectra in the infrared wavelength range, a study of the behavior of the NeMo model atmospheres and spectra in the visible range provides us a good indication of their reliability as a function of the physical parameters of the stars.
5.1 Observations in the visible
18 spectra of observed stars (A to M dwarfs and G to K giants) corresponding to the range of the parameters in the NeMo grid have been compared to theoretical stellar spectra. This sample of observed spectra at a resolving power of R 600 is taken from the stellar library used by Boisson et al. (Boi00 (2000)). One part of these observations comes from the stellar library of Silva & Cornell (Sil92 (1992)), made at the KPNO with the MARK III spectrograph, they cover the wavelength range 3500-9000Å. These spectra are, for most of them, a mean-value of several stars of nearby spectral type. The name of these stars and the mean associated spectral types as given by Silva & Cornell are listed in Table 1. The remaining of the library, mainly supermetallic stars, were observed by Serote Roos et al. (Ser96 (1996)) at the CFHT with the Herzberg spectrograph and at OHP with the Aurelie spectrograph. The spectral range is limited to 5000-9000Å. The name, spectral type (or associated mean-spectral type) and parameters of these stars are listed in Table 1.
| Name | Spectral Type | (K) | log g | [Fe/H] | |
|---|---|---|---|---|---|
| HD116608,HD190785,HD124320 | A1-3 V | - | |||
| & HD221741 | |||||
| HD88815 | F2 V | ||||
| HD187691, HD149890 | F8-9 V | , | , | ||
| HD121370 | rG0 IV | ||||
| HD38858 | G4 V | ||||
| HD161797 | rG5 IV | ||||
| HD149661,HD151541,HD33278, | G9K0 V | , , , | , , - | ||
| HD23524,SAO66004,SAO84725 | , , | , -, - | |||
| HD93800 | rK0 V | ||||
| HD39715 | rK3 V | ||||
| HD36395 | rM1 V | ||||
| HD15866, HD25894, HD2506 | G0-4 III | - | |||
| HD163993 | wG8 III | ||||
| HD72324 | G9 III | - | |||
| HD33506, HD112989 | rG9K2 III | ||||
| SAO76803 | K2 III | - | |||
| HD181984 | rK2 III | ||||
| HD176670 | rK3 III | ||||
| HD154733, HD21110 | K4 III | ,- |
The atmospheric bands are removed from the observed spectra to compare with the theoretical spectra.
5.2 Comparisons
When the physical parameters (see Table 1) are known, we took the model with the nearest values, otherwise we used the mean values according to the spectral type as starting points and investigated the nearby values to find the best agreement between the observed and the computed spectra. The theoretical spectra are computed with a wavelength step of 0.1 Å, corresponding to a resolution of 60000 at 6000 Å, then Gaussian smoothed to the resolution of the observed spectra. By Fourier interpolation, we reduce the computed spectra to the same wavelength step as the observations. Spectra are normalized to 1 in the range 5440-5460Å. When the star has a rotational velocity, we convolve the corresponding computed spectrum with a Gaussian of the same velocity.
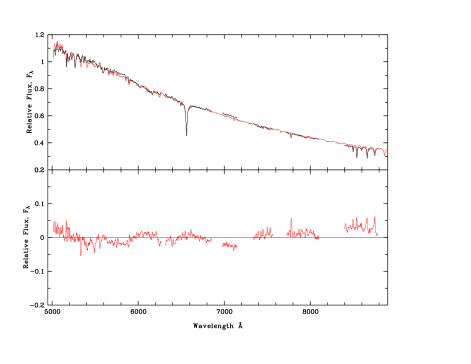
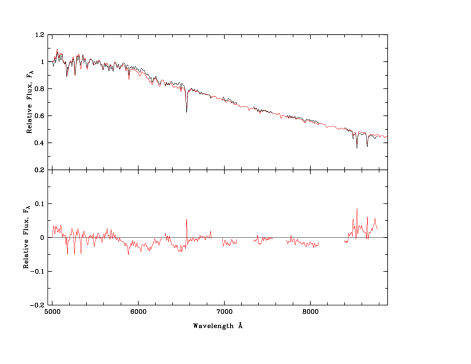
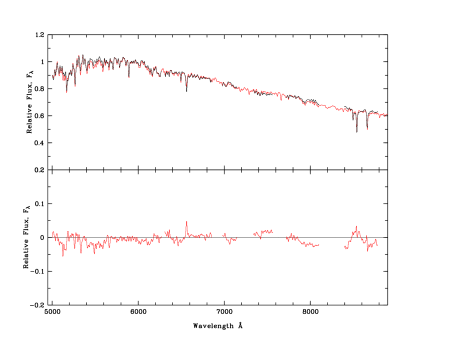
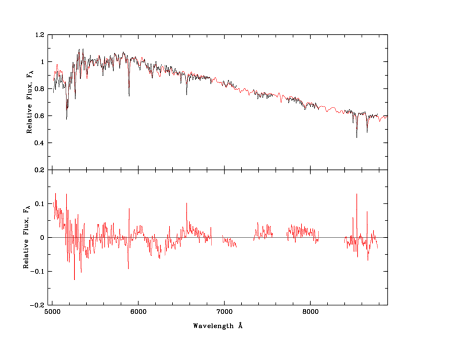
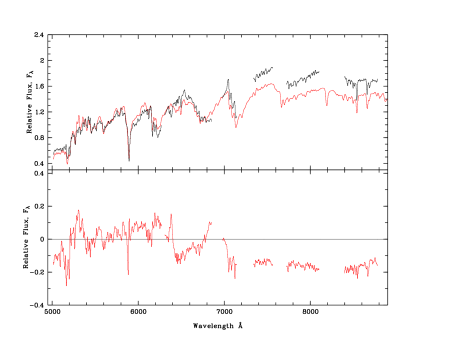
The agreement between the observed and computed spectra is satisfactory for effective temperatures ranging 4600 to 9000 K, 9000 K corresponding to the highest temperature for the stars composing our sample. For these spectra, the main discrepancies, which consist in differences in the slope of the blue extremity of the continuum, can be explained by the difficulty to have a good flux calibration at the wavelength ends of the observational data (in particular at 5000Å where strong MgI, MgH and FeI absorptions are present). Various examples of comparisons for these stars are shown in Fig. 4-7. The spectral type of the observed stars and the physical parameters used to compute the theoretical spectra are noticed for each figure.
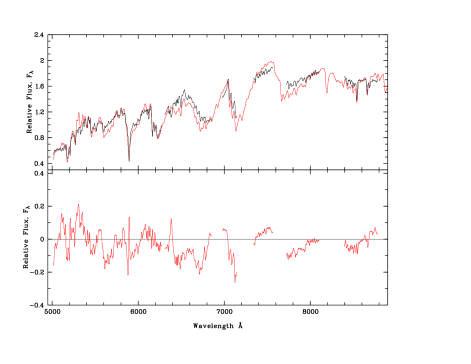
Three stars have a temperature below 4400 K, one dwarf and two giants. The M dwarf star (HD 36395) is particular as it has a very high metallicity. It is the most metallic star of Cayrel de Strobel’s catalog.222[Fe/H]=+0.6 dex Indeed, to fit correctly the observations, we need to set the metallicity of the theoretical star as high as possible (Fig. 8), but a metallicity of [M/H]=+1.0 dex is not realistic. Fig. 9 shows that [M/H]=+0.5 dex is not sufficient. However, recently Woolf & Wallerstein (Woo05 (2005)) have found a temperature of 3760 K (instead of 3850 K) and a metallicity of [Fe/H]=+0.2 dex for this star. So the discrepancies may be simply due to the difference in temperature, out of reach for NeMo.

The two others are K giant stars. First it is worth to say that at this low temperature, a difference of 200 K causes a variation of the slope of the continuum more important than for the highest temperatures. Thus, the continuum of the K3III observed star can neither be correctly fitted by a computed spectrum with a temperature of 4400 K nor with 4200 K. The first one is too blue and the second one is too red. Another difficulty comes from the Na line at 5894 Å and the MgH band computed too strong compared to the observations. These absorption features are very sensitive to a variation of temperature and a too strong value means that the temperature is too low, but increasing the temperature would lead to a continuum too blue. This is particularly clear for the K4III star, which lies on the boundaries of the NeMo grid for temperature and gravity (T=4000 K, log g=2.0), as we can see on Fig. 10. This star comes from the stellar library of Silva & Cornell (1992) whose original spectra extend down to 3500Å. The agreement for the slope of the continuum is satisfactory, but the computed NaI line, the MgH band as well as other lines and molecular bands such as e.g. CaII, CN, Gband are by far too strong. If we set the temperature at 4200 K, which is still reasonable for this kind of star, the accordance for the lines and molecular bands would be better, but the slope of the observed continuum would be too red.
The hypothesis of plane-parallel geometry of the model begins to become unrealistic (low log gravity) and the molecular opacities, which are not taken sufficiently into account in ATLAS9, become important for these cool stars.
6 Results in the infrared range
We can immediatly say that there are, by far, more discrepancies between the computed and the observed spectra in the infrared than in the visible range, even at the medium resolution we have.
6.1 Observations in the infrared
The observed spectra for this wavelength range come from Meyer et al. (Mey98 (1998)) and Boisson et al. (Boi02 (2002)). The Meyer’s ones are observations at a resolving power of R 3000 at 1.6 m with the KPNO Mayall 4 m Fourier Transform Spectrometer; these spectra have to be calibrated in flux. The stars from Boisson et al. (Boi02 (2002)) come from the ISAAC spectrograph, mounted on the VLT telescope, at a resolving power of R 3300 at 1.6 m. From these samples, we selected 23 stars matching the available parameters of NeMo (A to M dwarfs and F to K giants), listed in Table 2.
| Name | Spectral Type | (km/s) | (K) | log g | [Fe/H] |
|---|---|---|---|---|---|
| HD159217 | A0 V | ||||
| HD27397 | F0 IV | ||||
| HD48501 | F2 V | 0 | |||
| HD26015 | F3 V | 65 | |||
| HD30606 | F6 V | 10 | |||
| HD98231 | F8.5 V | 7 | |||
| HD112164 | rG1 V | 5 | |||
| HD10307 | G1.5 V | 4 | |||
| HD98230 | G2 V | 4 | |||
| HD106116 | rG4 V | 3 | |||
| HD20618 | G6 IV | 2 | |||
| HD101501 | G8 V | 2 | |||
| HD185144 | K0 V | 2 | |||
| HD22049 | K2 V | 2 | |||
| HD39715 | rK3 V | 1 | |||
| HD131977 | K4 V | 1 | |||
| HD201902 | K7 V | 1 | |||
| GL338 | M0 V | 1 | |||
| HD89025 | F0 III | ||||
| HD432 | F2 III | ||||
| HD107950 | G6 III | ||||
| HD197989 | K0 III | ||||
| HD3627 | K3 III |
6.2 Comparisons
Around 1.6 m hot stars are dominated by the Brackett lines, and a good determination of the rotational velocity of these stars, which broadens the lines, is very important to have the best possible match between the computation and the observation. In our wavelength range, the Brackett lines at 1.588, 1.611 and 1.641 m are nearly the only features of the observed spectra. They are well fitted by the theoretical spectra.
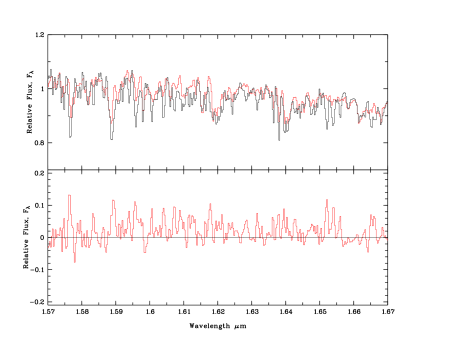
When the temperature decreases, some atomic features appear and the comparison between observed and computed spectra deteriorates. Indeed, for the F6V, a quite large amount of metallic lines, visible in the observed spectra, are not present or too weak in the computed spectra and this trend continues with the F8.5V (Fig. 11). The continuum of these observed spectra is very well reproduced, but this is not the case for the lines: most of the metallic lines are computed too weak.
In addition, for the F8.5V star, the Brackett lines at 1.611 and 1.641 m, are computed too strong. Indeed, the Brackett lines have almost disappeared in the observed spectrum but are still strong in the computation.
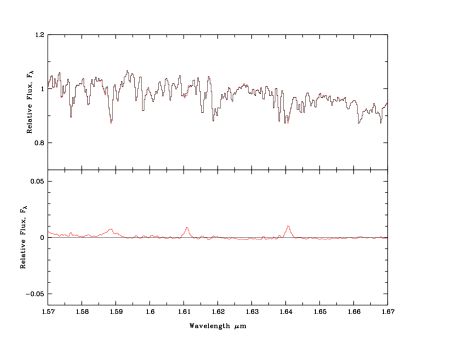
These Brackett lines are also present in all the theoretical G stars, which is not always the case for observed stars, as seen in Fig. 12. The behaviour of the computed Brackett lines towards the temperature is shown on Fig. 3; the Brackett lines are still present in theoretical spectra for temperatures as low as 5200K.

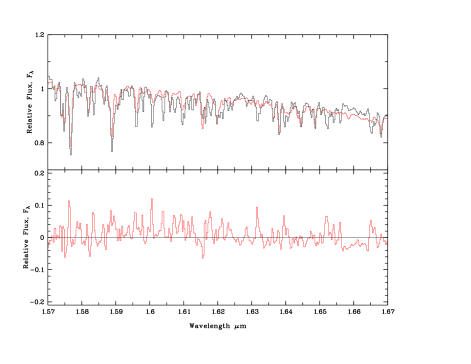
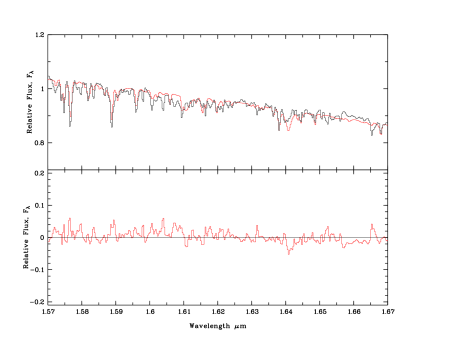
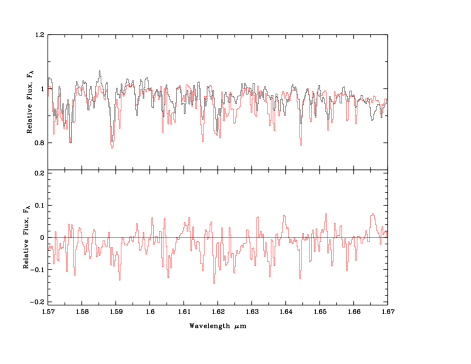
Then, when the temperature decreases, as expected, the Brackett lines are fainter and atomic lines (FeI, SiI, MgI and CaI) become stronger and stronger for the observed spectra, as well as the theoretical spectra. But the agreement between the computed and the observed stars becomes worse. From Fig. 12 to 15, the residuals between observed and theoretical spectra show that several absorption lines are missing in the theoretical stars, iron lines for the most part. The model atmosphere is not the reason because the continuum shape is very good and several lines match perfectly, but the line list needs to be improved.
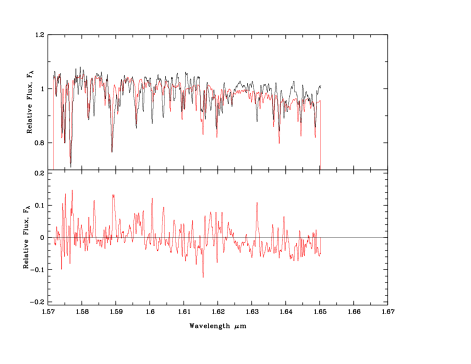
In the infrared range, the lack of several metallic and molecular lines causes the discrepancies, with enhanced differences at low temperature due to the greatest strength of the lines for the coolest star (Fig. 15). Fig. 13 and 14 present two similar stars (K2V and K4V, respectively), the first one is from Meyer and the second one is a VLT observation at higher resolution. Both comparisons show this lack of absorption lines, with more details visible for Fig. 14.
The comparison for the coolest dwarf star of this sample, a M0V, is not so bad for such a low temperature. The continuum is good in spite of the limitations of the model (Fig. 16). We notice, however, that at the contrary of the previous spectra, the absorption lines are computed too strong for the theoretical spectrum, as seen thanks to the residual. This is probably due to the limit of validity of the model atmospheres, as already seen in the visible range.
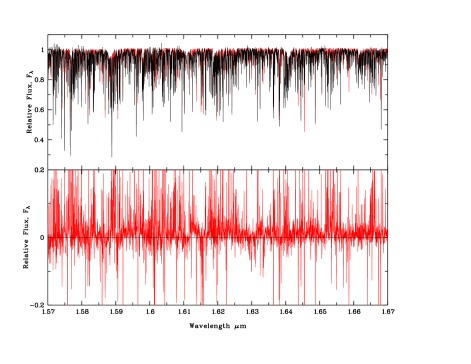
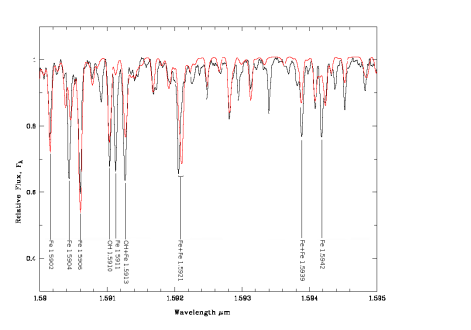
In order to investigate further which lines are missing in the computations, we have compared the high-resolution spectrum of the well-known K1III star Arcturus (Hinkle et al. 1995) to a theoretical spectrum computed with the parameters of this star ( = 4400 K, log g = 2.0, [M/H]=-0.2, = 3.5 km/s) and point out the discrepancies: Fig. 19 shows a detail of this comparison, and Table 3 lists the missing lines in the whole range. In addition to the lines quoted in Table 3, several other features are computed too weak, in particular OH and CO molecular bands, certainly due to an inaccurate determination of the oscillator strengths, as discussed in Lyubchik et al. (Lyu04 (2004)).
This study, based on the NeMo grids of atmospheres, remains valid for the entire familly of the ATLAS models. Indeed, as shown in Fig. 17, two theoretical spectra computed for the same physical parameters, with the NeMo grid and the ATLAS9 models with the overshooting prescription (Kurucz 1993a , Kur98 (1998); Castelli et al. Cas97 (1997), respectively), are very similar at our spectral resolution. The discrepancies between the two different theoretical spectra are very faint compared to the discrepancies between the models and the observed spectra.
The same ATLAS9 models, but without overshooting (NOVER models, Castelli et al. Cas97 (1997)), present even less differences with the NeMo spectra, in particular the slight discrepancy found for the Brackett lines disappear. They are more sensitive than other lines to the fact that the Kurucz overshooting prescription changes the temperatures at Rosseland optical depths of 0.1 to 0.5.
| wavelength (m) | element | wavelength (m) | element | |
|---|---|---|---|---|
| 1.5764 | Fe | 1.6208 | Fe | |
| 1.5893 | Fe | 1.6214 | Fe | |
| 1.5895 | Fe | 1.6231 | Fe | |
| 1.5913 | Fe | 1.6285 | Fe | |
| 1.5939 | Fe | 1.6316 | Fe | |
| 1.5954 | Fe | 1.6319 | Fe | |
| 1.5968 | Fe | 1.6362 | Ni | |
| 1.6007 | Fe | 1.6394 | Fe | |
| 1.6008 | Fe | 1.6440 | Fe | |
| 1.6041 | Fe | 1.6450 | OH | |
| 1.6071 | Fe | 1.6517 | Fe | |
| 1.6076 | Fe | 1.6524 | Fe | |
| 1.6088 | Fe | 1.6532 | Fe | |
| 1.6116 | Fe | 1.6569 | Fe | |
| 1.6126 | Fe | |||
| 1.6175 | Fe | |||
| 1.6195 | Fe |
7 Conclusions
In spite of some discrepancies, the comparisons between observed and theoretical spectra in the visible range suggests a reasonable agreement, even at the limits of the parameter range of NeMo. However, we have to be careful when we compute a model near the lower limit in temperature.
The spectra modelized with NeMo can be used to build a theoretical spectral library for A to K dwarf and giant stars in the visible range, but this is not the case for the near-infrared range.
Indeed, in the range 1.57 to 1.67 m, the spectra computed do not reproduce very well the observations. Albeit the good agreement for the overall flux distribution shape, we can see that there are many differences for the line features when focusing on details of the spectra. The strength of the infrared absorption lines is usually underestimated in calculations, and some lines are simply missing (Fe, OH and CO lines are the most problematic ones). As pointed out by Decin et al. (Dec03 (2003)) for the MARCS6 models and Lyubchik et al. (Lyu04 (2004)) for NextGen models of ultracool dwarfs and a Kurucz model for Arcturus, it was not possible to generate synthetic spectra which can reproduce observed spectra in the infrared with the line lists that have been used in constructing the model atmospheres, even at a medium resolution. In particular, the oscillator strengths are still not known sufficiently well.
We have also performed a comparison of spectra that include the lines from iron peak elements with predicted energy levels, as published by Kurucz (Kur98 (1998)), with the observations of Arcturus discussed above. As to be expected, such spectra contain more lines, but the inaccuracy of their energy levels frequently places them at the wrong wavelengths and the overall match hardly improves (the total flux distribution over all wavelength ranges, particularly in the ultraviolet, is closer to observations when including this set of lines, but for the limited wavelength range around the H band the effects are small and sufficiently compensated when setting the zero point of the flux distribution). For the case of Arcturus we also performed a comparison with spectra computed with PHOENIX in LTE (P. Hauschildt, priv. comm. 2005). The resulting spectra for the 1.57 to 1.67 m range were found to be rather similar to those from NeMo/VALD/SynthV when including the predicted level lines. One important reason for this is certainly the fact that the atomic line lists for PHOENIX are essentially those of Kurucz (Kur98 (1998)). Because the flux distribution of the PHOENIX spectra is similar to the observations as well, at least for the K giants the detailed choice of the model atmosphere code appears to be clearly less important than the choice of atomic line lists (note that PHOENIX uses its own collection of molecular line lists, different from the one we have used here). Considering the uniformity of the deterioration of the match of spectra in the 1.57 to 1.67 m range when looking at the sequence from F to K stars we conclude that the insufficient line lists, and in particular lists of atomic lines, are the main obstacle for a more satisfactory match of observed spectra of these groups of stars. The modelizing in the infrared range needs some further improvements, in particular for the absorption lines database, before to build a theoretical spectral library which can be used with high benefit instead of an observed star library.
The lack of M stars in spectral library would be very much prejudicial to the study of stellar populations as the variations of their strong atomic lines and molecular bands along their evolution from dwarf to supergiant to giant provides very good age discriminators (from 106 to 1010yrs). M stars peak in a wavelength range which is not much absorbed even in heavily reddened region, as young stellar clusters, making them easily detectable. Moreover they are known to be very important contributors to the stellar populations of galaxies as well for the mass as for the luminosity following the age of the population. All this make a good theoretical library of M stars very critical in order to extend incomplete observed library.
The prospects of constructing such a library from the upcoming generation of model atmospheres (MARCS, PHOENIX, perhaps future versions of ATLAS) are indeed improving because of the enormous efforts spent in extending the molecular line data and equation of state. To match the spectra of the hot end of M stars in the H band will nevertheless require more complete atomic data, although this is less crucial as for K stars. Efforts along this direction are currently made.
Acknowledgements.
FK gratefully acknowledges the hospitality of the Observatoire de Paris-Meudon during his stays as an invited visitor. JF also thanks the nice people of the AMS group at Vienna Observatory for their hospitality and help during part of this work. VT acknowledges the Austrian Fonds zur Förderung der wissenschaftlichen Forschung FwF (P17580) and by the BM:BWK (project COROT). This research has made use of the model atmosphere grid NeMo, provided by the Department of Astronomy of the University of Vienna, Austria, and funded by the Austrian FwF (P14984). We are thankful to Peter Hauschildt who has computed comparison spectra for Arcturus for us which helped to demonstrate the importance of the line lists used relative to the particular choice of model atmosphere codes.References
- (1) Allard, F., & Hauschildt, P.H. 1995, ApJ, 445, 433
- (2) Anders, E., & Grevesse, N. 1989, Geochim. Cosmochim. Acta, 53, 197
- (3) Bagnulo, S., Jehin, E., Ledoux, C., Cabanac, R., Melo, C., Gilmozzi, R., The ESO Paranal Science Operations Team 2003, The Messenger, 114, 10
- (4) Baraffe, I., Chabrier, G., Allard, F., & Hauschildt, P.H. 2002, A&A, 382, 563
- (5) Barbuy, B., & Grenon, M. 1990, In: ESO/CTIO Workshop on Bulges of Galaxies. (A92-18101 05-90),p.83
- (6) Bertone, E., Buzzoni, A., Chavez, M., Rodriguez-Merino, L.H. 2004, AJ, 128, 829
- (7) Boisson, C., Joly, M., Moultaka, J., Pelat, D., & Serote Roos, M. 2000, A&A 357, 850
- (8) Boisson, C., Coupé, S., Cuby, J. G., Joly, M., Ward, M. J. 2002, A&A, 396, 489
- (9) Bruzual, G., & Charlot, S. 2003, MNRAS, 344, 1000
- (10) Canuto, V.M., Goldman, I., & Mazzitelli, I. 1996, ApJ, 473, 550
- (11) Canuto, V.M., & Mazzitelli, I. 1991, ApJ, 370, 295
- (12) Canuto, V.M., & Mazzitelli, I. 1992, ApJ, 389, 724
- (13) Castelli, F., Gratton, R., & Kurucz, R.L. 1997, A&A, 318, 841 (erratum: 1997, A&A, 324, 432)
- (14) Castelli, F., & Kurucz, R.L. 2003, in Modelling of Stellar Atmospheres, IAU Symposium vol. 210, eds. N.E. Piskunov, W.W.Weiss & D.F. Gray, p. A20C
- (15) Cayrel de Strobel G., Soubiran C., Ralite N. 2001, A&A, 373, 159
- (16) Cid Fernandes, R., Mateus, A., Sodré, L., Stasińska, G., Gomes, J.M. 2005, MNRAS, 358, 363
- (17) Dallier, R., Boisson, C., & Joly, M. 1996, A&A SS, 116, 239
- (18) Decin, L., Vandenbussche, B., Waelkens, C., Eriksson, K., Gustafsson, B., Plez, B., Sauval, A.J., & Hinkel, K. 2003, A&A, 400, 679
- (19) Decin, L., Waelkens, C., Eriksson, K., Gustafsson, B., Plez, B., Sauval, A.J., Van Assche, W. & Vandenbussche, B. 2000, A&A, 364, 137
- (20) Fuhrmann, K., Axer, M., & Gehren, T. 1993, A&A, 271, 451
- (21) Gray, D.F. 1992, The observation and analysis of stellar photospheres (Cambridge University Press)
- (22) Gustafsson, B., Bell, R.A., Eriksson, K., Nordlund, Å 1975, A&A, 42, 407
- (23) Hauschildt, P.H., Allard, F., Ferguson, J., Baron, E., & Alexander, D.R. 1999, ApJ, 525, 871
- (24) Heiter, U., Kupka, F., van’t Veer-Menneret, C., Barban, C., Weiss, W.W., Goupil, M.-J., Schmidt, W., Katz, D., & Garrido, R. 2002, A&A, 392, 619
- (25) Hinkle, K., Wallace, L., & Livingston, W. 1995, PASP, 107, 1042
- (26) Holweger, H. 2001, In: SOHO/ACE Workshop ”Solar and Galactic Composition”, R.F. Wimmer-Schweingruber (eds.), AIP Conference Series 598 (Springer, New York), p. 23
- (27) Hubeny, I. 1988, Computer Physics Comm., 52, 103
- (28) Hubeny, I., & Lanz, T. 1995, ApJ, 439, 875
- (29) Ivanov, V.D., Rieke, M.J., Engelbracht, C.W., Alonso-Herrero, A., Rieke, G.H., Luhman, K.L. 2004, ApJS, 151, 387
- (30) Kupka, F., Piskunov, N.E., Ryabchikova, T.A., Stempels, H.C., & Weiss, W.W. 1999, A&AS, 138, 119
- (31) Kurucz, R.L. 1992, in The Stellar Population of Galaxies, IAU Symp. 149, eds. Barbuy B., Renzini A., Kluwer, Dordrecht, p. 225
- (32) Kurucz, R.L. 1993a, ATLAS9 Stellar atmospheres programs and 2km/s grid, CD-ROM 13, SAO
- (33) Kurucz, R.L. 1993b, Atomic data for molecules, CD-ROM 15, SAO
- (34) Kurucz, R.L. 1998, http://kurucz.harvard.edu/, http://cfaku5.cfa.harvard.edu/
- (35) Kurucz, R.L. 1999, Atomic data for TiO and H2O, CD-ROMs 24, 25 and 26, SAO
- (36) Lanz, T., & Hubeny, I. 2003, ApJS, 146, 417
- (37) Le Borgne, D., Rocca-Volmerange, B., Prugniel, P., Lançon, A., Fioc, M., Soubiran, C. 2004,
- (38) Le Borgne, J.-F., Bruzual, G., Pelló, R., Lançon, A., Rocca-Volmerange, B., Sanahuja, B., Schaerer, D., Soubiran, C., Vílchez-Gómez, R. 2003, A&A, 402, 433
- (39) Leitherer, C., Schaerer, D., Goldader, J.D., González Delgado, R.M., Robert, C., Kune, D.F., de Mello, D.F., Devost, D., Heckman, T.M. 1999, ApJS, 123, 3
- (40) Lyubchik, Y., Jones, H.R.A., Pavlenko, Y.V., Viti, S., Pickering, J.C., & Blackwell-Whitehead, R. 2004, A&A, 416, 655
- (41) Martins, L.P., González Delgado, R.M., Leitherer, C., Cerviño, M., & Hauschildt, P. 2005, MNRAS, 358, 49
- (42) Meyer, M.R., Edwards, S., Hinkle, K.H. & Strom, S.E. 1998, ApJ, 508, 397
- (43) Moultaka, J., & Pelat, D. 2000, MNRAS 314, 409
- (44) Munari, U., Sordo, R., Castelli, F., & Zwitter, T. 2005, A&A, in press, astro-ph/0502047
- (45) Murphy, T., & Meiksin, A. 2004, MNRAS, 351, 1430
- (46) NeMo website, 2003, http://ams.astro.univie.ac.at/nemo/
- (47) Nendwich, J., Heiter U., Kupka F., Nesvacil N., Weiss W.W. 2004, Comm. Asteroseism., 144, 43
- (48) Nordström, B., Mayor, M., Andersen, J., Holmberg, J., Pont, F., Jørgensen, B. R., Olsen, E. H., Udry, S., & Mowlavi, N. 2004, A&A, 418, 989
- (49) Pelat D. 1997, MNRAS 284, 365
- (50) Plez, B., Brett, J.M., & Nordlund, Å. 1992, A&A, 256, 551
- (51) Ramírez, I., & Meléndez, J. 2005, ApJ, 626, 446
- (52) Schmidt-Kaler, Th. 1982, In: Schaifers K., Voight H.H. (eds)Landolt-Börnstein; Stars and star clusters. Numerical data and functional relationships in science and technology. Group IV, Vol. 2b
- (53) Serote Roos, M., Boisson, C., & Joly, M. 1996, A&AS, 117, 93
- (54) Silva, D., & Cornell, M. 1992, ApJS, 81, 865
- (55) Stothers, R.B., & Chin, C. 1997, ApJ, 478, L103
- (56) Valdes, F., Gupta, R., Rose, J.A., Singh, H.P., & Bell, D.J. 2004, ApJSS, 152, 251
- (57) van’t Veer-Menerret, C., & Mégessier, C. 1996, A&A, 309, 879
- (58) Woolf, V.M., & Wallerstein, G. 2005, MNRAS, 356, 963