Evidence for a high energy curvature in the XMM-Newton spectrum of the ULX NGC 1313 X-1
Abstract
ASCA X-ray spectra of many ULXs were described in terms of optically thick emission from hot () accretion disks, while recent XMM-Newton and Chandra observations have revealed a cool (), soft X-ray excess emission from a number of them. Here we utilize improved calibration and high signal-to-noise XMM-Newton spectra of NGC 1313 X-1 to present evidence for a cool () soft excess and a curved or a cutoff power-law (, ). The high energy curvature may also be described by a hot () multicolor disk blackbody. The soft excess emission is unlikely to arise from a cool disk as its blackbody temperature is similar in three XMM-Newton observations, despite a change in the observed flux by a factor of about two. Thus, previous estimates of the black hole mass of for NGC 1313 X-1 based on the temperature of the soft excess emission is unlikely to be correct. The power-law cutoff energy is found to decrease from to when the ULX brightened by a factor of about two. The unusual spectral properties of NGC 1313 X-1 are difficult to understand in the framework of the disk/corona models generally adopted for the black hole binaries or active galactic nuclei and may require to invoke super-critical accretion rates.
Subject headings:
accretion, accretion disks — stars: individual (NGC 1313 X-1) — X-rays: stars1. Introduction
Ultra-luminous X-ray sources (ULXs) are point X-ray sources with luminosities exceeding , outside the nucleus of a galaxy. The nature of ULXs continues to be an enigma, since their adopted isotropic high energy output surpasses the Eddington limit of even the most massive stellar mass black holes (BHs), sometimes by large factors. Several models have been proposed to explain the high luminosities of ULXs. The most popular is the “intermediate mass black hole (IMBH)” with mass (e.g., Colbert & Mushotzky 1999, hereafter CM99). Other models include (i) XRBs with anisotropic emission (King et al. 2001), (ii) beamed XRBs with relativistic jets directly pointing towards us i. e., scaled down versions of blazars (Mirabel & Rodriguez 1999), and (iii) XRBs with super-Eddington accretion rates (Begelman 2002).
Several observations suggest that ULXs may be similar or scaled up versions of the Galactic X-ray binaries (XRBs). Orbital modulations in some ULXs (Bauer et al. 2001; Sugiho et al. 2001) imply their binary nature. Observations of spectral transitions between the low (hard) and the high (soft) state from two ULXs in IC 342 (Kubota et al. 2001) demonstrate their similarity to the Galactic BH binaries. The ASCA X-ray spectra of ULXs have been described as the emission from optically thick accretion disks (Makishima et al. 2000 and references therein). However, the inferred inner disk temperatures in the range of are too high for an ULX accreting at sub-Eddington rates. Recent Chandra and XMM-Newton observations of ULXs have shown soft X-ray excess emission which has been interpreted as the optically thick emission from thin accretion disks with temperatures in the range of ,suggesting intermediate mass black holes () accreting at sub-Eddington () rates (see e.g., Miller, Fabian & Miller 2004a,b; Miller & Colbert 2003). Thus ULXs may either be black holes accreting at near or super Eddington rates or black holes with sub Eddington rates.
One of the first ULXs observed by XMM-Newton to show the soft excess emission that led to the IMBH interpretation, is NGC 1313 X-1 (Miller et al. 2003). Here we revisit the spectral analysis of the ULX NGC 1313 X-1 using all publicly available XMM-Newton observations with improved calibration. We show that the high energy continuum of the ULX is curved and can be well described either by a cutoff power law or a high temperature accretion disk component. We also confirm the soft excess emission earlier detected by Miller et al. (2003).
2. Observation and Data Reduction
The ULX NGC 1313 X-1 has been observed fourteen times by XMM-Newton with exposure times ranging from to . We used the EPIC data obtained from the nine observations that are publicly available and listed in Table 1. The first XMM-Newton observation on 2000 October 17 was analyzed by Miller et al. (2003) and led to one of the first discoveries of a cool soft excess component from an ULX, and a BH mass estimate of . They used the MOS data alone, as the PN data could not be processed with the SAS 5.3.3 available in 2002. There were also significant differences in the PN and MOS spectra below : the MOS data showed generally flatter spectra compared with the PN data. Here we used SAS 6.5.0 with updated calibration to process and filter both PN and MOS data obtained from all the observations listed in Table 1. All the observations were affected by a high particle background. Cleaning of the flaring particle background resulted in reduced ‘good’ exposure times listed in Table 1. Events in the bad pixels and those in adjacent pixels were discarded. Only events with pattern (single and double) for the PN and for the MOS were selected. Only three observations, with listed exposure times , are useful for our purpose of detailed spectral analysis.
| Observation | Date of | Usable |
|---|---|---|
| ID | Observation | exposure |
| 0106860101 | 2000-10-17 | |
| 0150280101 | 2003-11-25 | |
| 0150280201 | 2003-12-09 | |
| 0150280301 | 2003-12-21 | |
| 0150280401 | 2003-12-23 | |
| 0150280501 | 2003-12-25 | |
| 0150280601 | 2004-01-08 | |
| 0150280701 | 2003-12-27 | |
| 0150281101 | 2004-01-16 |
3. Analysis & Results
We extracted PN and MOS spectra from all the observations using circular regions with radii of centered at the position of NGC 1313 X-1. We also extracted PN and MOS background spectra using appropriate nearby circular regions free of sources. We created spectral response files using the SAS tasks rmfgen and arfgen. Spectral bins were chosen such that there was a minimum of and counts per spectral channel for the PN data of the first observation and all other data sets, respectively. These spectra were analyzed with XSPEC 11.3. The errors on the best-fit spectral parameters are quoted at a confidence level.
First we fitted a simple absorbed power law (PL) model to the PN and MOS spectra of NGC 1313 X-1 obtained from the first observation. We fit the MOS1 and MOS2 data jointly with an overall normalization constant to account for possible differences in source extraction areas or calibration uncertainties. We used the band in all the fits. The simple power law model resulted in minimum for degrees of freedom (dof) and for dof for the PN and MOS data respectively, thus providing statistically unacceptable fits to both the PN and MOS data. We have plotted the ratios of the PN data and the best-fit PL model in Figure 1a, and the ratios of the MOS data and the best-fit model in Fig. 1b. Both the plots are similar and clearly show a broad hump in the band and a relatively narrow soft hump or excess emission below . Addition of a soft () blackbody (BB) component improves the fit to the PN data significantly ( for two additional parameters). Similar improvements are found for the MOS data also. Fig. 1c shows the ratio of the PN data and the best-fit BB+PL model. The broad hump is now seen as excess emission in the band and in the lack of emission above . This change in the shape of the broad hump from Fig. 1a to Fig. 1c is due to the flattening of the power-law with the addition of the soft blackbody component. Addition of a multicolor accretion disk blackbody (MCD; diskbb in XSPEC) further improves the fit to the PN data ( for two additional parameters). This is an improvement at a significance level of based on the maximum likelihood ratio (MLR) test. To further verify the high energy turnover of the X-ray spectra, we replaced the PL component in the BB+PL model by a cut-off PL. The BB plus cut-off PL model yielded for one additional parameter as compared to the BB+PL model. This is an improvement at a significance level of based on the MLR test. Thus we conclude that the presence of the broad hump emission is statistically required.

Since we did not notice significant differences in the PN and MOS data, we present results based on joint spectral fitting of the PN and MOS data. Table 2 lists the best-fit parameters for the spectral models BB+PL, BB+cutoff PL, BB+MCD and BB+MCD+PL. Good signal-to-noise spectra are required in order to infer the presence of the broad hump or high energy turnover. We used only three observations in which the ULX was detected at a level of or better in the band. The X-ray spectra of NGC 1313 X-1 obtained on 2000 October 17 and 2003 December 21 clearly statistically require a cutoff in the power law or a hot MCD component in addition to the cool soft component, while the lower signal-to-noise spectra of 2004 January 8 are consistent but do not statistically require the presence of the cutoff or the MCD component.
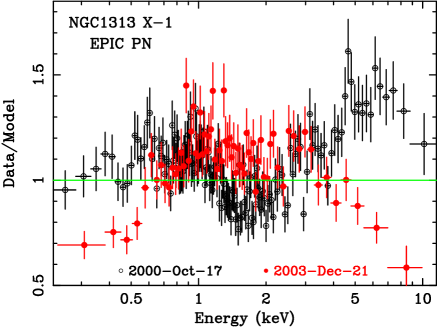
We show the spectral variability of NGC 1313 X-1 in Figure 2 in terms of the ratios of the data and the best-fit simple absorbed power-law model derived from a joint fit to the PN data obtained from the observations of 2000-10-17 and 2003-12-21. In the joint fit, the power-law index and the normalization were allowed to vary independently while the absorption columns for the two spectra were tied to each other and varied jointly. The best-fit column is and the photon indices are similar () for both the spectra. The ULX was about a factor of two brighter in the 2003-12-21 observation. There is a clear decrease in the power-law cutoff energy (see Fig. 2 and Table 2).
4. Discussion
Based on the spectral analysis of the available high signal-to-noise PN and MOS data and using the improved calibration of the EPIC instruments, we found that the X-ray spectrum of NGC 1313 X-1 is curved at high energies and shows a soft excess emission below . This ULX showed spectral softening with increasing flux, similar to that observed from BH XRBs and Seyfert 1 galaxies. The luminosity of the ULX was in 2000 October 17 with an increase to in 2003 December 21, assuming a distance of (Tully 1988).
4.1. A cool corona
The soft excess and high energy curvature in the X-ray spectra of NGC 1313 X-1 are well described by a model comprising a cool BB () and a PL () with a high energy cutoff, (see Table 2). The soft excess and power-law, with a high energy cutoff, are characteristic spectral components expected from the accretion disk-corona systems in BH XRBs and AGNs. The soft excess is thought to be the optically thick emission from an accretion disk. The cutoff power-law component arises from thermal Comptonization with a cutoff energy characteristic of the temperature of the hot comptonizing corona. The observed photon index of NGC 1313 X-1 is similar to that of BH XRBs in a low/hard state. In many such BH XRBs and also in Seyfert galaxies, the cutoff energy is usually observed in the range of (see e.g., McClintock & Remillard (2004). If the soft excess and the cutoff power-law emission from NGC 1313 X-1 arise from a disk-corona, then the corona must be extremely cool compared to the coronae of both XRB and AGNs. This is a rather puzzling result. There are also problems with the interpretation of the soft excess emission as the optically thick emission from a thin disk (see below).
4.2. The soft X-ray excess emission
The temperature of the cool soft component, parameterized as a blackbody, is keV in all three observations. The blackbody normalization increased by a factor of from 2000 October 17 to 2003 December 21. The cool soft emission was the weakest amongst the three spectral components in the observation of 2000 October 17, contributing only to the emission. In the observations of 2003 December 21 and 2004 January 8, the cool soft component contributed and , respectively, in the band. Miller et al. (2003) interpreted this component as the optically thick, thermal emission from a cool accretion disk and estimated a black hole mass of for NGC 1313 X-1.
Roberts et al. (2005) have pointed out a number of problems with the above interpretation, which is based on the extrapolation of the X-ray spectra of XRBs to the IMBH regime and the detection of soft X-ray excess emission from ULXs. It is also assumed that the accretion disks of ULXs extend to the last stable orbit, i.e., they are in a ’high’ state. This corresponds to the high/soft state of BH XRBs, where the optically thick, thermal emission from the disk completely dominates the spectrum. This is generally not the case in ULXs, where the cool soft X-ray excess emission only contributes to the total X-ray emission. The MCD component in BH XRB is associated with a steep power law (photon index ); this is not always the case in ULXs (see Miller et al. 2003, 2004; Roberts et al. 2005; Dewangan et al. 2005). The BB+PL model resulted in a photon index of for NGC 1313 X-1 in the first XMM-Newton observation (see Table 2). Furthermore, the disk temperature of BH XRBs increases with their luminosity (see e.g., Miller, Fabian & Miller 2004), but the temperature of the soft component from NGC 1313 X-1 is remarkably constant in spite of the change in the luminosity. There is also a definite curvature or cutoff above (2000 October) or (2003 December) in the X-ray spectrum of NGC 1313 X-1. This curvature is usually not present in the high state of XRBs: instead, a steep power-law () extending up to several hundred is observed. GRS 1915105 and GRO J1655-40 are the XRBs that show e-folding cutoffs at in their high state (McClintock & Remillard 2004), but, unlike NGC 1313 X-1, their power-law slopes are very steep.
| Model | Date of Observation | ||
|---|---|---|---|
| Parameters | 2000-10-17 | 2003-12-21ffSource in MOS chip gaps, only PN data were used. | 2004-01-08 |
| BB+PL | |||
| () | |||
| () | |||
| aaBB normalization in units of , where is the source luminosity in units and is the distance to source in units of . | |||
| bbIntrinsic flux in units of and in the band. | |||
| ddPower-law normalization in units of at . | |||
| bbIntrinsic flux in units of and in the band. | |||
| eeObserved flux and luminosity in units of and , respectively, and in the band of . | |||
| eeObserved flux and luminosity in units of and , respectively, and in the band of . | |||
| /dof | 1250.6/1271 | 353.0/372 | 534.6/608 |
| BB+cutoff PL | |||
| () | |||
| () | |||
| aaBB normalization in units of , where is the source luminosity in units and is the distance to source in units of . | |||
| bbIntrinsic flux in units of and in the band. | |||
| () | |||
| ddPower-law normalization in units of at . | |||
| bbIntrinsic flux in units of and in the band. | |||
| eeObserved flux and luminosity in units of and , respectively, and in the band of . | |||
| eeObserved flux and luminosity in units of and , respectively, and in the band of . | |||
| /dof | 1231.7/1270 | ||
| BB+MCD | |||
| () | |||
| () | |||
| aaBB normalization in units of , where is the source luminosity in units and is the distance to source in units of . | |||
| bbIntrinsic flux in units of and in the band. | |||
| () | |||
| ccMCD normalization in units of , where is the inner disk radius and is the disk inclination angle. | |||
| bbIntrinsic flux in units of and in the band. | |||
| eeObserved flux and luminosity in units of and , respectively, and in the band of . | |||
| eeObserved flux and luminosity in units of and , respectively, and in the band of . | |||
| /dof | 1259.6/1271 | 344.3/372 | |
| BB+MCD+PL | |||
| () | |||
| () | |||
| aaBB normalization in units of , where is the source luminosity in units and is the distance to source in units of . | |||
| bbIntrinsic flux in units of and in the band. | |||
| () | |||
| ccMCD normalization in units of , where is the inner disk radius and is the disk inclination angle. | |||
| bbIntrinsic flux in units of and in the band. | |||
| ddPower-law normalization in units of at . | |||
| bbIntrinsic flux in units of and in the band. | |||
| eeObserved flux and luminosity in units of and , respectively, and in the band of . | |||
| eeObserved flux and luminosity in units of and , respectively, and in the band of . | |||
| /dof | |||
What is the origin of the soft excess component if it is not the thermal emission from a cool accretion disk? There are other classes of accreting objects that show similar soft components. Many accreting X-ray pulsars also show soft X-ray excess emission with a blackbody temperature of (Paul et al. 2002; Hickox et al. 2004; Neilsen et al. 2004). Narrow-line Seyfert 1 galaxies (NLS1s) and quasars show soft excess emission below that is well described by a blackbody. The apparent temperature of the soft component, , is similar in a diverse selection of active galactic nuclei (e.g., Czerny et al. 2003; Gierliński & Done 2004). This observation can be compared with the similarity of the temperature of the soft component of NGC 1313 X-1 at different luminosities. The origin of the soft excess emission is not well understood. King & Pounds (2003) suggest that BHs, accreting at or above the Eddington rate, produce winds that are optically thick in continuum. Blackbody emission from these winds may provide the observed soft excess emission from ULXs.
4.3. Comparison with GRS 1915+105
XMM-Newton observed the Galactic micro-quasar GRS 1915+105 in its “radio-loud plateau state” (Martocchia et al. 2005). There is a very striking similarity between GRS 1915+105 in its plateau state and NGC 1313 X-1 observed on 2000 October. Both show small amplitude variability. Simple absorbed power-law fits to the X-ray spectra of both the objects result is similar photon index (), the residuals show similar deficits above and soft excess emissions around . Fig. 1a is quite similar to Figure 5 in Martocchia et al. (2005). The above similarity in the X-ray emission of the XRB and the ULX is observed at a factor of difference in luminosities. Thus if the X-ray spectral state is solely driven by accretion rate relative to the Eddington rate, the BH mass of NGC 1313 X-1 is likely a factor of higher () than that of GRS 1915+105. The deficit and the soft excess emission in the spectrum of GRS 1915+105 have been interpreted as the reprocessing from an ionized disk and reflection from optically thin, disk wind, respectively. There are minor differences which, if real, may lead to the different interpretation of the X-ray spectra and hence invalidate the direct scaling of their BH masses. The soft excess emission of GRS 1915+105 is not well described by a blackbody. In addition, GRS 1915+105 shows soft X-ray emission lines as well as iron K line that are not seen in the spectrum of NGC 1313 X-1. The ionized disk reflection cannot explain the cutoff or deficit above in the 2003-12-21 spectrum.
4.4. A hot accretion disk
The X-ray spectra of NGC 1313 X-1 are also well described by the superposition of a cool BB, a hot MCD and a power-law. However, the temperature of the MCD component ( on 2000 October) is too high for a thin standard accretion disk. This is similar to the “high temperature” problem of ULXs observed with ASCA (Mizuno et al. 1999; Colbert & Mushotzky 1999; Makishima et al. 2000). One possible explanation is in terms of a thin disk around a Kerr BH, since the inner radius of a Kerr disk can be times smaller than that of a Swarzschild disk, and the temperature of a thin disk varies as , thus resulting in high inner disk temperatures. Ebisawa et al. (2003) showed that Kerr models work well for ULXs but the data imply that the disks are highly inclined (). This model cannot also explain the soft excess emission below from NGC 1313 X-1.
Another attractive scenario is the slim disk model, in which the disk luminosity can exceed the Eddington luminosity by up to a factor of (Abramowicz et al. 1988, Ebisawa et al. 2003; Kawaguchi 2003). The slim disk is geometrically thick and can be much hotter than the standard disk. If this is the case, NGC 1313 X-1 must be radiating at super-Eddington rates (). Its bolometric luminosity, estimated using the BB+cutoff PL model for the 2003 December observation, implies a BH mass in the range of . A natural consequence of the slim disk model is that the soft excess emission can be produced in the optically thick winds resulting from the super-critical accretion rates as discussed above (Mukai et al. 2003; King & Pounds 2003).
References
- Gierliński & Done (2004) Gierliński, M., & Done, C. 2004, MNRAS, 349, L7
- Hickox et al. (2004) Hickox, R. C., Narayan, R., & Kallman, T. R. 2004, ApJ, 614, 881
- Abramowicz et al. (1988) Abramowicz, M. A., Czerny, B., Lasota, J. P., & Szuszkiewicz, E. 1988, ApJ, 332, 646
- Colbert & Mushotzky (1999) Colbert, E. J. M. & Mushotzky, R. F. 1999, ApJ, 519, 89 (CM99)
- Cropper et al. (2004) Cropper, M., Soria, R., Mushotzky, R. F., Wu, K., Markwardt, C. B., & Pakull, M. 2004, MNRAS, 349, 39
- Dewangan et al. (2004) Dewangan, G. C., Miyaji, T., Griffiths, R. E., & Lehmann, I. 2004, ApJ, 608, L57
- Ebisawa et al. (2003) Ebisawa, K., Życki, P., Kubota, A., Mizuno, T., & Watarai, K.-y. 2003, ApJ, 597, 780
- Fabbiano (1989) Fabbiano, G. 1989, ARA&A, 27, 87
- Kawaguchi (2003) Kawaguchi, T. 2003, ApJ, 593, 69
- King & Pounds (2003) King, A. R., & Pounds, K. A. 2003, MNRAS, 345, 657
- Makishima et al. (2000) Makishima, K., et al. 2000, ApJ, 535, 632
- Martocchia et al. (2005) Martocchia, A., Matt, G., Belloni, T., Feroci, M., Karas, V., & Ponti, G. 2005, ArXiv Astrophysics e-prints, arXiv:astro-ph/0510651
- Matsumoto et al. (2001) Matsumoto, H., Tsuru, T. G., Koyama, K., Awaki, H., Canizares, C. R., Kawai, N., Matsushita, S., & Kawabe, R. 2001, ApJ, 547, L25
- McClintock & Remillard (2003) McClintock, J. E., & Remillard, R. A. 2003, ArXiv Astrophysics e-prints, arXiv:astro-ph/0306213
- Miller, Fabbiano, Miller, & Fabian (2003) Miller, J. M., Fabbiano, G., Miller, M. C., & Fabian, A. C. 2003b, ApJ, 585, L37
- Miller & Colbert (2004) Miller, M. C., & Colbert, E. J. M. 2004, International Journal of Modern Physics D, 13, 1
- Mizuno et al. (1999) Mizuno, T., Ohnishi, T., Kubota, A., Makishima, K., & Tashiro, M. 1999, PASJ, 51, 663
- Mukai et al. (2003) Mukai, K., Pence, W. D., Snowden, S. L., & Kuntz, K. D. 2003, ApJ, 582, 184
- Neilsen et al. (2004) Neilsen, J., Hickox, R. C., & Vrtilek, S. D. 2004, ApJ, 616, L135
- Paul et al. (2002) Paul, B., Nagase, F., Endo, T., Dotani, T., Yokogawa, J., & Nishiuchi, M. 2002, ApJ, 579, 411
- Roberts et al. (2005) Roberts, T. P., Warwick, R. S., Ward, M. J., Goad, M. R., & Jenkins, L. P. 2005, MNRAS, 357, 1363
- Tully (1988) Tully, R. B., 1988, Nearby Galaxies Catalog (Cambridge: Cambridge Univ. Press)