A Catalog of MSX Infrared Dark Cloud Candidates
Abstract
We use 8.3 m mid-infrared images acquired with the Midcourse Space Experiment satellite to identify and catalog Infrared Dark Clouds (IRDCs) in the first and fourth quadrants of the Galactic plane. Because IRDCs are seen as dark extinction features against the diffuse Galactic infrared background, we identify them by first determining a model background from the 8.3 m images and then searching for regions of high decremental contrast with respect to this background. IRDC candidates in our catalog are defined by contiguous regions bounded by closed contours of a decremental contrast threshold. Although most of the identified IRDCs are actual cold, dark clouds, some as yet unknown fraction may be spurious identifications. For large, high contrast clouds, we estimate the reliability to be 82%. Low contrast clouds should have lower reliabilities. Verification of the reality of individual clouds will require additional data. We identify 10,931 candidate infrared dark clouds. For each IRDC, we also catalog cores. These cores, defined as localized regions with at least 40% higher extinction than the cloud’s average extinction, are found by iteratively fitting 2-dimensional elliptical Gaussians to the contrast peaks. We identify 12,774 cores. The catalog contains the position, angular size, orientation, area, peak contrast, peak contrast signal-to-noise, and integrated contrast of the candidate IRDCs and their cores. The distribution of IRDCs closely follows the Galactic diffuse mid-infrared background and peaks toward prominent star forming regions, spiral arm tangents, and the so-called 5 kpc Galactic molecular ring.
1 Introduction
Since the early identifications of optically dark regions (e.g., Barnard, 1919; Bok & Reilly, 1947; Lynds, 1962; Feitzinger & Stuewe, 1984), extinction apparent from stellar density fluctuations or against bright, diffuse background emission has been used to identify, catalog, and study interstellar clouds. In recent years, such studies have started to exploit increasingly higher angular resolutions and longer wavelengths. Since extinction is much smaller at infrared (IR) wavelengths compared to the optical, the distances out to which dark clouds can be detected, as well as the dynamic range in magnitudes of extinction, have become much larger. With the advent of large scale, multi-color IR surveys, such as the Two Micron All Sky Survey (2MASS; Skrutskie et al., 1997) and the Spitzer Galactic Legacy Infrared Mid-Plane Survey Extraordinaire (GLIMPSE; Benjamin et al., 2003), extinction studies have become even more sophisticated, combining number density fluctuations of stars with color information (e.g., Lada et al., 1994; Cambrésy et al., 2002).
Recent high resolution, high sensitivity IR surveys of the Galactic plane, performed with the Infrared Space Observatory (ISO; Pérault et al., 1996) and Midcourse Space Experiment (MSX; Egan et al., 1998) satellites have identified a new class of interstellar clouds, the Infrared Dark Clouds (IRDCs). IRDCs are clouds of high extinction ( mag at 8 m; Egan et al., 1998) seen in silhouette against the bright Galactic background at mid-IR wavelengths (Carey et al., 1998; Hennebelle et al., 2001).
Preliminary millimeter and submillimeter studies of a few IRDCs show they are dense ( cm-3), cold ( K), and have very high column densities (– cm-2; Egan et al., 1998; Carey et al., 1998, 2000). IRDCs are often completely opaque at wavelengths between 7 and 100 m (Carey et al., 1998; Teyssier et al., 2002). The low temperatures of IRDCs indicate that they lack the massive young stars that can be associated with dense molecular gas clouds. These properties make them excellent candidates to be in the earliest stages of star formation. Indeed, some evidence suggests ongoing, deeply embedded star formation in a few IRDCs (Redman et al., 2003; Ormel et al., 2005). Very recently, three massive protostars toward an IRDC have also been detected (Rathborne et al., 2005).
Despite their potential importance, little is known about the origin and Galactic distribution of IRDCs. In order to understand the role of IRDCs in star formation and the Galactic interstellar medium, it is important to identify and catalog a large, uniform sample. To produce such a catalog, a sensitive, high angular resolution mid-IR survey is necessary. The MSX Galactic Plane Survey (Price et al., 2001) provides the ideal dataset. Launched in 1996, the MSX SPIRIT III 33.7 cm telescope was used to survey the Galactic Plane at four mid-IR wavelengths centered on 8.3, 12.1, 14.7, and 21.3 m (Bands A, C, D, and E, respectively). The 8.3 m (Band A) data offer the best combination of angular resolution and sensitivity (20″, 1.3 MJy sr-1; Price et al., 2001), and are far superior to similar images obtained with IRAS (4′ 5′, 0.05 MJy sr-1 at 12 m). In addition, because the MSX 8.3 m filter contains emission from PAH molecules at 7.7 and 8.6 m, it has the brightest diffuse mid-IR background emission from the Galactic plane. IRDCs will thus be most easily detectable in this band.
An MSX IRDC catalog will be a valuable resource for finding candidate star forming clouds and cores in their early stages of evolution. However, because of the inherent difficulties in identifying extended structures, it must be understood that this catalog contains only candidate cores. It will, however, help to support a number of existing and planned IR surveys. For example, the study of IRDCs will form a key component of the GLIMPSE Spitzer Legacy project. Identification of a large sample of IRDCs will also allow follow-up, higher angular resolution studies by future space-based missions such as Herschel and the JWST, the airborne SOFIA telescope, and large ground-based IR telescopes such as the IRTF, Gemini, and Subaru. The MSX IRDC Catalog will provide the finding charts by which to characterize IRDCs and their embedded cores throughout the Galaxy.
2 Generating the IRDC Candidate Catalog
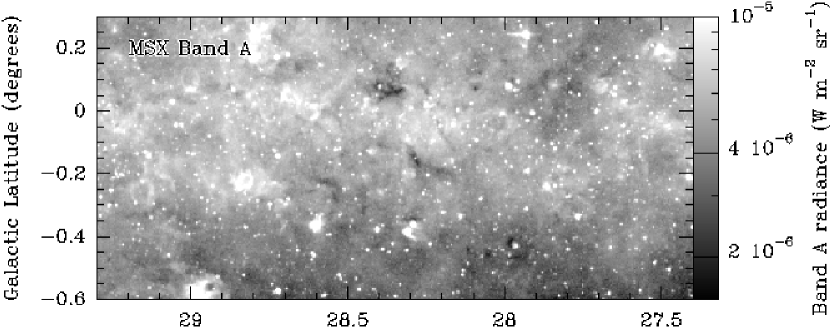
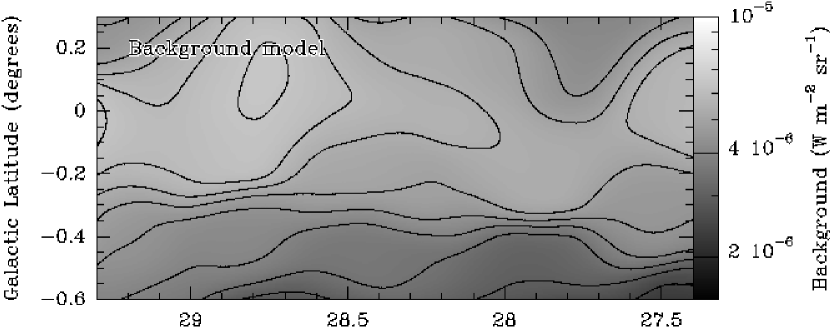
In this section, we outline our method for producing the catalog of IRDCs from the 8.3 m MSX images. Because IRDCs are revealed as extinction features, we define IRDCs as extended regions that show a significant decrement in the mid-IR background. In order to identify and catalog IRDCs, we have written an automated algorithm that selects IRDCs from the MSX Galactic Plane Survey. We used the MSX Band A plates available at the NASA/IPAC Infrared Science Archive (IRSA111IRSA is operated by the Jet Propulsion Laboratory, California Institute of Technology, under contract with the National Aeronautics and Space Administration. See http://irsa.ipac.caltech.edu.). Each image is a Cartesian projection about the Galactic Center and has 6″ pixels and 20″ angular resolution. From the original MSX images (1.5 by 1.5 degrees in size), we generated larger mosaics of 4.5 degree width in Galactic longitude and the full height of the MSX coverage in Galactic latitude ( degrees). Adjacent mosaics overlap by 1.5 degrees in longitude. Our IRDC identification algorithm contains three major steps: (1) modelling the diffuse IR background, (2) generating an image of decremental contrast against the background, and (3) identifying and selecting candidate IRDCs. The overall methodology described here is also illustrated in Fig. 1. Each of these steps is described in detail in the following sections.
2.1 Modelling the Diffuse IR Background
We assume that the 8.3 m images, apart from bright emission from small regions or point sources, consist of a diffuse, extended IR background against which the IRDCs are superposed. To model this background, we must retain only the slowly varying spatial components of the images. We have chosen the technique of spatial median filtering to generate our model background.
For each pixel, the diffuse background intensity is estimated by selecting the median value of the intensity distribution of all pixels inside a circular region centered on each pixel. The size of the circular region must be larger than the typical size of IRDCs; otherwise, the decrement due to the presence of an IRDC will be considered a fluctuation in the background. On the other hand, it must also be small enough to follow the real spatial fluctuations in the background.
Because typical sizes of IRDCs are smaller than (Carey et al., 2000), the filter should be larger than . On the other hand, because typical spatial variations in the Galactic plane 8 m background are typically larger than (estimated from cuts through the original MSX data parallel and perpendicular to the plane at various longitudes), the filter should also be no larger than . With these considerations in mind, we varied the filter size through a wide range of values, and finally selected a circular region with a radius of (150 pixels for the original 6″ MSX pixel size).
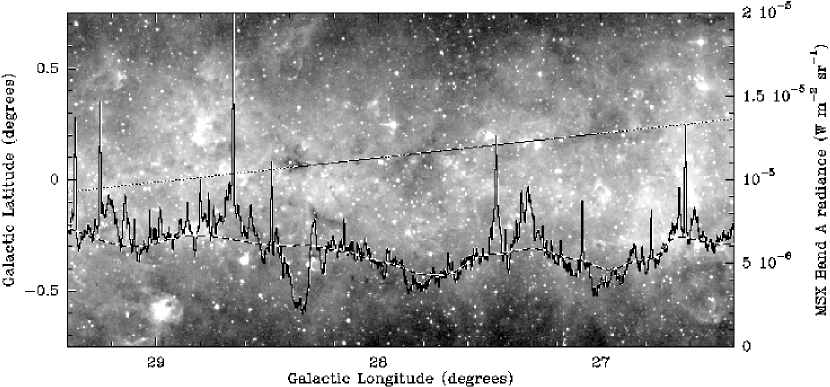
We tested the reliability of our background model by inspecting cuts in various directions over a wide range of longitudes. In the majority of cases for our choice of a radius circular spatial filter, the modelled background intensity very closely follows the variation in the MSX images and appears to yield a satisfactory background estimate. Fig. 1 shows an original MSX 8.3 m image and the corresponding model background for a typical field. In addition, Fig. 2 shows a plot of the background model superposed on the original image data for a cut through a larger field.
2.2 The Contrast Image
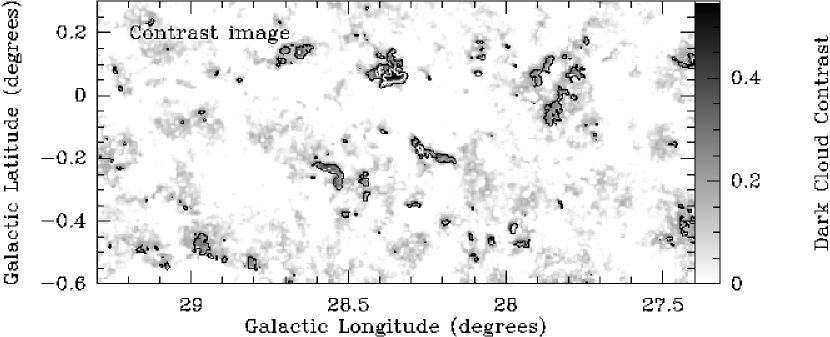
Once the diffuse background is estimated, we then generate an image of the decremental contrast against that background. In order to enhance brightness sensitivity and suppress spurious detections in the noisier (relative to the background) low background, higher latitude regions, we first convolved the MSX images with a 20″ Gaussian. The resulting images thus have an effective angular resolution of 28″. The smoothed 8.3 m image is then subtracted from the diffuse background image, and then divided by the background image, to produce the ‘contrast’ image: Contrast=(Background–Image)/Background. With this definition, regions that reveal a decrement against the diffuse background will have a positive contrast. The lower panel of Fig. 1 shows a contrast image calculated from the data and background (top and middle panel). All regions showing obvious extinction in the MSX image are clearly identified as high contrast features, in particular the IR dark cloud at 35, whose contrast of is among the highest values found in the Galactic plane.
2.3 IRDC Candidate Identification
We then examine the contrast image to select IRDCs. We require that IRDCs be isolated from one another, continuous, and extended. Using a method of closed-contour identification, we identify IRDCs as regions which contain contiguous pixels above a certain contrast threshold and angular size (using algorithms developed using the data reduction package graphic222Part of the gildas software package maintained by IRAM/Grenoble).
All IRDC candidates must meet the following two criteria to be included in the catalog. First, the contrast values for the contiguous regions must be large enough to be real, and not the result of instrumental noise. The uncertainty in the contrast for each pixel was calculated using the rms noise fluctuations in the MSX images in regions without obvious emission away from the plane ( W m-2 sr-1 for the smoothed, 28″ resolution, images). We identify as candidate IRDCs only those regions whose contrasts are at least twice the error () estimated for each of the contiguous pixels. Second, the IRDCs must be extended in order to avoid identification of very small features, which may be artefacts due to noisy pixels in the MSX images. Consequently, we require that IRDCs have an equivalent area, defined by the area enclosed by 10% of the peak contrast level, to be larger than twice the convolved 28″ FWHM beam solid angle, square arcsec. In practice, we retain only those sources with 36 or more contiguous pixels (1,296 square arcsec).
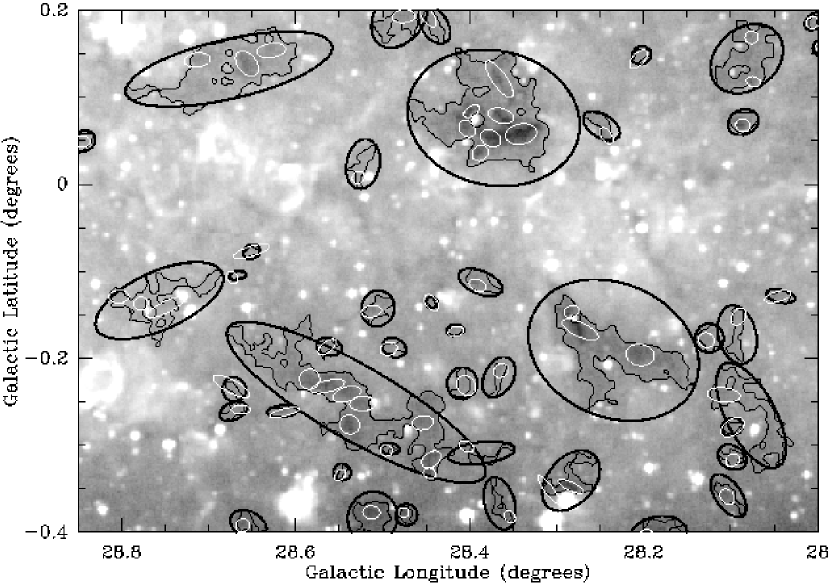
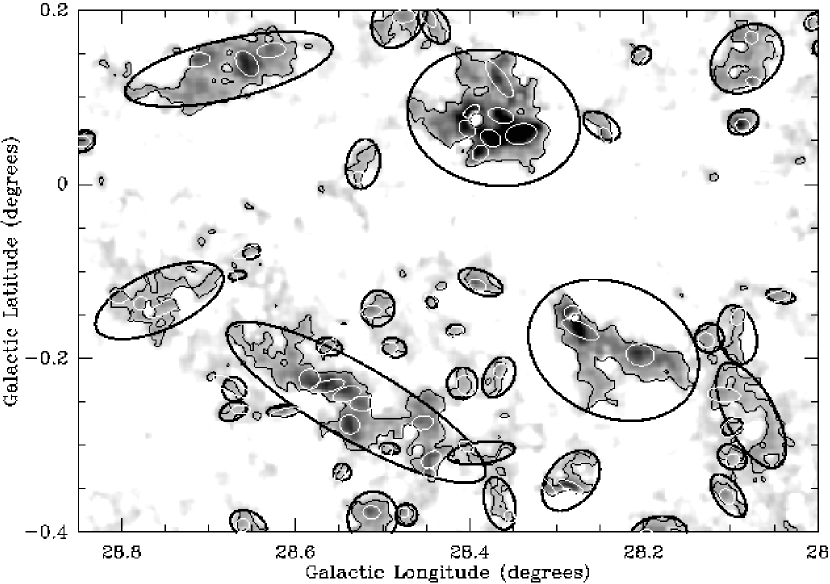
The 10,931 sources thus identified comprise the candidate clouds in our MSX IRDC catalog. Fig. 3 shows several of the clouds (marked as black ellipses) identified toward a subset of the region in the Galactic plane shown in Fig. 1 and 2 superposed on the original 8.3 m data (top panel) and on the contrast image (bottom panel).
It is possible that the catalog contains spurious identifications of dark patches due to holes in the 8 µm emission. Such misidentifications can only be revealed by a careful cross-correlation of the catalog members with emission tracing cold molecular gas, namely molecular line or millimeter/submillimeter continuum observations. The reliability, including validation of a sample of clouds in the catalog, is discussed in Section 2.5.
2.4 Cores
In many cases, individual IRDC candidates show considerable substructure in their contrast images. Since the distinct mid-IR extinction peaks probably represent column density peaks, and hence candidate star-forming cores, their positions, sizes, and contrasts are of potential interest. Moreover, different dark cores apparently of the same dark cloud are not necessarily at the same distance, but may be two distinct cores at different distances along the same line of sight. This presumption is confirmed for a few high contrast IRDCs from our catalog, where, for some cores of the same cloud, we found significantly different molecular line radial velocities (Simon et al., submitted) in J=10 Galactic Ring Survey data (GRS, Simon et al., 2001).
To decompose the clouds into cores we use two-dimensional elliptical Gaussian fits to the contrast images and fit at least one core to each cloud starting with the peak contrast. For this first core, the contrast value and the center position of the Gaussian are fixed to the peak contrast and its position. The sizes and orientations of the Gaussian ellipses are free fit parameters.
After subtracting the fit result from the original contrast image, the new peak contrast and its position in the residual image are determined. If the residual peak contrast is at least 40% larger than the cloud’s average contrast (integrated contrast/area), we fit another core. This procedure was iterated until the residual peak contrast falls below the 40% cutoff. After some experimentation with the cutoff value, we selected the value of 40% to find cores that would be identified by eye, and to exclude fluctuations in the complicated cloud structure. Fig. 3 also shows the cores (marked as white ellipses) identified within the clouds for a small region in the Galactic plane.
The purpose of cataloging the cores is to provide the locations and approximate extents of the compact highest contrast regions within IRDCs. Preliminary results suggest that IRDCs contain real cores that are potentially sites of star formation (Redman et al., 2003; Ormel et al., 2005; Rathborne et al., 2005). Moreover, although the IRDC position is listed by the contrast centroid, the first core position for each cloud lists the contrast peak. To locate the most probable site of current or future star formation, the position of peak contrast is clearly of interest. Because the larger high contrast clouds usually have more than one contrast peak, some sort of decomposition of the contrast distribution is required in order to identify potentially interesting cores in the catalog.
Although the actual cloud and core morphologies are usually complicated, nevertheless a simple Gaussian decomposition of the highest contrast clump is usually sufficient to determine positions and approximate sizes. As can be seen in Fig. 3, the fitted cores are typically well within the boundaries of the dark clouds and the positions of the contrast enhancements are well defined [see, e.g., the IRDC at (l,b)=(28.35,0.05) in the lower panel]. The orientation and sizes of the cores, however, are sometimes not well fitted, in particular close to foreground stars visible as holes in the contrast image [see, e.g., the IRDC at (l,b)=(28.2,–0.2) in Fig.3].
2.5 IRDC Reliability
Given the intrinsic difficulties in identifying regions of contrast against a highly variable background, our identification algorithm will miss some real IRDCs and also produce some spurious identifications. The spatial sizes of the detected IRDCs are further constrained by the finite resolution of MSX and by the chosen size of our spatial median filter. The algorithm also cannot distinguish voids in regions of complicated, bright emission from actual extinction features. It is also possible that adjacent IRDCs may be parts of the same object split by foreground emission or unveiled young stars. Unfortunately, given the very complicated morphologies of both the sources and the background, the reliability and completeness of the catalog is difficult to estimate. The best approach is to measure these empirically by verifying the reality of a candidate cloud via morphological matching of molecular line and millimeter/submillimeter continuum emission. Preliminary studies to do just that are underway. In the meantime, we caution the reader that the reality of specific, individual IRDC candidates will require confirmation. We assess the reliability of our catalog in the following sections.
2.5.1 Size Scales
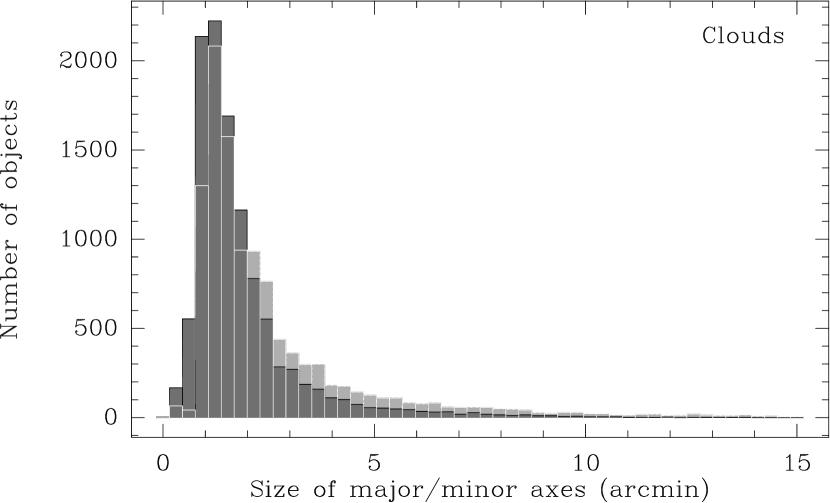
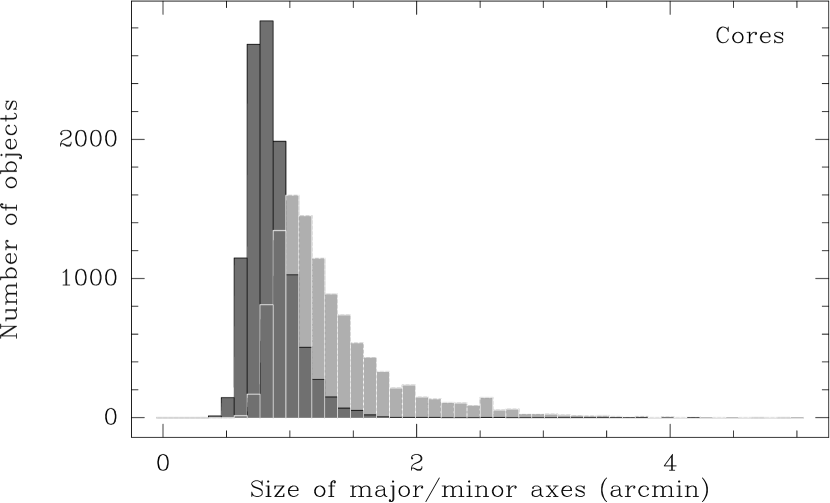
The minimum and maximum sizes of clouds and cores detectable by our algorithm are governed by the median filtering circle on the large scales and the angular resolution in the MSX images after smoothing on the small scales. These angular scales are clearly reflected in the cloud and core statistics shown in Fig. 4.
Typical cloud sizes are 1′ to 5′. We do not detect clouds that are 75. Although our algorithm may miss clouds 05 (i.e., the diameter of our filter), visual inspection of the MSX images suggests that no obvious IRDCs have escaped detection due to their large size.
Typical core sizes are 075 to 2′ and the minimum detected size corresponds to the 28″ angular resolution of the MSX images after smoothing.
2.5.2 Source Validation
To validate a subsample of our IRDCs, we correlated our catalog with the source lists obtained from MSX (Egan et al., 1998; Carey et al., 1998, 2000) and ISO data (Hennebelle et al., 2001; Teyssier et al., 2002).
Out of the combined MSX lists containing 14 entries, we detect all IRDCs except the cloud at (l,b)=(79.34,0.33). We do not detect this cloud as it is located next to the very bright mid-IR emission associated with the radio continuum source DR15 (Downes & Rinehart, 1966) and also has two bright, presumably foreground, compact sources superposed on top. This combination causes the modelled background towards the dark cloud to be overestimated, which in turn lowers the contrast below our identification threshold.
The ISO lists of Hennebelle et al. (2001) and Teyssier et al. (2002) contain 6 and 13 dark cloud candidates (3 identical in both lists), respectively, extracted using a multi-scale wavelet analysis (Hennebelle et al., 2001). We detect all 6 from Hennebelle et al. (2001) and 7 out of 13 IRDCs listed in Teyssier et al. (2002). The six clouds our method misses have either very low contrast in the MSX images, are narrow, or small extinction features on top of a very bright background. We therefore conclude that we do not detect these clouds due to lower sensitivity, resolution (or a combination of the two), and strong gradients in the mid-IR emission in complex regions.
Another study to test the reliability of our catalog made use of J=10 data from the GRS (Simon et al., submitted). We identified a sample of 379 large, high-contrast clouds (sizes 1.53 and contrast 0.25) from our catalog that fell within the GRS survey region. If the morphology over a particular velocity range matched the mid-IR extinction, we concluded that the candidate IRDC is in fact real. Out of 379 sources, we established morphological matches with 312 clouds. This suggests that, at least for the large, high contrast clouds the reliability is close to 82%. The difficulties in identifying clouds are exacerbated at low contrast and low signal-to-noise. Therefore, we fully expect the lower contrast clouds to have a lower reliability. However, quantitatively assessing the reliability of the catalog as a function of contrast is beyond the scope of the present paper.
2.5.3 Spurious Identifications in Complex Emission Regions
Our algorithm may make spurious IRDC identifications, most often in bright emission regions with complex structure or at the borders of bright, diffuse emission. In such regions, almost always star-forming regions such as W51 or Cygnus X, gaps between bright structures or filaments may erroneously be identified as IRDC candidates. Indeed, of the 18% of the spurious identifications in the GRS region, most were found toward the bright, complex W51 region. The user should be particularly suspicious about the reality of IRDC candidates toward such regions.
2.5.4 Completeness
The completeness of the catalog is difficult to estimate. The detectability of dark clouds and the observed contrast values depend on a number of factors, including the instrumental noise level, the background intensity, and radiative transfer along the line of sight. Toward high latitude regions the 1 fluctuations, presumably the instrumental noise, is W m-2 sr-1. This is an upper limit to the noise as the MSX Galactic plane survey noise is a function of Galactic longitude and latitude. The data are slightly more sensitive toward the Galactic plane.
The background varies considerably from roughly W m-2 sr-1in the Galactic Plane to a maximum of W m-2 sr-1 toward the Galactic Center region. Although in principal we could detect totally opaque clouds with contrast of 1.0, we do not observe any clouds with such high contrast levels. This implies that IRDCs are either partially transparent or that the absorption gets filled in with foreground emission on the way to the observer. Considering that IRDCs are typically a few kpc away, the latter explanation appears to be more likely. Foreground emission would result in a lower observed contrast and may even cause intrinsically high contrast clouds to drop below our detection limit. The most straightforward method for finding the completeness and reliability of the catalog is by empirical studies using molecular line or millimeter/submillimeter continuum data.
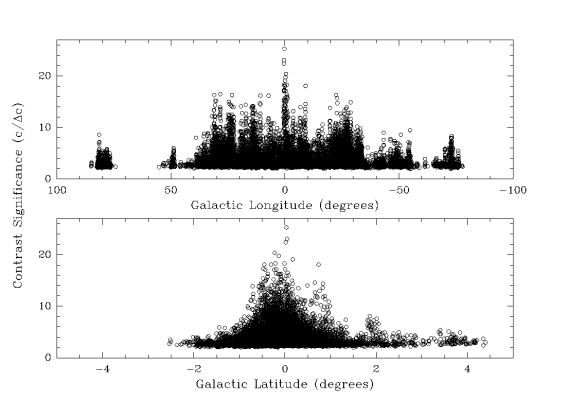
2.5.5 Contrast Significance
To give some estimate of the signal to noise or significance of an IRDC identification, we calculate the ratio of the peak contrast to its error (c/c). This was calculated at the center pixel for each of the cores identified. We do not calculate this for the clouds, as the position listed in the catalog is the contrast centroid and not the position of the peak contrast. The contrast error for a particular pixel was calculated by dividing the 1 noise in the images ( W m-2 sr-1) by the value of the modelled background in that pixel. Fig. 5 shows the contrast significance as a function of Galactic longitude and latitude.
3 Description of the Catalog
The catalog contains entries for each cloud and its associated cores. Table 1 gives a sample of the catalog entries. The complete catalog is available in electronic format at the website http://www.bu.edu/galacticring/msxirdc.
3.1 Clouds
For each IRDC identified, we list several parameters derived directly from the identification algorithm. For all derived parameters, we consider only pixels above the threshold. The columns of Table 1 are as follows: (1) the cloud name, designated as MSXDC (for MSX Dark Cloud) followed by the Galactic longitude and latitude (l and b) coordinates, e.g., MSXDC G045.33+00.65, (2) a descriptor that indicates whether the entry is a cloud or core. Clouds are denoted by a “0” in this field, and cores by a letter (a, b, c, etc), (3) and (4) the Galactic coordinates (l and b) in degrees, calculated as the centroid of the contrast distribution, (5) the length in arcmin of the major axis of the cloud, defined as twice the distance between the cloud’s contrast centroid and the most distant pixel from the centroid, (6) the length in arcmin of the cloud’s minor axis, defined as twice the distance between the cloud’s contrast centroid and the most distant pixel from the centroid along the axis perpendicular to the major axis, (7) the position angle in degrees east of north of the major axis, defined as the line connecting the cloud’s contrast centroid and the cloud’s most distant pixel from the centroid,(8) the total area of the cloud in square arcmin (area of the pixels above 2), (9) the peak contrast, (10) the ratio of the core’s peak contrast to its uncertainty (this is not calculated for clouds), and (11) the integrated contrast in square arcmin, defined as the sum of the contrast over all pixels above 2, times the area of the cloud.
Note that the cloud coordinates give the position of the contrast centroid and do not necessarily reflect the position of the contrast peaks (these are listed in the information for the cloud cores). As a result, the contrast centroid may not fall within the cloud boundary for some complex morphologies. Because the clouds have irregular shapes, we present the results in columns (3) to (7) merely to estimate a clouds’ approximate position, size, and orientation. Because the dark cloud contrast is roughly proportional to the column density, the integrated contrast given in column (11), just like the integrated intensity of an optically thin molecular line map, should be roughly proportional to the mass of the cloud.
3.2 Cores
The cores, or contrast peaks, were found by fitting elliptical Gaussians to the contrast image for each cloud. Every cloud has at least one core fitted at the peak contrast position, and larger clouds may contain additional cores. In the catalog, the cores are listed immediately after the entry for their associated cloud. The columns are as follows: (1) the name of the IRDC that contains the core, designated as MSXDC (for MSX Dark Cloud) followed by the Galactic coordinates, e.g., MSXDC G045.33+00.65, (2) a descriptor that indicates whether the entry is a cloud or core. Cores are designated by a letter (a, b, c, etc) in order of decreasing contrast, (3) and (4) the Galactic coordinates (l and b) in degrees of the core position, defined as the peak of the fitted elliptical Gaussian, (5) the length in arcmin of the major axis of the fitted ellipse, (6) the length in arcmin of the minor axis of the fitted ellipse, (7) the position angle in degrees east of north of the major axis of the fitted ellipse, (8) the total area of the core in square arcmin, (9) the peak contrast, (10) the ratio of the peak contrast to its uncertainty, and (11) the integrated contrast in square arcmin, defined as the integrated contrast of the elliptical Gaussian within the half power contour.
4 Ensemble Properties
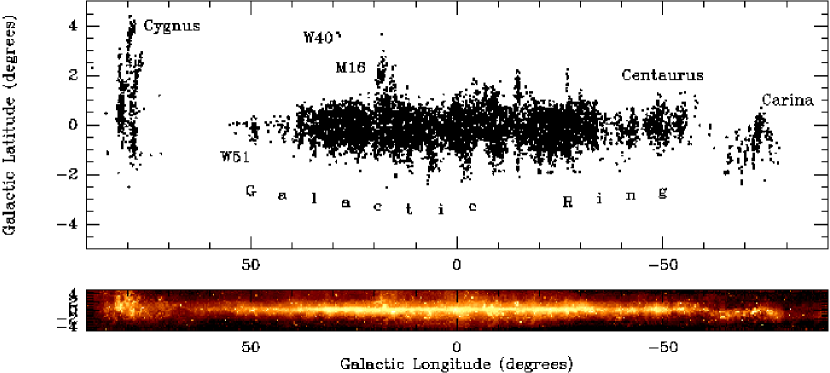
The Galactic distribution of the IRDCs is shown in Fig. 6. Not surprisingly, the IRDC distribution is well correlated with bright 8.3 µm emission from the Galactic plane. Because IRDCs are extinction features, they are easier to detect when the background emission is bright. In addition, since IRDCs may be associated with star forming regions, their number may be enhanced where the background is brightest. With the current data, it is difficult to distinguish between these two factors.
In detail, IRDCs are more numerous toward prominent IR-bright, star forming regions in the inner Galaxy such as the spiral arm tangents toward Cygnus (Orion arm) and W51 (Sagittarius arm) in the north, and Centaurus (Norma arm) and Carina (Scutum arm) in the south. IRDCs are also common toward the bright IR emission between Galactic longitudes to due to heated dust associated with the Galactic 5 kpc molecular Ring, the Milky Way’s dominant star forming structure (Robinson et al., 1984).
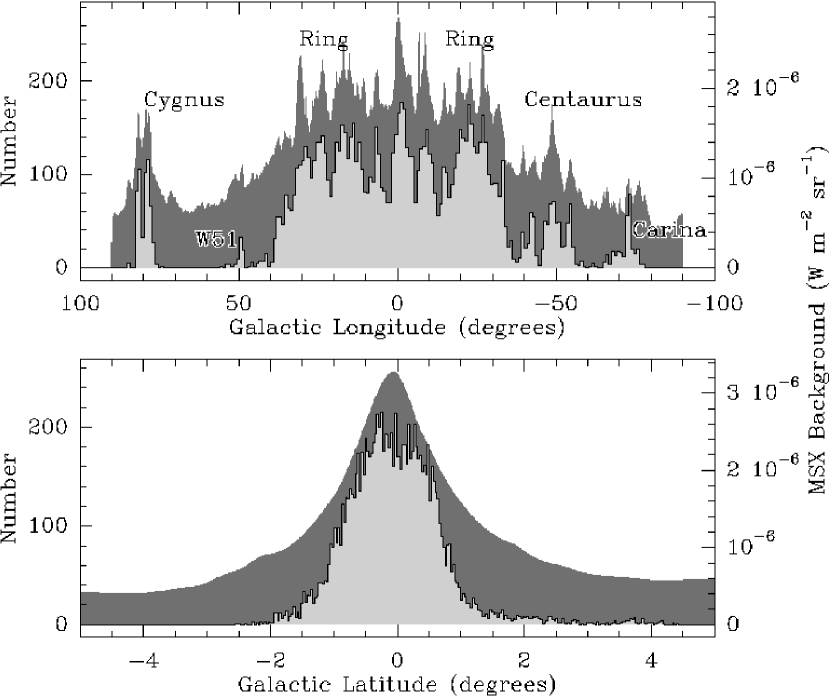
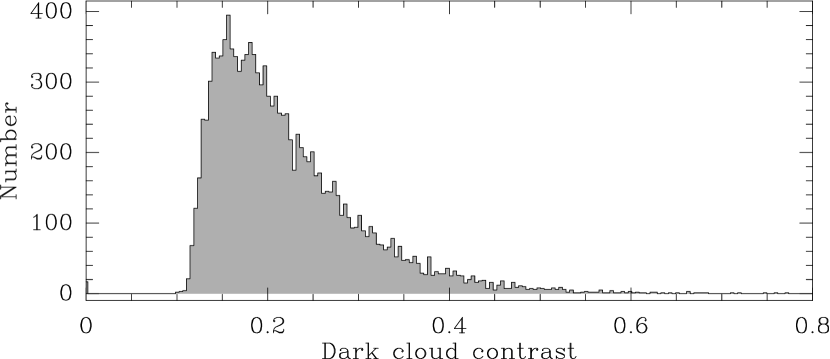
In Fig. 7 we plot histograms of the IRDC distribution as functions of Galactic longitude and latitude together with the variation in the modelled background intensity. Both distributions reflect the diffuse mid-IR background. The latitude distribution is approximately Gaussian with a FWHM of 2. Very few IRDCs are found beyond in Galactic latitude. In Fig. 8 we plot a histogram of the IRDC peak contrast. The distribution is approximately power law and sharply declines with increasing contrast. The turnover near a contrast of 0.1 reflects the sensitivity limit of the MSX data and our identification algorithm.
5 Summary
We present a catalog of candidate IRDCs in the Galactic plane spanning the range of Galactic longitudes to and latitudes to . We identified the clouds using algorithms which model the diffuse IR background via a median filter technique, generate images of decremental contrasts, and select IRDCs based on contiguous pixels above a contrast threshold. A further criterion is that the IRDCs must be extended, so that they cover a solid angle at least twice that of the 28′′ convolved beam solid angle. We have identified a total of 10,931 IRDCs.
Within each cloud, we have also identified embedded cores, or contrast peaks. For each cloud, we identify a core with the maximum contrast peak, and also include other cores if their contrasts are % of the IRDC’s average contrast. We identify 12,774 cores.
The Galactic distribution of IRDCs closely follows the mid-IR background emission, and the distribution of contrasts is approximately power-law. In the future, radio, millimeter, submmillimeter, and IR studies will yield the distances, sizes, masses, and other physical properties of IRDCs and their embedded cores, and establish their role in the process of star formation.
References
- Barnard (1919) Barnard, E. E. 1919, ApJ, 49, 1
- Benjamin et al. (2003) Benjamin, R. A., et al. 2003, PASP, 115, 953
- Bok & Reilly (1947) Bok, B. J., & Reilly, E. F. 1947, ApJ, 105, 255
- Cambrésy et al. (2002) Cambrésy, L., Beichman, C. A., Jarrett, T. H., & Cutri, R. M. 2002, AJ, 123, 2559
- Carey et al. (1998) Carey, S. J., Clark, F. O., Egan, M. P., Price, S. D., Shipman, R. F., & Kuchar, T. A. 1998, ApJ, 508, 721
- Carey et al. (2000) Carey, S. J., Feldman, P. A., Redman, R. O., Egan, M. P., MacLeod, J. M., & Price, S. D. 2000, ApJ, 543, L157
- Downes & Rinehart (1966) Downes, D., & Rinehart, R. 1966, ApJ, 144, 937
- Egan et al. (1998) Egan, M. P., Shipman, R. F., Price, S. D., Carey, S. J., Clark, F. O., & Cohen, M. 1998, ApJ, 494, L199
- Feitzinger & Stuewe (1984) Feitzinger, J. V., & Stuewe, J. A. 1984, A&AS, 58, 365
- Hennebelle et al. (2001) Hennebelle, P., Pérault, M., Teyssier, D., & Ganesh, S. 2001, A&A, 365, 598
- Lada et al. (1994) Lada, C. J., Lada, E. A., Clemens, D. P., & Bally, J. 1994, ApJ, 429, 694
- Lynds (1962) Lynds, B. T. 1962, ApJS, 7, 1
- Ormel et al. (2005) Ormel, C. W., Shipman, R. F., Ossenkopf, V., & Helmich, F. P. 2005, A&A, 439, 613
- Pérault et al. (1996) Pérault, M., et al. 1996, A&A, 315, L165
- Price et al. (2001) Price, S. D., Egan, M. P., Carey, S. J., Mizuno, D., & Kuchar, T. 2001, AJ, 121, 2819
- Rathborne et al. (2005) Rathborne, J. M., Jackson, J. M., Chambers, E. T., Simon, R., Shipman, R., & Frieswijk, W. 2005, ApJ, 630, L181
- Redman et al. (2003) Redman, R. O., Feldman, P. A., Wyrowski, F., Côté, S., Carey, S. J., & Egan, M. P. 2003, ApJ, 586, 1127
- Robinson et al. (1984) Robinson, B. J., Manchester, R. N., Whiteoak, J. B., Sanders, D. B., Scoville, N. Z., Clemens, D. P., McCutcheon, W. H., & Solomon, P. M. 1984, ApJ, 283, L31
- Simon et al. (2001) Simon, R., Jackson, J. M., Clemens, D. P., Bania, T. M., & Heyer, M. H. 2001, ApJ, 551, 747
- Skrutskie et al. (1997) Skrutskie, M. F., et al. 1997, in The Impact of Large Scale Near-IR Sky Surveys, ed. F. Garz on, N. Epchtein, A. Omont, B. Burton, & P. Persi (Kluwer, Dordrecht), 25
- Teyssier et al. (2002) Teyssier, D., Hennebelle, P., & Pérault, M. 2002, A&A, 382, 624
| Cloud name | Coordinates | Major | Minor | PA | Area | Contrast | ||||
|---|---|---|---|---|---|---|---|---|---|---|
| l | b | Peak | c/c | Integrated | ||||||
| (∘) | (∘) | (′) | (′) | (∘) | (arcmin2) | (arcmin2) | ||||
| (1) | (2) | (3) | (4) | (5) | (6) | (7) | (8) | (9) | (10) | (11) |
| MSXDC G000.00+00.65 | (0) | -0.005 | 0.659 | 2.9 | 2.0 | 155 | 1.92 | 0.20 | … | 0.27 |
| MSXDC G000.00+00.65 | (a) | -0.001 | 0.654 | 0.9 | 0.8 | 125 | 0.54 | 0.20 | 4.0 | 0.08 |
| MSXDC G000.0000.59 | (0) | -0.001 | -0.600 | 1.3 | 1.3 | 161 | 0.60 | 0.15 | … | 0.07 |
| MSXDC G000.0000.59 | (a) | -0.001 | -0.602 | 1.1 | 0.7 | 125 | 0.62 | 0.15 | 3.7 | 0.06 |
| MSXDC G000.0000.74 | (0) | 0.001 | -0.744 | 0.9 | 0.9 | 153 | 0.37 | 0.16 | … | 0.05 |
| MSXDC G000.0000.74 | (a) | 0.001 | -0.744 | 1.3 | 0.6 | 95 | 0.61 | 0.16 | 3.6 | 0.07 |
| MSXDC G000.0000.33 | (0) | 0.004 | -0.332 | 4.0 | 3.4 | 36 | 3.73 | 0.18 | … | 0.48 |
| MSXDC G000.0000.33 | (a) | 0.008 | -0.319 | 1.3 | 1.0 | 99 | 1.00 | 0.18 | 9.0 | 0.13 |
| MSXDC G000.0000.47 | (0) | 0.004 | -0.476 | 3.6 | 1.5 | 128 | 1.79 | 0.25 | … | 0.27 |
| MSXDC G000.0000.47 | (a) | -0.001 | -0.476 | 1.6 | 0.7 | 146 | 0.87 | 0.25 | 8.9 | 0.15 |
| MSXDC G000.0000.98 | (0) | 0.005 | -0.989 | 1.3 | 1.3 | 18 | 0.45 | 0.20 | … | 0.08 |
| MSXDC G000.0000.98 | (a) | 0.001 | -0.996 | 0.8 | 0.4 | 215 | 0.28 | 0.20 | 2.4 | 0.04 |
| MSXDC G000.0000.78 | (0) | 0.006 | -0.784 | 1.0 | 1.0 | 53 | 0.49 | 0.18 | … | 0.07 |
| MSXDC G000.0000.78 | (a) | 0.006 | -0.786 | 0.9 | 0.8 | 218 | 0.53 | 0.18 | 3.7 | 0.07 |
| MSXDC G000.01+00.63 | (0) | 0.015 | 0.636 | 1.0 | 1.0 | 168 | 0.67 | 0.13 | … | 0.08 |
| MSXDC G000.01+00.63 | (a) | 0.018 | 0.634 | 1.2 | 1.1 | 123 | 1.09 | 0.13 | 2.7 | 0.10 |
| MSXDC G000.02+00.57 | (0) | 0.021 | 0.577 | 3.8 | 3.8 | 47 | 4.71 | 0.16 | … | 0.61 |
| MSXDC G000.02+00.57 | (a) | 0.028 | 0.581 | 2.2 | 0.8 | 104 | 1.38 | 0.16 | 3.5 | 0.16 |
| MSXDC G000.0200.98 | (0) | 0.024 | -0.983 | 1.1 | 1.1 | 21 | 0.50 | 0.23 | … | 0.10 |
| MSXDC G000.0200.98 | (a) | 0.023 | -0.982 | 1.3 | 0.7 | 235 | 0.70 | 0.23 | 2.8 | 0.11 |
| MSXDC G000.0300.35 | (0) | 0.037 | -0.352 | 1.6 | 0.7 | 104 | 1.00 | 0.14 | … | 0.12 |
| MSXDC G000.0300.35 | (a) | 0.033 | -0.352 | 1.1 | 1.1 | 245 | 0.94 | 0.14 | 6.8 | 0.09 |
| MSXDC G000.0400.64 | (0) | 0.048 | -0.645 | 1.3 | 0.7 | 108 | 0.50 | 0.14 | … | 0.06 |
| MSXDC G000.0400.64 | (a) | 0.053 | -0.646 | 1.3 | 0.6 | 117 | 0.63 | 0.14 | 3.3 | 0.06 |
| MSXDC G000.0500.55 | (0) | 0.057 | -0.555 | 0.9 | 0.8 | 63 | 0.43 | 0.15 | … | 0.05 |
| MSXDC G000.0500.55 | (a) | 0.056 | -0.556 | 1.3 | 0.8 | 241 | 0.87 | 0.15 | 3.7 | 0.09 |
| MSXDC G000.0500.68 | (0) | 0.059 | -0.688 | 5.2 | 2.2 | 125 | 6.48 | 0.29 | … | 1.02 |
| MSXDC G000.0500.68 | (a) | 0.056 | -0.696 | 1.1 | 0.8 | 125 | 0.71 | 0.29 | 6.8 | 0.15 |
| MSXDC G000.0500.68 | (b) | 0.076 | -0.701 | 1.9 | 0.9 | 95 | 1.38 | 0.22 | 5.2 | 0.21 |
| MSXDC G000.06+00.21 | (0) | 0.060 | 0.216 | 3.2 | 1.8 | 71 | 2.32 | 0.22 | … | 0.34 |
| MSXDC G000.06+00.21 | (a) | 0.056 | 0.213 | 1.1 | 0.8 | 246 | 0.70 | 0.22 | 7.9 | 0.11 |
| MSXDC G000.0600.77 | (0) | 0.065 | -0.779 | 8.0 | 6.6 | 121 | 17.74 | 0.24 | … | 2.61 |
| MSXDC G000.0600.77 | (a) | 0.101 | -0.782 | 1.5 | 0.9 | 217 | 1.08 | 0.24 | 5.4 | 0.18 |
| MSXDC G000.0600.77 | (b) | 0.074 | -0.772 | 1.5 | 1.0 | 260 | 1.17 | 0.21 | 4.7 | 0.17 |
| MSXDC G000.07+00.24 | (0) | 0.077 | 0.243 | 1.3 | 0.8 | 108 | 0.62 | 0.16 | … | 0.08 |
| MSXDC G000.07+00.24 | (a) | 0.074 | 0.244 | 1.0 | 0.7 | 185 | 0.50 | 0.16 | 5.6 | 0.06 |