New XMM-Newton Spectroscopy of the Most Luminous and Distant Quasars
Abstract
In the two parts of this contribution we describe two related XMM-Newton programs. The first part summarizes our study of the X-ray spectral properties and variability of z4 quasars (Shemmer et al. 2005). The second part presents preliminary results from our ongoing XMM-Newton program to investigate the X-ray spectral properties and variability of luminous, high accretion-rate quasars at z2–3. We find that the X-ray photon index does not depend on luminosity or redshift, and there is suggestive evidence that it may depend on the accretion rate. None of our quasars is significantly absorbed, and none shows signatures of reflection. By jointly fitting high-quality spectra of eight radio-quiet z4 quasars, including three from our XMM-Newton observations, we place tight constraints on the mean X-ray spectral properties of such sources. Most of our quasars are significantly X-ray variable on timescales of months–years, but none shows rapid (1 hr timescale) variations.
1 XMM-Newton Spectroscopy of z4 Quasars
1.1 Introduction
Quasars at z4 are valuable cosmological probes of the physical environment in the 1 Gyr old Universe. In particular, the most distant quasars known, at z6, have enabled tracing of the physical conditions in the Universe at the end of the re-ionization epoch with implications for large-scale structure formation (e.g., Fan et al. 2002). The study of z4 quasars therefore has become one of the main themes in astrophysics during the past few years. One of the lines of research in this field is to determine whether the energy production mechanism of quasars is sensitive to the significant large-scale evolution the Universe has experienced over cosmic time. A central question in this context is whether black holes (BHs) in distant quasars feed and grow in the same way as BHs in local active galactic nuclei (AGN). Recent radio–optical observations of z4 quasars have found that their spectral energy distributions (SEDs) are not significantly different from those of lower redshift sources implying no SED evolution, and hence no significant changes in the energy production mechanism of AGN are observed (e.g., see Carilli et al. 2001 and Petric et al. 2003 for radio observations; Vanden Berk et al. 2001 and Pentericci et al. 2003 for UV–optical observations).
X-rays from distant quasars are especially valuable for studying the energy production mechanism, since they provide information on the innermost regions of the central engine, where most of the nuclear energy is produced. Until fairly recently, only a handful of z4 quasars were detected in X-rays, and the data only provided basic X-ray photometry. During the past five years over 100 quasars have been detected by Chandra and XMM-Newton, allowing reliable measurements of their mean X-ray spectral properties (e.g., Brandt et al. 2002; Bechtold et al. 2003; Grupe et al. 2004, 2006; Vignali et al. 2003a,b, 2005). However, the different X-ray studies of z4 quasars often led to conflicting conclusions. For example, while Bechtold et al. (2003) reported that the X-ray power-law photon indices () of z4 quasars are flatter than those of nearby AGNs, Grupe et al. (2006) reported that their are rather steep; Vignali et al. (2005) found that does not undergo significant evolution and is not luminosity dependent.
The different conclusions, frequently based upon the same X-ray data, were reached mainly due to the small number of photons collected in the observations that were intended to detect z4 quasars; this led to large uncertainties in the basic X-ray spectral properties and hence to several possible interpretations. This motivated us and other authors to solve the puzzle and obtain high-quality X-ray spectra of several X-ray bright z4 quasars. High-quality X-ray spectra (with 500 [100] photons obtained by XMM-Newton [Chandra]) are currently available for 10 z4 radio-quiet and radio-moderate quasars (Ferrero & Brinkmann 2003; Farrah et al. 2004; Grupe et al. 2004, 2006; Schwartz & Virani 2004; Shemmer et al. 2005, hereafter S05). Below we summarize the results of the recent set of five of those spectra, which are described in detail in S05.
1.2 High-Quality Spectra of z4 Quasars
We obtained high-quality XMM-Newton spectra of five z4 quasars
during XMM-Newton AO3; the detailed data-reduction and analysis procedures
are described in S05. Each quasar was previously detected in
Chandra snapshot observations (Vignali et al. 2001, 2003a,b). The basic
properties of the quasars, as well as their measured
X-ray properties, are given in Table 1. Three of the
quasars are radio-quiet, one quasar, PSS 01210347, is radio loud
(=300; Vignali et al. 2003a), and another quasar, SDSS 02100018, is
radio moderate (=80; Vignali et al. 2001) following the radio-loudness
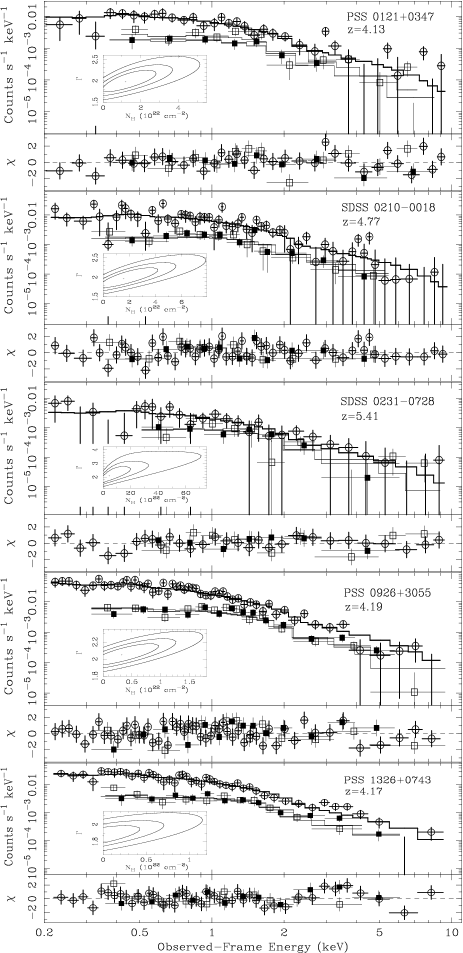
definition of Kellermann et al. (1989). We detected 500–1500
photons from each quasar in a net exposure time of 20–30 ks per
source. These exposures enabled accurate measurements of
(with =0.15) and upper limits on the intrinsic neutral
column densities for each quasar. The XMM-Newton data, best-fit spectra,
and residuals appear in Fig. 1. In
Fig. 1 we also plot confidence contours in the
– plane for each quasar.
| b | a | |||||
|---|---|---|---|---|---|---|
| Quasar | a | (1022 cm-2) | (erg s-1) | |||
| PSS 01210347 | 4.13 | 28.3 | 45.5 | |||
| SDSS 02100018 | 4.77 | 27.7 | 45.3 | |||
| SDSS 02310728 | 5.41 | 27.9 | 45.2 | |||
| PSS 09263055 | 4.19 | 30.1 | 45.9 | |||
| PSS 13260743 | 4.17 | 29.6 | 45.7 |
aLuminosity distances were computed using the standard “concordance” cosmological parameters =0.7, =0.3, and =70 km s-1 Mpc-1.
bNeutral intrinsic column density.
To extend our analysis, we added to our sample high-quality X-ray spectra of five additional z4 radio-quiet quasars (RQQs) from the archive; these are Q 0000263 (Ferrero & Brinkmann 2003), SDSS 10300524 (Farrah et al. 2004), BR 03511034 and BR 22370607 (Grupe et al. 2004, 2006), from XMM-Newton observations, and SDSS 13060356 which was observed with Chandra (Schwartz & Virani 2004). The spectra of all 10 z4 quasars were reduced and analyzed uniformly to obtain the basic X-ray spectral properties for each source.
1.3 X-ray Spectral Properties of z4 Radio-Quiet Quasars
The best-fit X-ray spectral properties for our sources appear in Table 1. The photon indices and the upper limits on the neutral intrinsic absorption in each quasar were obtained by fitting the spectra with intrinsically (redshifted) absorbed power-law models, including Galactic absorption. The constraints we obtained on the intrinsic absorption in each quasar (Table 1) show that our z4 RQQs are not significantly absorbed. In Fig. 2 we plot (above 2 keV in the rest-frame) for samples of radio-quiet AGN, including our expanded sample of z4 quasars, against optical luminosity and redshift. We find that takes a typical value of 1.9, and it does not depend significantly on either optical luminosity or redshift. We also note that there is no significant intrinsic dispersion in values within our sample of eight z4 RQQs.
We have also computed optical–X-ray spectral slopes (, e.g., Tananbaum et al. 1979; see Table 1) for our sources and found that our measurements are consistent with the Strateva et al. (2005) and Steffen et al. (2006) conclusions that strongly correlates with ultraviolet luminosity and does not evolve over cosmic time (out to z6).
To obtain the mean X-ray spectral properties of the RQQ population at z4, we fitted jointly our new XMM-Newton spectra of three RQQs and the five archival high-quality spectra of z4 RQQs with several models; this is roughly equivalent to fitting a single mean spectrum composed of 7000 photons. The number of photons in our combined spectrum is larger by an order of magnitude than the number of photons previously used in such analyses (e.g., Vignali et al. 2005). By fitting the spectra jointly we obtained a mean photon index =1.97. We also obtained the strongest constraint to date on the mean neutral intrinsic column density in such sources, 31021 cm-2 (Fig. 3), showing that optically selected RQQs at z4 are, on average, not more absorbed than their lower-redshift counterparts. All this suggests that the X-ray production mechanism and the central environment in radio-quiet AGN have not significantly evolved over cosmic time. We also used the combined spectrum to constrain the mean equivalent width of a putative neutral narrow Fe K line to 190 eV, and similarly to constrain the mean Compton-reflection component to 1.2; these constraints are consistent with the expected strength of a reflection component given the high luminosities of our sources (e.g., Page et al. 2004).

1.4 X-ray Variability of z4 Radio-Quiet Quasars
We applied Kolmogorov-Smirnov tests to the photon arrival times in our new XMM-Newton observations to search for rapid (1 hr timescale in the rest frame) variations, but none was detected.
To look for long-term (months–years) X-ray variations in our sample, we compared the fluxes of our sources in the observed-frame 0.5–2 keV band in the first epoch (Chandra snapshot observations) with those in the second epoch (XMM-Newton or Chandra observations). Seven z4 quasars from this study have high-quality (i.e., Chandra or XMM-Newton data to minimize cross-calibration uncertainties) two-epoch X-ray data for our comparison. Using statistics, we found that five of the seven quasars varied significantly between the two epochs (Fig. 4); the two sources that did not vary significantly between the two epochs are PSS 13260743 and SDSS 10300524.
While most quasars varied by no more than a factor of 2 between the two epochs, one source, SDSS 02310728, faded by a factor of 4 between the first observation (Chandra) and the second one (XMM-Newton). This flux change occurred over a rest-frame period of 73 d. This is the largest change in X-ray flux observed for a z4 RQQ. Given the UV–optical flux of the source, and using the Strateva et al. (2005) relation between UV luminosity and , it is likely that this source was caught in an X-ray high state in the first epoch (Vignali et al. 2003b), since its X-ray flux in the second epoch (S05) agrees with the value predicted from its optical flux (assuming the optical flux is nearly constant). Vignali et al. (2003b) also noted that SDSS 02310728 was X-ray brighter than expected (see their Fig. 5). The spectral slope of the source also shows a possible indication of flattening from =2.8 to =1.85 between the two epochs, but the significance is only 1 due to the limited number of counts (25) in the first Chandra snapshot observation. This is a tentative indication for a transition from a soft/high state to a hard/low state in this source, as has been seen for a few local AGN (e.g., Guainazzi et al. 1998; Maccarone et al. 2003).


2 XMM-Newton Spectroscopy of Luminous, High Accretion-Rate Quasars at Redshift 2–3
2.1 Is an Accretion Rate Indicator?
In § 1 we have shown that the X-ray photon index in RQQs appears to be constant, with a typical value of 1.9, regardless of redshift or luminosity. This result has also been confirmed and strengthened by other recent studies (e.g., Mateos et al. 2005; Page et al. 2005; Risaliti & Elvis 2005). However, inspection of Fig. 2 shows considerable scatter in , in particular at low redshifts (z0.5). This scatter may be attributed to a fundamental physical parameter, which controls the X-ray spectral shape in AGN.
Boller et al. (1996) have found that the soft (ROSAT band) X-ray power-law photon index is anti-correlated with FWHM(H), and hence narrow-line Seyfert 1 (NLS1s) galaxies (which meet the FWHM[H]2000 km s-1 criterion of Osterbrock & Pogge 1985) have significantly steeper X-ray spectral slopes than broad-line Seyfert 1 galaxies. This trend is observed in the hard (ASCA) X-ray band as well (e.g., Brandt et al. 1997; Leighly 1999). Strong correlations between FWHM(H) and the X-ray photon index in both the soft and hard bands are also exhibited by higher luminosity nearby (z0.5) quasars (e.g., Laor et al. 1997; Porquet et al. 2004).
Brandt & Boller (1998) and Laor (2000) have suggested that the strong –FWHM(H) correlation may be a consequence of a fundamental correlation between and the accretion rate, since FWHM(H) is considered to be an accretion-rate indicator in AGN (e.g., Boroson & Green 1992; Porquet et al. 2004). Such a correlation may be expected if the bulk of the emitted optical–X-ray energy is shifted into higher energies for higher accretion rates.
The use of FWHM(H) as an accretion-rate indicator relies on reverberation-mapping studies that found a strong correlation between the broad-line region (BLR) size and luminosity in AGN (e.g., Kaspi et al. 2000). By assuming Keplerian motion of the BLR gas around the central BH and using the BLR size–luminosity relation, the BH mass becomes [FWHM(H)]2, and the accretion rate (in terms of the Eddington ratio) is therefore [FWHM(H)]-2, where is the monochromatic luminosity at 5100Å, is the Eddington luminosity, and and are constants determined by reverberation mapping (e.g., Kaspi et al. 2000, 2005; see the specific equations in Shemmer et al. 2004, hereafter S04). FWHM(H) is perhaps the best accretion-rate indicator, and the use of other emission lines as proxies to H, such as C iv, can lead to spurious estimates of (e.g., Baskin & Laor 2005). NLS1s are the highest accretion-rate sources among low-luminosity AGN, with approaching, and in extreme cases even exceeding, unity.

2.2 X-ray Properties of Luminous, High Accretion Rate Quasars at High Redshift
The recent study of S04 has found that in at least two respects, accretion rate (determined from H) and metallicity, extremely luminous (L1047 erg s-1, where is the bolometric luminosity) quasars at 2z3.5 resemble NLS1s with L erg s-1. Motivated by this study, we have initiated an XMM-Newton program to look for unusual X-ray properties in the S04 quasars and to determine whether they are the luminous, high- analogs of local NLS1s (frequently termed narrow-line type 1 quasars). Specifically, we intend to measure accurately (to within 0.15) for these sources and to look for rapid (on a 1 hr rest-frame timescale) X-ray variations, since steep photon indices and rapid X-ray variations are two well-known NLS1 characteristics. The X-ray photon indices obtained for the S04 sources will allow us to test whether can be considered a reliable accretion-rate indicator for all AGN, including luminous, high- quasars, with important implications for accretion disk and corona models in AGN (e.g., Haardt & Maraschi 1993).
This test is portrayed in Fig. 5, where we have plotted versus FWHM(H) and (which is a combination of FWHM[H] and ). In this plot we consider archival data for AGN with high-quality X-ray spectra (obtained from Reeves et al. 1997; Reynolds 1997; George et al. 1998, 2000; Piconcelli et al. 2005) and with reliable FWHM(H) measurements. All but one of the sources in Fig. 5, Q 1346036, are AGN at z0.5 (and therefore have low–moderate luminosities), since at higher redshift H is not present in the optical band and near-IR measurements of FWHM(H) are difficult to obtain. Although there are significant correlations between and both FWHM(H) and for the nearby sources, the S04 quasars are predicted to have significantly different values of in each case. Based on their FWHM(H), these quasars are expected to have a mean of 1.7, but when their high accretion rates are considered, the mean expected is 2.2, which is only observed in extreme NLS1s. The first S04 quasar observed in our ongoing XMM-Newton program, Q 1346036, shows a moderately steep X-ray spectrum (see Fig. 6) and suggests that the – correlation may still hold when luminous, high- quasars are included (Fig. 5).

Acknowledgments
We wish to thank all of our collaborators who contributed to these projects: X. Fan, S. Kaspi, R. Maiolino, H. Netzer, G. T. Richards, D. P. Schneider, M. A. Strauss, and C. Vignali.
References
- Baskin & Laor (2005) Baskin, A., & Laor, A. 2005, MNRAS, 356, 1029
- Bechtold et al. (2003) Bechtold, J., et al. 2003, ApJ, 588, 119
- Boller et al. (1996) Boller, T., Brandt, W. N., & Fink, H. 1996, A&A, 305, 53
- Boroson & Green (1992) Boroson, T. A., & Green, R. F. 1992, ApJS, 80, 109
- Brandt et al. (1997) Brandt, W. N., Mathur, S., & Elvis, M. 1997, MNRAS, 285, L25
- Brandt & Boller (1998) Brandt, N., & Boller, T. 1998, Astronomische Nachrichten, 319, 163
- Brandt et al. (2002) Brandt, W. N., et al. 2002, ApJ, 569, L5
- Carilli et al. (2001) Carilli, C. L., et al. 2001, ApJ, 555, 625
- Fan et al. (2002) Fan, X., Narayanan, V. K., Strauss, M. A., White, R. L., Becker, R. H., Pentericci, L., & Rix, H. 2002, AJ, 123, 1247
- Farrah et al. (2004) Farrah, D., Priddey, R., Wilman, R., Haehnelt, M., & McMahon, R. 2004, ApJ, 611, L13
- Ferrero & Brinkmann (2003) Ferrero, E., & Brinkmann, W. 2003, A&A, 402, 465
- George et al. (1998) George, I. M., Turner, T. J., Netzer, H., Nandra, K., Mushotzky, R. F., & Yaqoob, T. 1998, ApJS, 114, 73
- George et al. (2000) George, I. M., Turner, T. J., Yaqoob, T., Netzer, H., Laor, A., Mushotzky, R. F., Nandra, K., & Takahashi, T. 2000, ApJ, 531, 52
- Grupe et al. (2004) Grupe, D., Mathur, S., Wilkes, B., & Elvis, M. 2004, AJ, 127, 1
- Grupe et al. (2006) Grupe, D., Mathur, S., Wilkes, B., & Osmer, P. 2006, AJ, in press (astro-ph/0501521)
- Guainazzi et al. (1998) Guainazzi, M., et al. 1998, A&A, 339, 327
- Haardt & Maraschi (1993) Haardt, F., & Maraschi, L. 1993, ApJ, 413, 507
- Kaspi et al. (2000) Kaspi, S., Brandt, W. N., & Schneider, D. P. 2000, AJ, 119, 2031
- Kaspi et al. (2005) Kaspi, S., Maoz, D., Netzer, H., Peterson, B. M., Vestergaard, M., & Jannuzi, B. T. 2005, ApJ, 629, 61
- Kellermann et al. (1989) Kellermann, K. I., Sramek, R., Schmidt, M., Shaffer, D. B., & Green, R. 1989, AJ, 98, 1195
- Laor et al. (1997) Laor, A., Fiore, F., Elvis, M., Wilkes, B. J., & McDowell, J. C. 1997, ApJ, 477, 93
- Laor (2000) Laor, A. 2000, New Astronomy Review, 44, 503
- Leighly (1999) Leighly, K. M. 1999, ApJS, 125, 317
- Maccarone et al. (2003) Maccarone, T. J., Gallo, E., & Fender, R. 2003, MNRAS, 345, L19
- Mateos et al. (2005) Mateos, S., et al. 2005, A&A, 433, 855
- Osterbrock & Pogge (1985) Osterbrock, D. E., & Pogge, R. W. 1985, ApJ, 297, 166
- Page et al. (2004) Page, K. L., O’Brien, P. T., Reeves, J. N., & Turner, M. J. L. 2004, MNRAS, 347, 316
- Page et al. (2005) Page, K. L., Reeves, J. N., O’Brien, P. T., & Turner, M. J. L. 2005, MNRAS, 898, in press (astro-ph/0508524)
- Pentericci et al. (2003) Pentericci, L., et al. 2003, A&A, 410, 75
- Petric et al. (2003) Petric, A. O., Carilli, C. L., Bertoldi, F., Fan, X., Cox, P., Strauss, M. A., Omont, A., & Schneider, D. P. 2003, AJ, 126, 15
- Piconcelli et al. (2005) Piconcelli, E., Jimenez-Bailón, E., Guainazzi, M., Schartel, N., Rodríguez-Pascual, P. M., & Santos-Lleó, M. 2005, A&A, 432, 15
- Porquet et al. (2004) Porquet, D., Reeves, J. N., O’Brien, P., & Brinkmann, W. 2004, A&A, 422, 85
- Reeves et al. (1997) Reeves, J. N., Turner, M. J. L., Ohashi, T., & Kii, T. 1997, MNRAS, 292, 468
- Reynolds (1997) Reynolds, C. S. 1997, MNRAS, 286, 513
- Risaliti & Elvis (2005) Risaliti, G., & Elvis, M. 2005, ApJ, 629, L17
- Schwartz & Virani (2004) Schwartz, D. A., & Virani, S. N. 2004, ApJ, 615, L21
- Shemmer et al. (2004) Shemmer, O., Netzer, H., Maiolino, R., Oliva, E., Croom, S., Corbett, E., & di Fabrizio, L. 2004, ApJ, 614, 547
- Shemmer et al. (2005) Shemmer, O., Brandt, W. N., Vignali, C., Schneider, D. P., Fan, X., Richards, G. T., & Strauss, M. A. 2005, ApJ, 630, 729
- Steffen et al. (2006) Steffen, A. T. et al. 2006, AJ, submitted
- Strateva et al. (2005) Strateva, I. V., Brandt, W. N., Schneider, D. P., Vanden Berk, D. G., & Vignali, C. 2005, AJ, 130, 387
- Tananbaum et al. (1979) Tananbaum, H., et al. 1979, ApJ, 234, L9
- Vanden Berk et al. (2001) Vanden Berk, D. E., et al. 2001, AJ, 122, 549
- Vignali et al. (2001) Vignali, C., Brandt, W. N., Fan, X., Gunn, J. E., Kaspi, S., Schneider, D. P., & Strauss, M. A. 2001, AJ, 122, 2143
- Vignali et al. (2003) Vignali, C., Brandt, W. N., Schneider, D. P., Garmire, G. P., & Kaspi, S. 2003a, AJ, 125, 418
- Vignali et al. (2003) Vignali, C., et al. 2003b, AJ, 125, 2876
- Vignali et al. (2005) Vignali, C., Brandt, W. N., Schneider, D. P., & Kaspi, S. 2005, AJ, 129, 2519