The Pisces-Cetus Supercluster: a remarkable filament of galaxies in the 2dF Galaxy Redshift Survey and Sloan Digital Sky surveys
Abstract
The Pisces-Cetus supercluster (redshift ) is one of the richest nearby () superclusters of galaxies, and emerges as a remarkable filament of galaxies at the edges of the two-degree-field galaxy redshift survey and the ongoing Sloan Digital Sky Survey. We explore the extent of the supercluster on the sky and in redshift space, and map the distribution of its constituent clusters and groups. We find evidence of enhanced star formation in galaxies belonging to groups in the supercluster compared to those in the field. This effect appears to be higher among the poorer groups than in the richer ones. In contrast, star formation is suppressed in the galaxies in rich clusters, which is consistent with previous studies. We identify two major filaments in this supercluster, consisting of 11 and 5 Abell clusters, including Abell 133 and Abell 85 respectively, and estimate the virial masses of the clusters from their velocity dispersions and optical surface brightness profiles. The lower limit to the masses of these filaments, amounting to the total virial mass of the constituent clusters, turns out to be and over volumes of almost Mpc3 and Mpc3 respectively. This corresponds to mass overdensities of and for the two filaments making up the supercluster.
keywords:
Galaxies: clusters: general; Galaxies: evolution; Cosmology: large-scale structure of the Universe; X-rays: galaxies: clusters.1 Introduction
Observations and simulations of the large-scale structure of the Universe have revealed the presence of a network of filaments and voids in which most galaxies seem to be found (Zucca et al., 1993; Einasto et al., 1994; Jenkins et al., 1998). This implies that that the Universe is not homogeneous on scales below Mpc (Bharadwaj, Bhavsar, & Sheth, 2004; Shandarin, Sheth, & Sahni, 2004), which is the scale of the largest common structures of galaxies, though the discovery of structures far larger than these have been claimed (e.g., Bagchi et al., 2002; Brand et al., 2003; Miller et al., 2004). Large-scale structures that are much larger than the virial radii of individual rich clusters ( Mpc) are often called superclusters of galaxies, even though this term has been used to denote various entities in the literature. We adopt this terminology in this paper.
Superclusters are the largest gravitationally bound systems in the Universe, though it is not clear to what scales this property extends. They are an essential tool to study the largest-scale density perturbations that have given rise to structure in the Universe (e.g., Bahcall, 2000). These are particularly interesting since they have always evolved in the linear regime and can be analytically tractable. Superclusters can be useful in quantifying the the high-end mass function of collapsing systems and ratio of mass to light on the largest scales, thus being useful in discriminating between dark matter and structure formation models (e.g., Kolokotronis, Basilakos, & Plionis, 2002; Bahcall, 1988).


Superclusters are expected to be predominantly filamentary structures. Numerical simulations of the evolution of large-scale structure (e.g., Bond, Kofman, & Pogosyan, 1996; Colberg, Krughoff, & Connolly, 2005), as well as the analyses of large-volume surveys like the 2dfGRS (e.g., Pimbblet, Drinkwater, & Hawkrigg, 2004) or studies of individual systems of superclusters (e.g., Bagchi et al., 2002; Ebeling, Barrett, & Donovan, 2004) show the pre-eminence of filamentary structures. Nevertheless, supercluster catalogues are usually constructed (e.g., Einasto et al., 1994; Zucca et al., 1993) using percolation or friends-of-friends algorithms which do not take this geometrical feature into consideration.
Recently, Raychaudhury et al. (in preparation) have compiled a catalogue of supercluster-size structures from a redshift survey of Abell clusters () using the minimal spanning tree statistic, which contains all the information used in a percolation analysis (Bhavsar & Splinter, 1996), and is particularly sensitive to filaments. In this catalogue, only one of the long filaments (containing 8 or more Abell clusters) is in the 2dF galaxy redshift survey (Colless et al., 2003) [2dFGRS] or Sloan Digital Sky Survey (Abazajian et al., 2005) [SDSS] regions. In fact, it straddles both of them.
More than a decade ago, in a series of papers, Tully (1986, 1987, 1988) pointed out the Pisces-Cetus supercluster to be one of the five richest systems of clusters of galaxies in the Universe, and speculated that it could be as large as Mpc across, and might include the Local Group. Subsequent work (e.g., Zucca et al., 1993; Einasto et al., 1994) has pointed out interesting features of significantly smaller substructures of this remarkable web of galaxies, groups and clusters, and at least one unusually large void (Burns et al., 1988).
In the supercluster catalogue of Raychaudhury et al. (in preparation), the Pisces-Cetus supercluster occupies a region of about 700 sq. deg. of the (equatorial) southern sky. While using the Minimal Spanning Tree (MST) in constructing this catalogue, if a maximum edge-length of Mpc is used, the system breaks up into two filaments (A, B) of 11 and 5 clusters respectively, at mean redshifts of 0.0625 and 0.0545 respectively. If, however, adjacent clusters on the tree are allowed to be separated by a distance of up to Mpc, the supercluster becomes a long filament of 19 clusters at a mean redshift of 0.0591, making the supercluster the third richest in the catalogue (following the Shapley and Horologium-Reticulum superclusters). This is illustrated in Fig. 1a, where the clusters excluded by the former consideration are shown to be connected to the main tree by dashed lines.
In this paper, we seek to characterise the extent of the supercluster in §2 from the 2dFGRS and SDSS surveys, and from the SuperCosmos Sky Survey (Hambly et al., 2001). In §3 we calculate mean velocities and velocity dispersions for the constituent clusters, while in §4 we look at evidence of enhanced star formation in galaxies belonging to groups along the filaments of the supercluster, as an indicator of galactic interaction in superclusters. In §5 we calculate virial masses of the constituent clusters based on their optical luminosity profiles and velocity dispersion, to estimate a lower limit to the mass overdensity in the supercluster. We summarise our major conclusions in §6. Detailed notes and X-ray images of the constituent clusters can be found in the Appendix. Throughout this paper we use km s-1 Mpc-1.
2 Clusters of galaxies belonging to the Pisces-Cetus Supercluster
The clusters comprising the Pisces-Cetus supercluster from the MST analysis of Raychaudhury et al. (in preparation) form the core of our sample, and are listed in Table 1. Unlike MST analyses of galaxy catalogues, where completeness is an important consideration, the supercluster list obtained in this catalogue is considered reasonably complete since it arises from an analysis of rich Abell clusters in the volume closer than (Galactic latitude ).
To the member list of the Pisces-Cetus Supercluster from the above list, We added a few clusters, in the same volume as the filament, from the Supplementary Abell cluster catalogue (Abell, Corwin, & Olowin, 1989) and the Edinburgh-Durham Southern Galaxy Cluster Catalogue (Lumsden et al., 1997). These extra clusters were taken as potential members of the supercluster if their redshift as derived in §3 was found to be consistent with the other members.

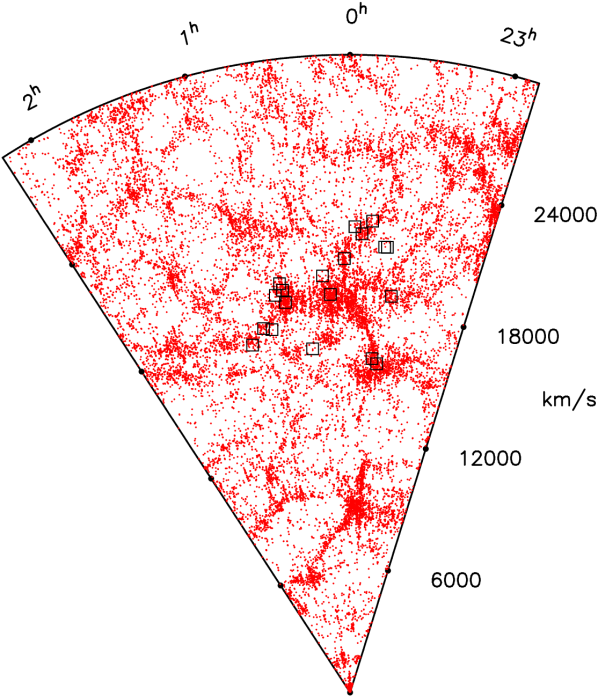
A plot of these clusters within the supercluster region and redshift range, including the connecting MST, can be seen in Fig. 1a. Also plotted are the groups of galaxies in the region of the supercluster covered by the 2dFGRS [] from the 2dFGRS Percolation-inferred Galaxy Group (2PIGG) catalogue (Eke et al., 2004), which are seen to follow a filamentary structure (though not necessarily the tree defined by the MST), as expected from numerical simulations where groups are seen to preferentially form on filaments and move along filaments to fall into clusters. For comparison, Fig. 1b shows all galaxies with spectroscopic redshifts from the SDSS and 2dFGRS catalogues, where only galaxies within 1000 of the upper and lower redshift bounds of the supercluster have been plotted. Overdensities of galaxies are clearly visible in the regions around the richer clusters and the filamentary structure of the supercluster is also visible.
Figs. 2 show the same galaxies, but using the redshift information described below. A combined look at Fig. 1 and Fig. 2 reveals that the supercluster is made of two main filaments. From Figs. 2a, which plots redshift against Right Ascension for the groups and clusters in the region, it is evident that the filament containing A85 is at a lower redshift than the longer filament, which has A133 at the near end and A2716 at the more distant end. The poorer clusters E0332 and S1155 appear to be in a clump separated from both of the main filaments, with a filament of groups joining these three clusters to the principal filament.
3 Spectroscopic data
Positions from the NASA/IPAC Extragalactic Database (NED) were taken as a starting point for the cluster centres, and then they were located on UK Schmidt Telescope (UKST) plates. The NED positions, particularly those from Abell, Corwin, & Olowin (1989), were largely inadequate. Therefore, centres were determined from available X-ray data whenever possible (see Appendix), and from a visual inspection of the appropriate UKST plates otherwise. Our adopted coordinates can be found in Table 1.
Redshifts were taken from all available sources including NED, ZCAT (http://cfa-www.harvard.edu/huchra/zcat/), the first data release of the 6dF Galaxy Survey Database (Jones et al., 2004) [6dFGS DR1], the 2dF galaxy redshift survey (Colless et al., 2003) and the second release (DR2) of the Sloan Digital Sky Survey (Abazajian et al., 2005). The galaxies were initially extracted from these catalogues within an Abell radius (2.14 Mpc) of the new cluster centres and filtered for repeated galaxies.
3.1 Mean redshift and velocity dispersion
Mean recessional velocities for clusters that have redshifts available for galaxies, within the Abell radius of 2.14 Mpc, were calculated from the compilation described above, using an iterative process clipping about the median, and finally calculating the mean. If galaxies with known redshift remained, the velocity dispersion of the cluster and its error were calculated, using a method that takes into account observational errors on individual redshift measures (Danese, de Zotti, & di Tullio, 1980). The resulting mean velocities, velocity dispersions and the number of cluster members used to calculate them can be found in Table 1 for each cluster belonging to the Pisces-Cetus supercluster.
Velocity histograms of each cluster can be seen in Fig. 3. Where more than a peak is obviously present, the velocity dispersion of the peak closest to the mean recessional velocity of the supercluster has been adopted. However, in some cases, membership remains ambiguous. For example, even though a large number of galaxies were found with measured redshifts within the Abell radius of A87, it is likely that a large fraction of them are in fact members of A85, since the centres of these two are only 2 Mpc apart.
Fig. 2b shows all the galaxies with redshifts from 2dFGRS and ZCAT in the declination range . The diagram shows clearly the filamentary nature of the supercluster and the positions of the Abell clusters on the filaments. There are some clusters not obviously associated with overdensities– these are in the declination range not covered by the 2dFGRS.

4 The influence of the supercluster environment on star formation in galaxies
Studies of the environmental effects on galaxy evolution in the past have shown that star formation is suppressed in the cores of rich clusters (Dressler, 1980; Couch & Sharples, 1987; Balogh et al., 1998). More recently, from the high-quality spectra of the 2dFGRS and SDSS archives, the difference between the properties of star-forming and quiescent galaxies have been further characterised, and shown to depend on the local density of galaxies. For instance, studies (Lewis et al., 2002; Gómez et al., 2003; Balogh et al., 2004) identifying star formation activity with the equivalent width of the emission line , show that the fraction of galaxies with Å steadily declines with increase in the three-dimensional density of galaxies. Kauffmann et al. (2004) show similar effects, with the star formation history being quantified from line indices measured elsewhere in the spectrum as well, including the absorption line and the strength of the break.
It is apparent from various other studies (e.g. Miles et al., 2004) that there is evidence for an enhanced rate of galaxy mergers in the not-so-high-density environments of groups, particularly in the poor ones, where the low velocity dispersion of galaxies favours tidal interaction in a dynamically sluggish system. This leads to, for instance, a depletion in the intermediate-mass galaxies as evident from bimodal luminosity functions. In such systems, we would expect the rate of merger-induced star formation to be enhanced with respect to the field, even though star formation is found to be quenched in high density environments typical of rich clusters.
Indeed, in the hierarchically merging scenario supported by large-volume numerical simulations such as Jenkins et al. (1998), much of this merger-driven evolution in the history of a galaxy is expected to occur in small groups forming in and falling along a supercluster filament towards regions of higher density. In contrast with the behaviour of galaxies in the field and among the highest densities in clusters, where one expects to find an abundance of quiescent galaxies, we would expect to find an increase in the fraction of galaxies with active star formation, induced by interaction, in the groups that belong to a supercluster filament. Here we investigate this effect by selecting a sample of galaxies that belong to groups belonging to the part of the Pisces-Cetus supercluster in the 2dFGRS volume, and comparing their properties with those of galaxies elsewhere.
4.1 Rate of star formation: the parameter
To investigate the variation in the rate of star formation rate with local environment, we used the spectral parameter , which is found from a principal components analysis (Madgwick et al., 2002) of the 2dFGRS spectra. Madgwick et al. (2003) found a tight correlation between and the equivalent width of the emission line, suggesting that is a measure of relative star formation. Here we will look at galaxies with , which corresponds to Å, so that we can assume that these galaxies have a significantly enhanced rate of star formation compared to the mass of the older stellar population.
4.2 Samples of galaxies in various environments
Seven samples of galaxies were complied from the 2dFGRS (Colless et al., 2003) catalogue, for which the values of parameter were extracted. These were:
- 1.
-
2.
NSC-PG: Same as above, but for poor 2PIGG groups that do not lie in superclusters (). This was achieved by omitting all galaxies within a liberal radius of all supercluster centres in the catalogue of Raychaudhury et al. (in preparation);
-
3.
SC-RG: Galaxies () belonging to rich 2PIGG groups, which have members, lying in the Pisces-Cetus supercluster region;
-
4.
NSC-RG: Same as above, but for groups not in superclusters (defined as in (ii));
-
5.
FIELD: All galaxies () in the 2PIGG catalogue not flagged as being a member of any group;
-
6.
SC-C: Galaxies () from Abell clusters that are part of the Pisces-Cetus supercluster, falling within the 2dFGRS region.
-
7.
NSC-C: Galaxies () belonging to Abell clusters in the 2dFGRS regions, with similar redshifts, but not belonging to any supercluster in the Raychaudhury et al. (in preparation) catalogue.

Since the rich “groups” and “clusters” are taken from different lists, some “cluster” galaxies would be included within the “rich group” samples, but this small number will be swamped by the much larger number of group galaxies.
Assuming that for a galaxy signifies evidence of enhanced star formation, we investigate the fraction of galaxies that have positive in the various group and cluster samples, and compare them with the galaxies in the field sample. In Fig. 4, we plot cumulative histograms of the fraction of galaxies with a value of between in each sample. The histograms are normalised by the total number of galaxies in each sample.
To find a formal measure of the difference between the histograms, we used both the familiar Kolmogorov-Smirnov (K-S) statistic and the Kuiper statistic (Press et al., 1992). Since we are looking for differences in our distributions in the high- tail, the Kuiper statistic would in principle fare better than the K-S statistic in quantifying differences.
It can be seen in Fig 4a that there is a marked difference, in the distribution of the parameter, between the group galaxies within and outside of the supercluster. For both poor and rich groups, galaxies in those that belong to the supercluster show evidence of enhanced star formation. For the SC-PG and FIELD samples, the K-S and Kuiper statistics indicate that the probability of the samples to be drawn from the same parent distribution is 0.01 and respectively. This would be consistent with the filamentary structure of the supercluster leading to an enhanced merger rate among galaxies belonging to the supercluster filament.
For both SC and NSC groups, galaxies in poorer groups seem to have the higher star formation rates. This would support evidence of more rapid merging within the poorer groups, which would have generally lower velocity dispersions, which would in turn encourage tidal interactions. This is in agreement with the difference found between the luminosity functions of galaxies by Miles et al. (2004) in X-ray bright and X-ray faint groups.
Even smaller probabilities are obtained when the SC-PG and SC-C samples, i.e. galaxies belonging to poor groups and to clusters in the supercluster, are compared. On the other hand, the difference between the SC-PG and SC-RG galaxies, however, is marginal, but possibly significant, the probability of being drawn from the same distribution is 0.53 and 0.1 according to the K-S and Kuiper statistics respectively.
It can be seen in Fig 4b that the cluster galaxies have a smaller percentage of their galaxies in the higher values than the field sample, implying star formation is suppressed in the cluster environment in agreement with Dressler (1980); Couch & Sharples (1987); Balogh et al. (1998). However, the cluster galaxies within the supercluster seem to have an even lower star formation rate than the cluster galaxies outside of the supercluster. This is the opposite trend to that found for the group galaxies.
5 Radial Profiles of Light
For all clusters belonging to the Pisces-Cetus supercluster, listed in Table 1, all galaxies within a radius of Mpc (equal to the Abell radius, defined as Mpc) of our adopted centres were extracted from the Reliable Galaxies catalogue of the SuperCosmos Science archive (Hambly et al., 2001). Galaxies were radially binned, with variable radius such that there was an equal number of galaxies () within each annulus. The luminosity per unit area in each annulus was then calculated to plot the surface brightness profiles, an example of which is shown in Fig. 5. A 10% error is shown associated with each point.
5.1 NFW Surface brightness profiles
The radial surface brightness profiles were fit, using minimisation, with the Navarro, Frenk & White (1996) (NFW) model for luminosity density
| (1) |
where is a characteristic radius, is the critical density ( is the current value of Hubble’s constant), and and are two dimensionless parameters, representing the mean overdensity and central concentration of the radial profile respectively. The mass densities of the usual NFW profile are scaled to light density profiles assuming light traces mass, at least in the visible cores of each cluster, such that , where is the mean mass-to-light ratio of the cluster.
This implies that the projected surface brightness
| (2) |
with
| () | (3) | ||||
| () | |||||
where , being the projected radius from the centre of the cluster. This projected model is then fit to the observed surface brightness profiles, with an additional constant term to represent foreground/background galaxies. An example of such a fit can be found in Fig. 5 for the cluster Abell 2734. The profiles are generally well fitted with 16 of the clusters having reduced chi squared values of between 0.9 to 1.1, except for a couple of cases with obviously deviant points.

5.2 Virial mass estimates
The mass within a radius from the centre of the cluster can be derived from the modelled velocity dispersion and spatial density profiles (Koranyi & Geller, 2000). On assumption of a constant mass-to-light ratio , the mass density , following (1), results in the enclosed mass profile,
| (4) |
The core radius has already been found in the fitting of the surface brightness profile above. The quantity and are linked by the requirement that the mean density within should be , i.e.,
| (5) |
where .
Assuming that the virial theorem holds, an estimate of can be gained from
| (6) |
where is the radial velocity dispersion of the cluster and is the approximate virial radius determined by
| (7) |
where is the number of galaxies in the system. The summation is over all pairs of galaxies , where the projected separation for each pair is (Binney & Tremaine, 1987).
The enclosed mass profile (4) can be used to find and in terms of . The calculated cluster masses within the Abell radius of 2.14 Mpc, and their core radii and virial radii found from the model fitting, can be found in Table 1.
The virial estimate will fail to represent the gravitating mass of a cluster which is very obviously in the process of rapid evolution, e.g. a collapsing or interacting system, since the virial theorem does not strictly apply to systems whose moment of inertia is significantly changing with time. Abell 87 is obviously such a system (see Appendix), so instead of measuring its virial mass, we have assumed it to be equal in mass to Abell 85 in overdensity calculations.
5.3 A lower limit to the Mass of the Supercluster
The sum of the individual virial masses of the clusters, as calculated in the previous section, can be treated as a lower limit to the mass of the supercluster. As described above, we assume that the mass of Abell 87 is the same as that of Abell 85. For the entire system consisting of 19 Abell clusters and three non-Abell clusters, as listed in Table 1, this amounts to 1.5 M⊙. This corresponds to the case where the inter-cluster links in the MST are allowed to be Mpc. However, as in this paper, if one considers inter-cluster links of Mpc or less, the supercluster is made of at least two distinct filaments.
-
1.
For the filament containing A85, we use a cylindrical column of length 10.5 deg and cross-section of diameter 4 deg. For this volume of 6757 Mpc3, we obtain the total mass of the clusters as ;
-
2.
For the filament containing A133, using a cylindrical column of length 21 deg and cross-section of diameter 4 deg, amounting to a volume of 19598 Mpc3, we obtain the total mass of the clusters as .
With the critical density of the universe having a value of M⊙ Mpc-3, these values for the mass of the Supercluster represent matter overdensities of 4.7 (over Mpc3) and 1.3 (over Mpc3) for the A85-related and A133-related filaments respectively. These values are similar to those found in the core of the Shapley supercluster, and the cosmological significance of such overdensities in a supercluster filament has been discussed in the literature (Raychaudhury, 1989; Ettori, Fabian, & White, 1997). Given that these represent just the mass of the clusters in the filament, and that the matter density of the Universe is , these amount to very significant overdensities over very large volumes, larger than is required for a given volume to turn around and collapse upon itself.
6 Conclusions
We have used survey redshifts (mainly from 2dFGRS, 6dFGS, SDSS, NED and ZCAT) and photometry (from SuperCosmos) of galaxies belonging to the clusters belonging to the Pisces-Cetus supercluster to investigate its nature, extent and orientation. The supercluster consists of two main filaments, consisting of 11 and 5 clusters respectively, at mean redshifts of 0.0625 and 0.0545 respectively. Most of the former, containing the cluster A133, lies in the 2dFGRS region, and gives us a remarkable three-dimensional view of a string of clusters, with groups delineating the filamentary structure. The latter, partially covered by the Sloan Digital sky survey, contains the clusters A85 & A87, for which independent evidence exists (from X-ray observations) of collapse along the filament.
For the galaxies lying in the region of the sky covered by the 2dFGRS, we investigated the evidence of enhanced star formation in groups and clusters within and outside the supercluster, using the parameter measured from principal components of the spectra, which has been shown to correlate well with the equivalent width of the emission line. We found that while, as expected, cluster galaxies have evidence of suppressed star formation compared to galaxies in the field, a higher percentage of the galaxies in groups belonging to the supercluster have enhanced star formation compared to those in the field. This would be consistent with the filamentary structure of the supercluster leading to an enhanced merger rate, which would in turn induce star formation.
Of these, from the values, it appears that galaxies in poor groups in the supercluster have more enhanced star formation than those in the richer groups. This would imply that due to the enhanced rate of galaxy mergers within the poorer groups, which in general have lower velocity dispersions and thus the galaxies in them experience more dynamical friction. This agrees with the difference of the luminosity function of galaxies between X-ray bright and X-ray faint groups (Miles et al., 2004).
Virial masses were calculated from NFW fits to surface brightness profiles and velocity dispersions for the constituent clusters, the sum of these masses being taken as a lower limit to the mass of the supercluster. These were found to be and respectively for the A85-filament and A133-filament. These correspond to mass overdensities of 4.7 and 1.3, over volumes of almost Mpc3 and Mpc3) respectively, for the A85-related and A133-related filaments. These values indicate that in both these branches, it is likely that a large fraction of the supercluster has already turned around and collapsed upon itself.
We started this discussion with the debate concerning the scale of the largest bound structures in the Universe, and the scale of homogeneity of the Universe. Ever since the discovery of the “Great Wall” (Geller & Huchra, 1989), which seemed to be a structure almost Mpc long, the discovery of comparable structures have been claimed (e.g., Bagchi et al., 2002; Brand et al., 2003; Miller et al., 2004). To be cosmologically significant, it is necessary to show that these large structures are gravitationally bound, which is difficult to demonstrate. In this work, the two supercluster filaments we consider are respectively Mpc and Mpc long. A large fraction of these filaments seem to be bound entities, showing evidence of ongoing evolution, and interaction-induced star formation. This is consistent with statistical analyses of the LCRS and 2dF redshift surveys, which indicate that the scale of homogeneity sets in beyond the scale of Mpc or so.
Acknowledgements
We would like to thank Suketu Bhavsar for the development of the minimum spanning tree software used to find the supercluster members. We would also like to thank all the people involved in creating the 2dFGRS, 6dFGS, SDSS and SuperCosmos surveys, which form the source of our data. Our gratitude goes to an anonymous referee who provided helpful comments. Finally, we would like to thank the creators of NASA/IPAC Extragalactic Database (NED), the first port of call in many cases. NED is operated by the Jet Propulsion Laboratory, California Institute of Technology, under contract with the National Aeronautics and Space Administration.
| Cluster | R.A. | Dec | cz | # z | T | Rich | Survey | |||||
|---|---|---|---|---|---|---|---|---|---|---|---|---|
| (J2000) | (J2000) | km s-1 | erg/s | keV | km s-1 | Mpc | Mpc | |||||
| A0014 | 00 15 10.9 | -23 52 56 | 19665 | 13 | 0.51b | 2.8b,∗ | 0 | - | 2.33 | 6.23 | 1.1 | |
| A0027 | 00 24 52.1 | -20 43 14 | 16287 | 6 | 0.028d | 1.0∗ | 0 | - | 1.46 | 6.53 | ||
| A0074 | 00 39 08.8 | -22 19 49 | 19264 | 11 | 0.021a | 1.1∗ | 0 | - | 1.62 | 6.16 | ||
| A0085 | 00 41 50.8 | -09 18 18 | 16556 | 294 | 12.47c | 6.2a | 1 | S | 3.12 | 5.57 | 1.8 | |
| A0086 | 00 42 40.0 | -21 48 01 | 18911 | 12 | 0.094a | 1.3∗ | 0 | - | 2.00 | 6.27 | ||
| A0087 | 00 43 01.0 | -09 47 36 | 16535 | 194 | 1 | S | ||||||
| A0114 | 00 53 27.5 | -21 44 42 | 17696 | 24 | 0.055a | 1.4∗ | 0 | - | 2.10 | 6.29 | 0.6 | |
| A0117 | 00 55 51.9 | -09 59 09 | 16424 | 101 | 0.26a | 1.5∗ | 0 | S | 2.23 | 6.23 | 0.7 | |
| A0126 | 00 59 53.8 | -14 14 41 | 16274 | 11 | 0.027d | 1.2∗ | 1 | - | 1.85 | 6.13 | ||
| A0133 | 01 02 41.2 | -21 52 45 | 16507 | 20 | 3.81c | 3.8a | 0 | - | 2.57 | 6.08 | 1.2 | |
| A0151 | 01 08 51.1 | -15 24 23 | 15982 | 73 | 0.70b | 3.1b,∗ | 1 | - | 2.35 | 5.55 | 0.9 | |
| A2660 | 23 45 16.0 | -25 50 09 | 18724 | 17 | 0.049d | 1.7∗ | 0 | 0.73 | 2.54 | 6.35 | 1.6 | |
| A2683 | 23 57 36.7 | -25 36 44 | 19625 | 11 | 0 | 0.88 | 0.93 | 6.71 | ||||
| A2716 | 00 03 01.3 | -27 08 11 | 19810 | 77 | 0 | 0.85 | 2.66 | 6.20 | 1.0 | |||
| A2734 | 00 11 19.5 | -28 51 41 | 18486 | 141 | 2.22c | 4.4b,∗ | 1 | 0.82 | 2.84 | 6.07 | 1.6 | |
| A2794 | 00 37 38.1 | -30 48 59 | 18298 | 34 | 1 | 0.97 | 1.69 | 6.02 | 0.4 | |||
| A2800 | 00 38 09.4 | -25 04 51 | 19054 | 79 | 1 | 0.81 | 2.08 | 6.31 | 0.5 | |||
| A2824 | 00 48 34.0 | -21 20 36 | 17460e | 7 | 0.47b | 2.8b,∗ | 0 | - | ||||
| A4053 | 23 54 46.0 | -27 40 18 | 19670 | 26 | 1 | 0.88 | 1.12 | 5.99 | ||||
| S1136 | 23 36 16.9 | -31 36 20 | 18562 | 54 | 1.25b | 3.7b,∗ | 0 | 0.89 | 2.41 | 6.39 | 1.0 | |
| S1155 | 23 49 44.0 | -29 07 13 | 14950 | 33 | 0 | 1.00 | 1.51 | 6.78 | 0.3 | |||
| ED332 | 23 41 35.5 | -29 14 11 | 15280 | 84 | 1.00 | 2.24 | 6.36 | 0.6 |
Columns: (1) Name of cluster (A*** and S*** Abell, Corwin, & Olowin (1989), ED332 Lumsden et al. (1997); (2,3) Equatorial J2000 centres (we use centroids of X-ray emission where available, see Appendix); (4) Redshift (see §3.1); (5) Number of cluster member redshifts used to find the mean cluster redshift ((e) Struble & Rood (1999) and §3.1); (6) Bolometric X-ray luminosities ((a)Jones & Forman (1999); (b) Cruddace et al. (2002); (c) Reiprich & Böhringer (2002); (d) Ledlow et al. (2003)); (7) Temperature (=estimated from relation Osmond & Ponman (2004)); (8) Abell richness (Abell, Corwin, & Olowin (1989)); (9) Survey coverage [S=Sloan, Number= completeness in 2dFGRS field]; (10) Velocity dispersion (see §3.1); (11) in Mpc (see Eq. (6)); (12) Virial radius (see Eq. (7)); (13) Cluster virial mass within an Abell radius (2.14 Mpc) (see Eq. (4)).
References
- Abazajian et al. (2005) Abazajian K., et al., 2005, AJ, 129, 1755
- Abell, Corwin, & Olowin (1989) Abell, G. O., Corwin, H. G., & Olowin, R. P. 1989, ApJS, 70, 1
- Bagchi, Pislar, & Lima Neto (1998) Bagchi J., Pislar V., Lima Neto G. B., 1998, MNRAS, 296, L23
- Bagchi et al. (2002) Bagchi J., Enßlin T. A., Miniati F., Stalin C. S., Singh M., Raychaudhury S., Humeshkar N. B., 2002, NewA, 7, 249
- Bahcall (1988) Bahcall N. A., 1988, ARA&A, 26, 631
- Bahcall (2000) Bahcall N. A., 2000, PhST, 85, 32
- Baier et al. (2003) Baier F.W., Godlowski W., MacGillivray H.T., 2003, A&A, 403, 847
- Balogh et al. (1998) Balogh M.L., Schade D., Morris S.L., Yee H.K.C., Carlberg R.G., Ellingson E., 1998, ApJ, 504, L75
- Colberg, Krughoff, & Connolly (2005) Colberg J. M., Krughoff K. S., Connolly A. J., 2005, MNRAS, 359, 272
- Balogh et al. (2004) Balogh M., et al., 2004, MNRAS, 348, 1355
- Bharadwaj, Bhavsar, & Sheth (2004) Bharadwaj S., Bhavsar S. P., Sheth J. V., 2004, ApJ, 606, 25
- Bhavsar & Splinter (1996) Bhavsar, S. P. & Splinter, R. J. 1996, MNRAS, 282, 1461
- Binney & Tremaine (1987) Binney J., & Tremaine S., 1987, Galactic Dynamics (Princeton: Princeton Univ. Press)
- Bond, Kofman, & Pogosyan (1996) Bond J. R., Kofman L., Pogosyan D., 1996, Natur, 380, 603
- Brand et al. (2003) Brand K., Rawlings S., Hill G. J., Lacy M., Mitchell E., Tufts J., 2003, MNRAS, 344, 283
- Burns et al. (1988) Burns J. O., Moody J. W., Brodie J. P., Batuski D. J., 1988, ApJ, 335, 542
- Cen & Ostriker (1999) Cen R., Ostriker J. P., 1999, ApJ, 514, 1
- Colless et al. (2003) Colless M. et al., 2003, http://msowww.anu.edu.au/2dFGRS/ (astro-ph/0306581)
- Couch & Sharples (1987) Couch W.J., Sharples R.M., 1987, MNRAS, 229, 423
- Cruddace et al. (2002) Cruddace R., Voges W., B hringer H., Collins C.A., Romer A.K., MacGillivray H., Yentis D., Schuecker P., Ebeling H., De Grandi S., 2002, ApJS, 140, 239
- Danese, de Zotti, & di Tullio (1980) Danese L., de Zotti G., di Tullio G., 1980, A&A, 82, 322
- Dressler (1980) Dressler A., 1980, ApJ, 236, 351
- Durret et al. (2003) Durret F., Lima Neto G.B., Forman W., Churazov E., 2003, A&A, 403, L29
- Ebeling, Barrett, & Donovan (2004) Ebeling H., Barrett E., Donovan D., 2004, ApJ, 609, L49
- Edge & Stewart (1991) Edge A. C., Stewart G. C., 1991, MNRAS, 252, 414
- Einasto et al. (1994) Einasto M., Einasto J., Tago E., Dalton G. B., Andernach H., 1994, MNRAS, 269, 301
- Eke et al. (2004) Eke V. R. et al., 2004, MNRAS, 348, 866
- Ettori, Fabian, & White (1997) Ettori S., Fabian A. C., White D. A., 1997, MNRAS, 289, 787
- Fujita et al. (2002) Fujita Y., Sarazin C.L., Kempner J.C., Rudnick L., Slee O.B., Roy A.L., Andernach H., Ehle M., 2002, ApJ, 575, 764
- Fujita et al. (2004) Fujita Y., Sarazin C.L., Kempner J.C., Rudnick L., Slee O.B., Roy A.L., Andernach H., Ehle M., 2004, ApJ, 616, 157
- Geller & Huchra (1989) Geller M. J., Huchra J. P., 1989, Sci, 246, 897
- Giovannini & Feretti (2000) Giovannini, G.; Feretti, L., 2000, NewA, 5, 335
- Girardi et al. (1998) Girardi M., Giuricin G., Mardirossian F., Mezzetti M., Boschin W., 1998, ApJ, 505, 74
- Gómez et al. (2003) Gómez P. L., et al., 2003, ApJ, 584, 210
- Hambly et al. (2001) Hambly N. C., et al., 2001, MNRAS, 326, 1279
- Jenkins et al. (1998) Jenkins A., et al., 1998, ApJ, 499, 20
- Jones & Forman (1999) Jones C., Forman W., 1999, ApJ, 511, 65
- Jones et al. (2004) Jones D. H., et al., 2004, MNRAS, 355, 747
- Kauffmann et al. (2004) Kauffmann G., White S. D. M., Heckman T. M., Ménard B., Brinchmann J., Charlot S., Tremonti C., Brinkmann J., 2004, MNRAS, 353, 713
- Kempner & Sarazin (2002) Kempner J.C., Sarazin C.L., 2002, ApJ, 579, 236
- Kolokotronis, Basilakos, & Plionis (2002) Kolokotronis V., Basilakos S., Plionis M., 2002, MNRAS, 331, 1020
- Koranyi & Geller (2000) Koranyi D.M., Geller M.J., 2000, AJ, 119, 44
- Ledlow et al. (2003) Ledlow M.J., Voges W., Owen F.N., Burns J.O., 2003, ApJ, 126, 2740
- Lewis et al. (2002) Lewis I., et al., 2002, MNRAS, 334, 673
- Lumsden et al. (1992) Lumsden S.L., Nichol R.C., Collins C.A., Guzzo L., 1992, MNRAS, 258, 1
- Lumsden et al. (1997) Lumsden S.L., Collins C.A., Nichol R.C., Eke V.R., Guzzo L., 1997, MNRAS, 290, 119
- Madgwick et al. (2002) Madgwick D.S., et al.(the 2dFGRS Team), 2002, MNRAS, 333, 133
- Madgwick et al. (2003) Madgwick D.S., Somerville R., Lahav O., Ellis R., 2003, MNRAS, 343, 871
- Mazure et al. (1996) Mazure, A., et al.1996, A&A, 310, 31
- Miles et al. (2004) Miles T. A., Raychaudhury S., Forbes D. A., Goudfrooij P., Ponman T. J., Kozhurina-Platais V., 2004, MNRAS, 355, 785
- Miller et al. (2004) Miller L., Croom S. M., Boyle B. J., Loaring N. S., Smith R. J., Shanks T., Outram P., 2004, MNRAS, 355, 385
- Navarro, Frenk & White (1996) Navarro, J.F., Frenk, C. S., & White, S. D. M. 1996, ApJ, 462, 563
- Osmond & Ponman (2004) Osmond J., Ponman T., 2004, MNRAS, 350, 1511
- Pimbblet, Drinkwater, & Hawkrigg (2004) Pimbblet K. A., Drinkwater M. J., Hawkrigg M. C., 2004, MNRAS, 354, L61
- Press et al. (1992) Press W. H., Teukolsky S. A., Vetterling W. T. & Flannery B. P., 1992, Numerical Recipes in Fortran 2nd ed. (Cambridge: Cambridge University Press)
- Proust et al. (1992) Proust D., Quintana H., Mazure A., da Souza R., Escalera E., Sodre Jr, L. and Capelato H.V., 1992, A&A, 258, 243
- Raychaudhury (1989) Raychaudhury S., 1989, Nature, 342, 251
- Raychaudhury et al. (in preparation) Raychaudhury S., Bhavsar S.P., Huchra J.P., 2006, in preparation
- Reiprich & Böhringer (2002) Reiprich, T.H., Böhringer H., 2002, ApJ, 567, 716
- Shandarin, Sheth, & Sahni (2004) Shandarin S. F., Sheth J. V., Sahni V., 2004, MNRAS, 353, 162 )
- Slee et al. (2001) Slee O. B., Roy A. L., Murgia M., Andernach H., Ehle M., 2001, AJ, 122, 1172
- Struble & Rood (1999) Struble M.F., Rood, H.J., 1999, ApJS, 125, 35
- Tully (1986) Tully R. B., 1986, ApJ, 303, 25
- Tully (1987) Tully R. B., 1987, ApJ, 323, 1
- Tully (1988) Tully R. B., 1988, IAUS, 130, 243
- Zucca et al. (1993) Zucca E., Zamorani G., Scaramella R., Vettolani G., 1993, ApJ, 407, 470
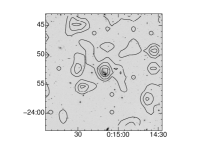
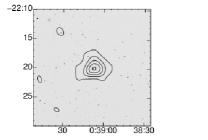
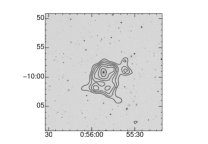
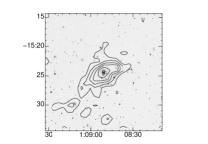
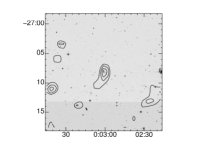
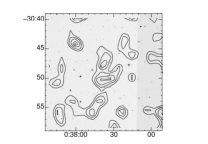
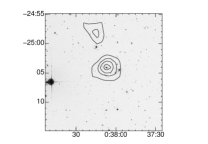
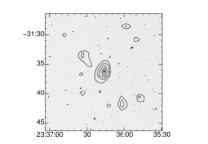
Appendix A X-Ray observations
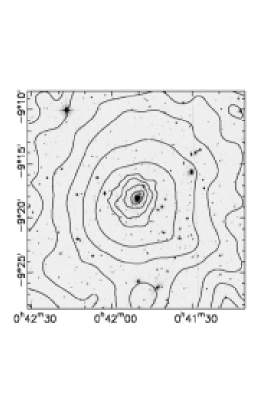
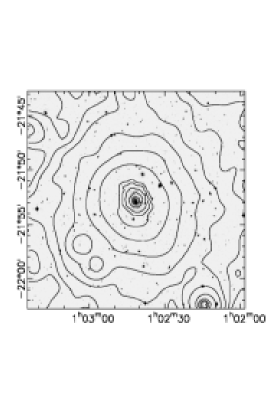
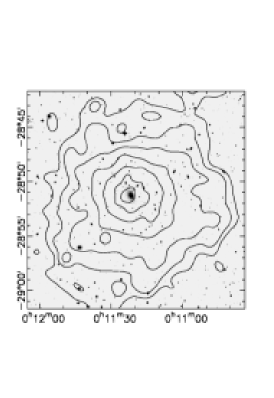
We reduced the available archival ROSAT PSPC pointed observations of A85, A133 and A2734, as well as those of the others that were detected in the ROSAT all-sky survey (RASS) and the EINSTEIN observations, using the ASTERIX software package (http://www.sr.bham.ac.uk/asterix-docs). The smoothed contours of X-ray flux in the 0.1-2.4 keV range can be seen as overlays on optical (blue) DSS images in Fig. (6). X-ray luminosities from literature were converted into bolometric luminosities, with the software package PIMMS, using a Raymond-Smith model. The temperature of the plasma, when not found in the literature, was estimated from the velocity dispersion-temperature relation of Osmond & Ponman (2004) and a suitable H I column density. The luminosity and temperature values are listed in Table 1.
Appendix B Notes on individual clusters
Abell 14
Our adopted position from a visual inspection of DSS images is offset by R.A. and Dec from the original Abell position. Abell, Corwin, & Olowin (1989) noted that the brightest galaxy and the 3rd brightest are spirals. Baier et al. (2003) analysed a sample of 974 COSMOS/UKST southern sky object catalogue galaxies from the cluster and found substructures in the cluster.
Abell 27, 86, 114, 117, 126
Our adopted positions from a visual inspection of DSS images are offset by (A 27): R.A. and Dec; (A 86): R.A. and Dec; (A 114): R.A. and Dec; (A 117): R.A. and Dec; (A 126): R.A. and Dec from the original Abell position.
Abell 74
Our adopted position from RASS X-ray emission and confirmed by a visual inspection of DSS images is offset by R.A. and Dec from the original Abell position.
Abell 85, Abell 87
Our adopted position for Abell 85 from a visual inspection of DSS images is offset by R.A. and Dec from the original Abell position. Giovannini & Feretti (2000) note that radio emission is detected from the central cD galaxy of A85, and two head-tail radio galaxies are also visible. XMM-Newton observations (Durret et al., 2003) have shown that A85 is a strong X-ray source with an extended 4 Mpc filament to the southeast while A87 is not detected. Kempner & Sarazin (2002) investigate the south subcluster of A85 to the north of this filament, and confirm that this subcluster is merging with the main cluster, showing evidence of significant disruption, possibly associated with non-thermal inverse Compton emission (Bagchi, Pislar, & Lima Neto, 1998)/
Abell 133
Our adopted position is taken from Jones & Forman (1999), and is offset by R.A. and Dec from the original Abell position. Edge & Stewart (1991) note the presence of a bright cD galaxy with multiple nuclei at the centre of a cooling flow X-Ray cluster. Slee et al. (2001) point out the cluster has a radio relic, which is a diffuse steep-spectrum source with no optical identification. Fujita et al. (2002) found a tongue of X-ray emission extending the the northwest of the cD galaxy with no optical counterpart. The X-ray spectrum showed the emission to be thermal and at a lower temperature than the ambient gas. Fujita et al. (2004) find evidence of a weak merger shock, and suggest it to be the origin of the tongue-like X-ray structure.
Abell 151
Our adopted position from a visual inspection of DSS images is offset by R.A. and Dec from the original Abell position. Proust et al. (1992) studied the kinematics of the cluster, and found that it is composed of three subclusters at 0.054, 0.041 and 0.11. They suggest that the background one at z=0.11 is likely to be part of a supercluster including A86, A131, A159, A166 and A183. They also find a southern substructure which they conclude is a foreground group. Girardi et al. (1998) show that the cluster consists of two separate clumps, A151a, 44 galaxies ( km/s) and A151b, 7 galaxies km/s).
Abell 2660, Abell 2683, Abell 2716, Abell S1136
Our adopted position from a visual inspection of DSS images is offset by (A2660): R.A. and Dec and (A2683): R.A. and Dec and (A2716): R.A. and Dec, (AS1136): R.A. and Dec from the original Abell position.
Abell 2734
Our adopted position taken from Cruddace et al. (2002) and confirmed by a visual inspection of DSS images is offset by Dec from the original Abell position.
Abell 2794, Abell S1155
Our adopted position taken from Lumsden et al. (1992) and confirmed by a visual inspection of DSS images is offset by (A2794): R.A. and Dec and (AS1155): R.A. and Dec from the original Abell position.
Abell 2800
Our adopted position from RASS X-ray emission and confirmed by a visual inspection of DSS images is offset by R.A. and Dec from the original Abell position.
Abell 4053
Mazure et al. (1996) list a foreground group: from 7 redshifts, km/s)