First Detection of Millimeter/Submillimeter Extragalactic H2O Maser Emission
Abstract
We report the first detection of an extragalactic millimeter wavelength H2O maser at 183 GHz towards NGC 3079 using the Submillimeter Array (SMA), and a tentative submillimeter wave detection of the 439 GHz maser towards the same source using the James Clerk Maxwell Telescope (JCMT). These H2O transitions are known to exhibit maser emission in star-forming regions and evolved stars. NGC 3079 is a well-studied nuclear H2O maser source at 22 GHz with a time-variable peak flux density in the range 3 – 12 Jy. The 183 GHz H2O maser emission, with peak flux density 0.5 Jy (7 detection), also originates from the nuclear region of NGC 3079 and is spatially coincident with the dust continuum peak at 193 GHz (53 mJy integrated). Peak emission at both 183 and 439 GHz occurs in the same range of velocity as that covered by the 22 GHz spectrum. We estimate the gas to dust ratio of the nucleus of NGC 3079 to be 150, comparable to the Galactic value of 160. Discovery of maser emission in an active galactic nucleus beyond the long-known 22 GHz transition opens the possibility of future position-resolved radiative transfer modeling of accretion disks and outflows pc from massive black holes.
1 Introduction
Active galactic nuclei (AGN) that exhibit H2O maser emission at 22 GHz have been objects of particular interest since discovery that the maser emission can trace circumnuclear accretion disks, as in NGC 4258 (Miyoshi et al., 1995; Greenhill et al., 1995a, b). The presence of maser emission enables direct mapping of AGN dynamics within 1 pc of supermassive black holes via Very Long Baseline Interferometry (VLBI) (see reviews of Greenhill, 2002; Maloney, 2002). The additional discovery that H2O maser emission can be associated with shocked gas in jets and outflows has also provided a tracer for a second component in AGN (Gallimore et al., 1996; Claussen et al., 1998; Peck et al., 2003; Greenhill et al., 2003).
Maser emission at 22 GHz is believed to be predominantly collisionally-pumped at gas kinetic temperatures of Tk = 400 – 1000 K, hydrogen densities of n(H2) = 108 – 1010 cm-3, and dust temperatures Td 100 K (e.g., Deguchi, 1977; Elitzur et al., 1989; Yates et al., 1997). In AGN accretion disks, gas heating is thought to arise from X-ray irradiation of the disk surfaces, whereas masers in jets and outflows may be heated via shock compressions (Neufeld et al., 1994; Kartje et al., 1999).
Since the physical conditions that give rise to emission at 22 GHz also pump other H2O maser transitions, notably those at 183, 321 and 325 GHz (e.g., Deguchi, 1977; Neufeld & Melnick, 1991; Yates et al., 1997), 22 GHz maser emission is unlikely to be alone in AGN disks, jets and outflows. We note that, in galactic regions of star formation and evolved stars, inversion of the 22 GHz transition is accompanied by inversion of other rotational transitions from the ground and vibrationally excited H2O states (e.g., Phillips et al., 1980; Waters et al., 1980; Menten & Melnick, 1989; Menten et al., 1990a, b; Feldman et al., 1991; Menten & Melnick, 1991; Melnick et al., 1993). In AGN, some of the masers should occur in broadly the same regions as at 22 GHz, but others could probe uncharted regions of the central engines of AGN, including regions at smaller radii. Line ratios of two or more maser transitions originating from the same gas would constrain radiative transfer models far better than is now possible. Previous searches for extragalactic millimeter/submillimeter H2O masers have been performed, but have been hampered by r.m.s. sensitivities worse than 1 Jy (Menten, private communication).
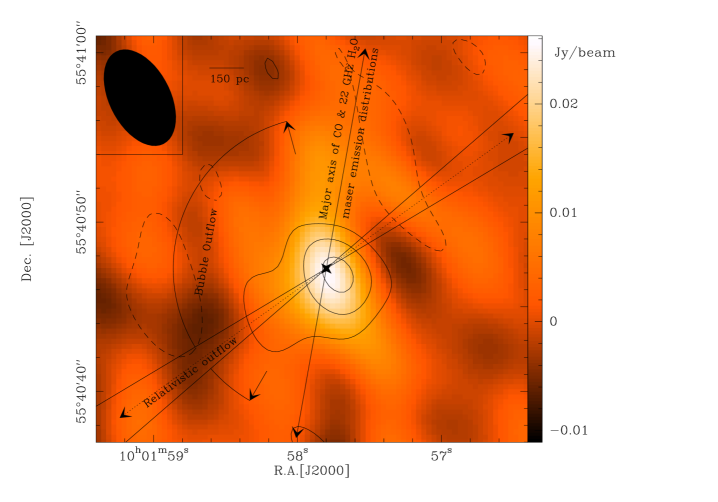
NGC 3079 is an almost edge-on spiral Seyfert 2/LINER galaxy with optical heliocentric velocity of 1125 6 km s-1 (e.g., Heckman, 1980; Ho et al., 1997), at a distance of 16 Mpc (Sofue, 1999). It hosts 22 GHz H2O maser emission at velocities between 940 and 1350 km s-1, which are believed to trace a disk-like structure at radii of 0.4 – 1.3 pc from a central engine. The pc-scale maser disk is aligned with a dense molecular kpc-scale disk (Koda et al., 2002) and is located at the apex of a kpc-scale superbubble (Kondratko et al., 2005; Cecil et al., 2002). The bubble is believed to be inflated by a wide-angle outflow (Cecil et al., 2001) that is also responsible for the radio continuum lobes along the minor axis of the galaxy (e.g., Duric & Seaquist, 1988; Trotter et al., 1998; Sawada-Satoh et al., 2000; Yamauchi et al., 2004). Within a parsec of the nucleus, the relativistic jet appears aligned with the inner wall of the bubble and may be responsible for weak 22 GHz maser emission away from the disk (Kondratko et al., 2005, and references therein). All of these emission sources lie within the primary beam of the SMA observations reported here.
2 Observations and Data Reduction
2.1 SMA Observations at 183 GHz
We observed the ground-state 313 220 transition of para-H2O (Eu/ 200 K) at a rest frequency of 183.310 GHz (: 1.6 mm) towards NGC 3079 using the SMA111The SMA is a joint project between the Smithsonian Astrophysical Observatory and the Academia Sinica Institute of Astronomy and Astrophysics, and is funded by the Smithsonian Institution and the Academia Sinica. on 2005 March 1. The compact configuration included six antennas, resulting in projected baselines of 8 – 72 m. The SMA receivers operate in double-sideband mode with two 2 GHz sidebands that we tuned to 183.310 and 193.310 GHz (band-center). The correlator provided continuous coverage of each sideband (in 24 separate chunks of 256 channels) and 0.4 MHz channel spacing. The phase center of the observations was , (Cotton et al., 1999). The zenith opacity measured with the NRAO tipping radiometer located at the Caltech Submillimeter Observatory was (225 GHz)=0.03 - 0.05 throughout.
We calibrated the data within the IDL superset MIR developed for the Owens Valley Radio Observatory (Scoville, 1993) and adapted for the SMA; the imaging was performed in MIRIAD. Data reduction took into account the effect of the pressure-broadened terrestrial H2O absorption line centered at 183.310 GHz. Fortunately, the redshift of the galaxy reduces the line frequency of the maser transition by 0.7 GHz, greatly lowering the corresponding atmospheric opacity. For bandpass calibration we used Jupiter and Saturn. Phase calibration was performed via frequent observations of the quasar 0923+392 about 18o from the phase center. We performed the amplitude calibration separately for upper and lower sideband data. For the upper sideband, we used 0923+392; for lower sideband data, we performed amplitude calibration on each of the 24 spectral chunks separately using Saturn and Jupiter. The calibration of the lower sideband both as a function of elevation and frequency was designed to reduce the effect of variation in terrestrial H2O absorption across the sideband. We derived the flux scale using observations of Callisto with an estimated accuracy of 20%. Single sideband system temperatures corrected to the top of the atmosphere were between 400 and 850 K.
2.2 JCMT Observations at 439 GHz
We observed the ground-state 643 550 transition of ortho-H2O (Eu/ 1100 K) at a rest frequency of 439.151 GHz (: 0.7 mm) towards NGC 3079 using the 15 meter JCMT on 2004 November 18 in =0.041 – 0.045 weather. The instantaneous bandwidth was 1840 MHz, corresponding to 1200 km s-1, with a channel spacing of 1250 kHz or 0.85 km s-1. The integration time on source was 2 hrs in beam-switching mode with a throw of 60′′. The average Tsys during the observations was 2650 K. We reduced the data using the Starlink spectral-line reduction software, SpecX.
3 Results
We detected millimeter (193 GHz) continuum emission with a peak signal to noise ratio (S/N) of 10 (Fig. 1) at , (statistical uncertainties). Systematic uncertainties of (,) were estimated through measurement of an apparent position for 1150+497 against the phase calibrator 0923+392. These place the peak of the millimeter continuum within 1 of the 22 GHz maser position. We partially resolved the nucleus in the north-south direction and the elongation is approximately parallel to the position angles of both the pc-scale accretion disk traced by 22 GHz maser emission and the kpc-scale molecular disk detected using e.g., CO (Koda et al., 2002).
We detected 183 GHz H2O emission with a peak S/N of 7 in both the real part of the amplitude spectrum and the interferometer phase spectrum (Figs. 1 and 2). The peak flux density is 0.55 Jy at 1017 km s-1. The line covers 9 frequency channels and overlaps a persistent Doppler component appearing in published 22 GHz maser spectra for dates 1998 May 8, 2000 March 18 where it is especially prominent at 2.5 Jy (both Hagiwara et al., 2002), 2001 March 23 (Kondratko et al., 2005) and 2002 April 12 (Braatz et al., 2003). We note possible detection of additional spectral features at 1208 (5 channels wide) and 1265 km s-1 (4 channels wide). Both features appear in spectra of real amplitude and phase (near zero degrees, which indicates positions similar to the 1017 km s-1 emission), and both lie within the velocity interval of 22 GHz emission. Note that the correspondence of features between 22 and 183 GHz observations is not precise and is also not expected to be true for all features under certain pumping scenarios. The peak maser emission is at , , which is within 1 of the 193 GHz continuum peak. At our resolution, we cannot determine whether 183 GHz emission originates from the disk or outflow, or from both. We note that in addition to tracing a disk, a subset of 22 GHz maser emission is associated with the outflow within a few parsecs of the nucleus (Kondratko et al., 2005). 22 GHz emission at around 1000 and 1200 km s-1 is present both in the disk and outflow. Possible angular extension of the 183 GHz emission to the southeast is marginally detected (2), which lies along the axis of the relativistic flow (e.g., Kondratko et al., 2005). We note that Hagiwara et al. (2004) detect OH absorption associated with the outflow at an overlapping velocity, and that we cannot rule out shocks in circumnuclear material as an origin for 183 GHz emission.
We obtained a tentative detection (5) of the 439 GHz maser at 1157 km s-1 (Fig. 3). With peak Sν 2.5 Jy, 439 GHz emission is of comparable strength to typical values for peak 22 GHz emission towards NGC 3079 and occurs within the 22 GHz velocity interval.
4 Discussion
4.1 Millimeter Dust Emission
The millimeter continuum of NGC 3079 is probably dominated by thermal emission from optically thin dust. As in the 1.2 mm observations of Braine et al. (1997) at 11′′ resolution, we find dust concentrated in the nuclear region of NGC 3079 (Fig. 1) and place an upper limit of 8 mJy (3) on emission associated with the radio lobes 1 kpc from the emission peak. Braine et al. (1997) estimates the dust temperature to be 30 K at kpc radii. However, in two other AGN the presence of hotter dust at 100 times smaller radii, of 300 K, has been inferred from VLT observations (Jaffe et al., 2004; Prieto et al., 2004). Adopting a dust temperature of 100 K for NGC 3079 on intermediate scales and a dust opacity index , we estimate the enclosed dust mass of the inner 200 pc is 106.3±0.8 M⊙ using the method described in Hildebrand (1983). Using CO Nobeyama observations by Koda et al. (2002), who find a gas mass of 108.5 M⊙ within the central 150 pc, we estimate a gas-to-dust ratio of , which is comparable to the Galactic value of 160 and to the ratios derived in bright local galaxies (Dunne et al., 2000).
4.2 183 GHz Emission
The 183 GHz emission we detect in the nucleus of NGC 3079 is likely from a maser process. It arises from one, and possibly more, narrow unresolved features in the same range of velocity as that of known 22 GHz maser emission. From radiative transfer models we know that the same high densities and temperature conditions that produce maser emission at 22 GHz also strongly invert the 183 GHz H2O transition. Noting that the 22 GHz feature at 1017 km s-1 varies between 0.4 – 2.6 Jy (Hagiwara et al. 2002), and assuming an ortho:para H2O ratio of 3:1, pumping models could reproduce likely line ratios (e.g., Yates et al., 1997). Narrow linewidths (8 km s-1) at 183 GHz, small compared with the characteristic rotational and apparent random velocities for molecular gas in this nucleus (Kondratko et al., 2005), also indicate that emitting regions should be compact. Our beam size is too large to determine whether emission is thermal or maser based on brightness temperature arguments. For the emission to be thermal, with a brightness temperature of 2000 K such that H2O molecules are not dissociated, the emitting region must be 01 (10 pc).
4.3 439 GHz Emission
439 GHz emission is probably also due to maser amplification. Emission occurs over a narrow velocity range (Fig. 3), and conditions for strong 439 GHz inversion are likely to exist in the galactic nucleus. The 22 GHz spectrum peaks to the blue of the vsys of 1125 km s-1, yet the 439 GHz spectrum peaks slightly above vsys at 1157 km s-1 (Fig. 3). We ascribe this difference to the different pump mechanisms operating for each maser. Whereas 22 GHz emission is collisionally-pumped and is increasingly quenched by local dust temperatures 100 K, the 439 GHz maser is predominantly radiatively-pumped and is most strongly inverted in the presence of , and n = 5 x 109 cm-3 (Yates et al., 1997). Dust temperatures of this order and higher are reasonable in the central parsecs of the nucleus (Jaffe et al., 2004; Prieto et al., 2004). Peak 439 GHz emission (1157 km s-1) is therefore likely to originate from a hot, dusty region around the central engine, possibly at radii 1 pc, separated spatially from the gas emitting most strongly at 22 GHz (956 km s-1). At 22 GHz, features at these velocities are indeed separated spatially by 1 pc projected (Kondratko et al., 2005). The observations in Fig. 3 were taken on different dates, and we note that the 22 GHz feature near 1157 km s-1 is not present at all epochs (e.g., in Fig. 2). However, the feature line ratio in Fig. 3 of 100 is accommodated by the vicinity of hot dust (Yates et al., 1997).
References
- Braatz et al. (2003) Braatz, J. A., Wilson, A. S., Henkel, C., Gough, R., & Sinclair, M. 2003, ApJS, 146, 249
- Braine et al. (1997) Braine, J., Guelin, M., Dumke, M., Brouillet, N., Herpin, F., & Wielebinski, R. 1997, A&A, 326, 963
- Cecil et al. (2002) Cecil, G., Bland-Hawthorn, J., & Veilleux, S. 2002, ApJ, 576, 745
- Cecil et al. (2001) Cecil, G., Bland-Hawthorn, J., Veilleux, S., & Filippenko, A. V. 2001, ApJ, 555, 338
- Claussen et al. (1998) Claussen, M. J., Diamond, P. J., Braatz, J. A., Wilson, A. S., & Henkel, C. 1998, ApJ, 500, L129
- Cotton et al. (1999) Cotton, W. D., Condon, J. J., & Arbizzani, E. 1999, ApJS, 125, 409
- Deguchi (1977) Deguchi, S. 1977, PASJ, 29, 669
- Dunne et al. (2000) Dunne, L., Eales, S., Edmunds, M., Ivison, R., Alexander, P., & Clements, D. L. 2000, MNRAS, 315, 115
- Duric & Seaquist (1988) Duric, N. & Seaquist, E. R. 1988, ApJ, 326, 574
- Elitzur et al. (1989) Elitzur, M., Hollenbach, D. J., & McKee, C. F. 1989, ApJ, 346, 983
- Feldman et al. (1991) Feldman, P. A., Matthews, H. E., Cunningham, C. T., Hayward, R. H., Wade, J. D., Amano, T., & Scappini, F. 1991, JRASC, 85, 191
- Gallimore et al. (1996) Gallimore, J. F., Baum, S. A., O’Dea, C. P., Brinks, E., & Pedlar, A. 1996, ApJ, 462, 740
- Greenhill (2002) Greenhill, L. 2002, in IAU Symposium, 381
- Greenhill et al. (2003) Greenhill, L. J., et al. 2003, ApJ, 590, 162
- Greenhill et al. (1995a) Greenhill, L. J., Henkel, C., Becker, R., Wilson, T. L., & Wouterloot, J. G. A. 1995a, A&A, 304, 21
- Greenhill et al. (1995b) Greenhill, L. J., Jiang, D. R., Moran, J. M., Reid, M. J., Lo, K. Y., & Claussen, M. J. 1995b, ApJ, 440, 619
- Hagiwara et al. (2002) Hagiwara, Y., Henkel, C., Sherwood, W. A., & Baan, W. A. 2002, A&A, 387, L29
- Hagiwara et al. (2004) Hagiwara, Y., Klöckner, H.-R., & Baan, W. A. 2004, MNRAS, 353, 1055
- Heckman (1980) Heckman, T. M. 1980, A&A, 87, 152
- Hildebrand (1983) Hildebrand, R. H. 1983, QJRAS, 24, 267
- Ho et al. (1997) Ho, L. C., Filippenko, A. V., & Sargent, W. L. W. 1997, ApJS, 112, 315
- Jaffe et al. (2004) Jaffe, W., et al. 2004, Nature, 429, 47
- Kartje et al. (1999) Kartje, J. F., Königl, A., & Elitzur, M. 1999, ApJ, 513, 180
- Koda et al. (2002) Koda, J., Sofue, Y., Kohno, K., Nakanishi, H., Onodera, S., Okumura, S. K., & Irwin, J. A. 2002, ApJ, 573, 105
- Kondratko et al. (2005) Kondratko, P. T., Greenhill, L. J., & Moran, J. M. 2005, ApJ, 618, 618
- Maloney (2002) Maloney, P. R. 2002, PASA, 19, 401
- Melnick et al. (1993) Melnick, G. J., Menten, K. M., Phillips, T. G., & Hunter, T. 1993, ApJ, 416, L37
- Menten & Melnick (1989) Menten, K. M. & Melnick, G. J. 1989, ApJ, 341, L91
- Menten & Melnick (1991) —. 1991, ApJ, 377, 647
- Menten et al. (1990a) Menten, K. M., Melnick, G. J., & Phillips, T. G. 1990a, ApJ, 350, L41
- Menten et al. (1990b) Menten, K. M., Melnick, G. J., Phillips, T. G., & Neufeld, D. A. 1990b, ApJ, 363, L27
- Middelberg et al. (2004) Middelberg, E., et al. 2004, A&A, 417, 925
- Miyoshi et al. (1995) Miyoshi, M., Moran, J., Herrnstein, J., Greenhill, L., Nakai, N., Diamond, P., & Inoue, M. 1995, Nature, 373, 127
- Neufeld et al. (1994) Neufeld, D. A., Maloney, P. R., & Conger, S. 1994, ApJ, 436, L127
- Neufeld & Melnick (1991) Neufeld, D. A. & Melnick, G. J. 1991, ApJ, 368, 215
- Peck et al. (2003) Peck, A. B., Henkel, C., Ulvestad, J. S., Brunthaler, A., Falcke, H., Elitzur, M., Menten, K. M., & Gallimore, J. F. 2003, ApJ, 590, 149
- Phillips et al. (1980) Phillips, T. G., Kwan, J., & Huggins, P. J. 1980, in IAU Symp. 87: Interstellar Molecules, 21–24
- Prieto et al. (2004) Prieto, M. A., et al. 2004, ApJ, 614, 135
- Sawada-Satoh et al. (2000) Sawada-Satoh, S., Inoue, M., Shibata, K. M., Kameno, S., Migenes, V., Nakai, N., & Diamond, P. J. 2000, PASJ, 52, 421
- Scoville (1993) Scoville, N. 1993, Mir Cookbook
- Sofue (1999) Sofue, Y. 1999, Advances in Space Research, 23, 949
- Trotter et al. (1998) Trotter, A. S., Greenhill, L. J., Moran, J. M., Reid, M. J., Irwin, J. A., & Lo, K. 1998, ApJ, 495, 740
- Waters et al. (1980) Waters, J. W., et al. 1980, ApJ, 235, 57
- Yamauchi et al. (2004) Yamauchi, A., Nakai, N., Sato, N., & Diamond, P. 2004, PASJ, 56, 605
- Yates et al. (1997) Yates, J. A., Field, D., & Gray, M. D. 1997, MNRAS, 285, 303