A Hubble Space Telescope study of SCUBA submillimetre galaxies
Abstract
We present high-resolution imaging of a sample of 10 SCUBA submillimetre galaxies, obtained using the ACS camera on the Hubble Space Telescope. We find that the majority show compact, disturbed morphologies. Using quantitative morphological classification, we find that at least 6 are classified as major mergers. Simulations suggest that the morphological parameters are unlike local spirals and ellipticals, but similar to those of local ULIRGs. Compared to Lyman-break galaxies, the submillimetre-selected galaxies are on average more asymmetric, but also significantly more concentrated in their light distributions. This is consistent with a higher fraction of the stellar mass being contained within a central spheroid component. Despite their different morphologies, we find that submm galaxies are similar in size to luminous () Lyman-break galaxies, with half-light radii in the range kpc.
keywords:
cosmology: observations - galaxies: starburst - galaxies: formation - galaxies: evolution - infrared: galaxies1 Introduction
Surveys in the submm waveband have revealed a population of highly luminous, dust enshrouded galaxies that appear to contribute a large fraction of the star-formation at (Smail et al. 1997; Hughes et al. 1998; Barger et al. 1998, Eales et al. 1999). Originally discovered using the SCUBA array at the James Clerk Maxwell Telescope, these galaxies have been heralded by many as the discovery of the major epoch of dust-enshrouded spheroid formation (Lilly et al. 1999, Dunlop 2001, Granato et al. 2001). In terms of their bolometric power output (typically ), the submm sources appear to be high-z analogues of local Ultra-Luminous Infrared Galaxies (ULIRGs; Sanders & Mirabel 1996). The major difference, however, is their space density. At high redshift the submm galaxies may dominate the cosmic star-formation rate, while locally ULIRGs are rare and unusual phenomena.
Beyond their initial discovery, progress in understanding these galaxies has been difficult. This is due to an unfortunate combination of their optical faintness and the relatively large ( arcsec) SCUBA beam, which often makes unambiguous identification impossible. This deadlock has been partially overcome with deep radio observations at the Very Large Array (VLA), which have given precise locations for a significant sample of submm galaxies for the first time (Ivison et al. 2002, Chapman et al. 2003a). Follow-up spectroscopy has produced the first reliable estimate, showing a median redshift of with only a small fraction (a few per cent) of galaxies at (Chapman et al. 2003a).
There have been suggestions that many submm sources could be powered by AGN (e.g. Almaini, Lawrence & Boyle 1999), but the failure to detect significant numbers as luminous X-ray sources suggests that the AGN-dominated fraction is likely to be small (Fabian et al. 2000, Severgnini et al. 2000, Almaini et al. 2003). Nevertheless, a large fraction appear to host moderate-luminosity AGN activity (Alexander et al. 2003; Alexander et al. 2005), which may indicate that we are observing the joint-formation epoch of black holes and spheroids.
Despite the observational progress, current semi-analytic models have great difficulty producing so many dusty, luminous objects at these redshifts without resorting to extreme model parameters (Baugh et al. 2005). Morphological information offers a potential additional test of these models. For example, do they have structural parameters that are similar to local galaxies, or do they look more like ULIRGs? Are they compact or extended? What fraction is undergoing merging, and how do they differ in their structural parameters from more ‘typical’ galaxies at , as detected by photometric selection techniques (Steidel et al. 1996)?
Ground-based morphological classification has been difficult, since the optically-identified submm galaxies are typically very faint and compact (Smail et al. 2004), but studies with the Hubble Space Telescope have revealed evidence for disturbed, multi-component morphologies (Conselice et al. 2003b, Smail et al. 2004, Pope et al. 2005). There have also been claims that submm sources are significantly larger than more typical field galaxies at high redshift (Chapman et al. 2003b, Smail et al. 2004, Pope et al. 2005), which would add weight to the hypothesis that these are massive galaxies in formation (Swinbank et al. 2004, Tecza et al. 2004).
In this paper we perform an independent morphological analysis on a flux-limited sample of SCUBA submillimetre galaxies from a contiguous survey field. We attempt to overcome the bias inherent in some previous studies by also seeking counterparts of submm sources which do not have a clear radio identification.
Our HST imaging is complemented by deep K-band imaging from the NIRI instrument on Gemini. In a companion paper (Targett et al. 2005, in preparation) we explore the K-band light profiles and colour gradients of submm galaxies in more detail.
The layout of this paper is as follows. In Section 2 we present the sample and observational data. In Section 3 we discuss the optical/IR identification of the submm sources, which we separate into 3 categories (secure, likely and unknown). In Section 4 we present a quantitative morphological analysis, followed by a study of galaxy sizes in Section 5. In Section 6 we briefly discuss the properties of individual galaxies before presenting our conclusions in Section 7. All optical/IR magnitudes are in the Vega system unless stated otherwise. Cosmological parameters are assumed throughout.
2 The observational data
2.1 The sample of submm galaxies
The sample of SCUBA galaxies is drawn from the study of Scott et al. (2002), which covered 260 arcmin2 over two fields (ELAIS-N2 and the Lockman-Hole) using a jiggle-mapping technique to an rms noise level of mJy per beam at m.
The catalogue of Scott et al. (2002) presents 17 sources in the ELAIS-N2 region above a significance threshold of . Following Ivison et al. (2002), we exclude one source which lies in a region where the noise is in excess of 3mJy per beam, and a further source which was not confirmed in further SCUBA imaging. This leaves a sample of 15 SCUBA submillimetre sources which form the basis of our analysis.
2.2 HST and Gemini imaging
Observations with the HST Advanced Camera for Surveys (ACS) were taken of the ELAIS-N2 field during Cycle 13111Obtained from the Space Telescope Science Institute, Program ID # 9671, PI Almaini. The data form a mosaic of 8 fields to a depth of two orbits per pointing, observed in the F814 filter. Exposure times were 4760s per tile, with the exception of one region which was observed for 4284s to accommodate a fixed roll angle (to avoid saturation from a bright star). Exposures were taken in a standard 4-pt dither pattern split over two orbits, using the DITHER-BOX configuration. Data were reduced, distortion corrected and re-drizzled onto a 0.05 arcsec pixel frame using the standard IRAF STSDAS and MULTIDRIZZLE software.
Deep K-band images were obtained on Gemini North 222Program ID GN-2002A-Q-12, PI Dunlop with the Near InfraRed Imager (NIRI), using an integration time of 90 minutes per source. Observations were made in photometric conditions with seeing arc-seconds, and consisted of a standard 9-point jitter pattern with 10 arcsec offsets. This reaches a point-source depth of approximately (5). Further details can be found in Targett et al. (in preparation).
3 Identification of optical candidates
The identification of optical candidates for the submm galaxies is presented in detail in Ivison et al. (2002). This is based on deep radio imaging at 1.4GHz taken with the Very Large Array (VLA), reaching a noise level of approximately 9Jy per beam at a resolution of 1.4 arcsec. This is combined with ground-based optical and infrared imaging from the William Herschel Telescope (WHT) and the UK Infrared Telescope (UKIRT), reaching point-source limiting magnitudes of , and infrared depths in the range . Full details are provided in Ivison et al. (2002), while a description of the near-infrared data is provided in Roche et al. (2002). Chandra X-ray observations of this field are discussed in detail in Manners et al. (2003) and Almaini et al. (2003).
On the basis of these data, combined with our deeper and band imaging from HST and Gemini, we attempt to identify the most reliable optical counterparts for further morphological study. We separate the 15 submm sources into 3 categories: those with ‘secure’, ‘likely’ and ‘unknown’ identifications.
Ivison et al. (2002) showed that 6 of the 15 sources have unambiguous radio detections, in each case identified with a clear optical or infrared counterpart. Given the low probability of a chance radio alignment (typically per cent), these are designated ‘secure’ submm identifications. All of these galaxies now have claimed spectroscopic redshifts, as described in Section 6.
Of the remaining 9 submm sources, the lack of an unambiguous radio detection makes the identification process far less certain. Ivison et al. (2002) identify one or more plausible counterparts to 8 of these sources, although the choice is often rather subjective. For the purposes of this paper we therefore follow Pope et al. (2004) and impose the additional selection criteria that submm galaxies are typically very red in (see also Smail et al. 2004). We search for such counterparts within 7 arcsec of the submm centroid, corresponding to an approximate error circle (Ivison et al. 2002). Of the 9 remaining sources, we find that 2 contain (single) galaxies that satisfy the definition of Extremely Red Objects (EROs) with and a further 2 contain ‘Very Red Objects’ (VROs), which we define as . We designate these as ‘likely’ identifications. Based on the space density of EROs and VROs to the depth of our Gemini data (), and the submm/IR offsets of our candidates, we estimate an expectation value of spurious ERO/VRO associations. This would suggest that while most of the ‘likely’ IDs are probably correct, there is a good chance that some may be chance coincidences. We will therefore treat these separately from the 6 ‘secure’ IDs in the analysis that follows.
This process leaves 5 submm sources from our sample of 15 without any radio or ERO/VRO counterpart. Since we have no reliable indication of the likely identifications in these cases (such as the coincidence with a Chandra X-ray source) we remove these from the remainder of the morphological analysis. We discuss the potential biases this may introduce in Section 7.
| SCUBA ID | mag | Redshift | C | A | M_20 | (arcsec) | (kpc) | (arcsec) | |
|---|---|---|---|---|---|---|---|---|---|
| N2_850.1 | 22.0 | 19.5 | 0.845 | 3.0 0.4 | 0.16 0.03 | -1.9 | 0.43 | 3.35 | 1.26 |
| N2_850.2 | 25.5 | 20.4 | 2.454 | - | - | - | (0.20) | (1.66) | (1.60) |
| N2_850.3 | 24.8 | 21.1 | 4.0 | 3.5 0.16 | 0.31 0.20 | -1.5 | 0.40 | 2.83 | 0.90 |
| N2_850.4 | 21.8 | 18.4 | 2.378 | 2.6 0.40 | 0.63 0.02 | -1.5 | 0.30 | 2.80 | 1.07 |
| N2_850.6 | 23.9 | 19.8 | 3.0 | 2.6 0.40 | 0.24 0.11 | -1.4 | 0.38 | 2.85 | 1.14 |
| N2_850.7 | 22.4 | 19.5 | 1.488 | 3.1 0.30 | 0.33 0.09 | -1.6 | 0.54 | 4.55 | 1.75 |
| N2_850.8 | 21.6 | 18.2 | 1.190 | 3.6 0.30 | 0.50 0.03 | -2.1 | 0.54 | 4.45 | 1.82 |
| N2_850.9 | 25.1 | 20.8 | 3.4 | 2.5 0.30 | 0.16 0.11 | -1.5 | 0.45 | 3.36 | 1.82 |
| N2_850.12 | 24.2 | 20.6 | 2.425 | 3.1 0.40 | 0.16 0.11 | -2.5 | 0.36 | 2.96 | 1.53 |
| N2_850.13 | 25.5 | 20.9 | 2.283 | - | - | - | (0.42) | (3.45) | (1.32) |
4 Quantitative morphological analysis
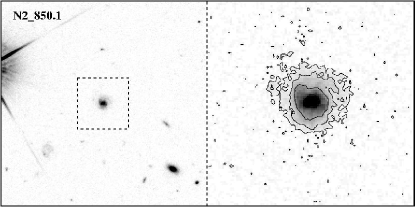
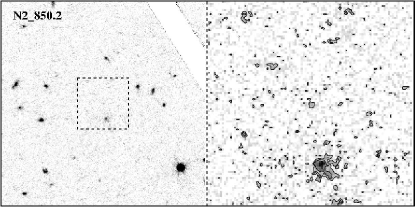
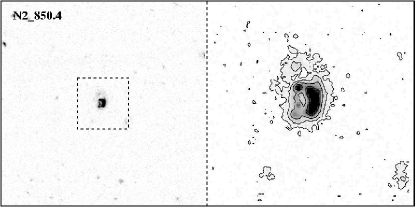
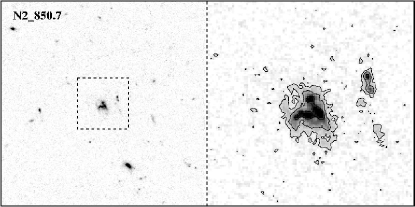
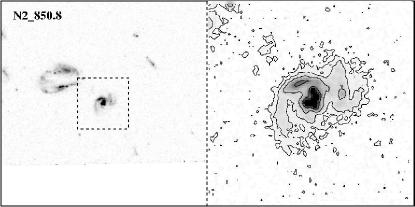
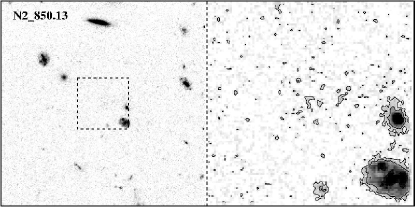
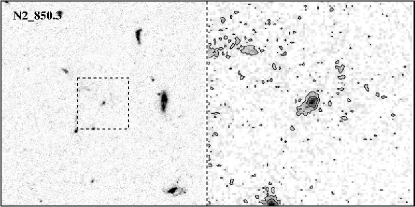
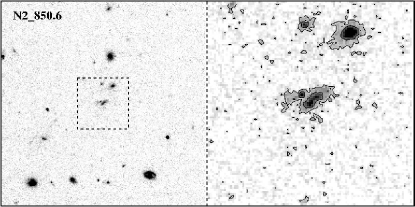
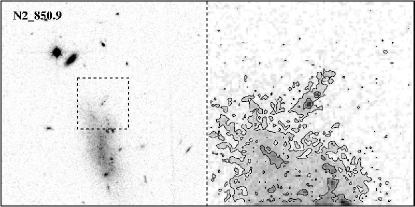
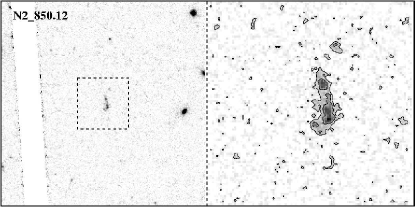
Postage stamp HST images for our sample are shown in Figures 1 & 2. A visual inspection of the 6 secure submm galaxies (Figure 1) reveals three sources with clear evidence of disturbed, possibly merging morphology, one face-on disk system and two very faint ERO galaxies. Of the 4 ‘likely’ IDs (Figure 2) all appear to be faint compact systems, with at least two showing evidence for disturbed morphologies by eye. Most of the galaxies also appear very compact and sharply peaked in their light distribution.
To conduct a more quantitative assessment of their morphologies we adopt the CAS (concentration, asymmetry and clumpiness) structural analysis system developed by Conselice (2003). One advantage of this technique is the ability to trace structural features that can be related to past and present star formation and merger activity. A rest-frame optical/UV asymmetry value in excess of was found to be a robust indication of a major merger at (Conselice et al. 2003a), while the concentration index is found to be a fair representation of scale of a galaxy and the fraction of stars in a bulge component (Graham et al. 2001; Conselice 2003).
Two of the ‘secure’ submm galaxies ( and ) are too faint to produce converging CAS parameters in our I-band HST imaging. Both are ERO galaxies with . We therefore exclude these galaxies from the morphological analysis, although we present an examination of their K-band light profiles in Targett et al. (in preparation).
4.1 Structural comparison with local galaxy populations
In Figure 3 the concentration/asymmetry parameters for our submm galaxies are compared to those of local galaxy populations, following the method of Conselice, Chapman & Windhorst (2003b).
To perform a fair comparison with local galaxy populations it is first important to determine how the measured morphology of a local galaxy would change when shifted to the rest-frame UV and observed at high-redshift with the ACS camera. These corrections were determined using simulations, artificially redshifting 50 nearby ULIRGs and 82 normal Hubble types to examine how they would appear in our ACS images at redshifts . The resolution and surface brightness are degraded, and noise is added to match the real data. A full description of this technique is outlined in Conselice (2003) and Conselice et al. (2003b). Using these new images, CAS parameters are then re-measured for the simulated galaxies, in the same manner as the submm galaxies, in order to determine appropriate redshift corrections.
Based on these simulations, we can correct the CAS parameters of the submm galaxies to those of local galaxies. The most conservative approach is to adopt the redshift corrections appropriate for normal spiral galaxies, which change least in their CAS values after redshifting (e.g. , at compared to ). For the three submm galaxies without spectroscopic redshifts (all in the ‘likely’ category) we use photometric redshifts (see Section 6.2) but limit the C/A corrections to the maximum value appropriate to (, ). The resulting comparison is shown in Figure 3.
The most striking finding is that the submm sources are significantly more asymmetric than one would expect for local spiral or elliptical galaxies, and are much more similar in concentration and asymmetry to local ULIRGS. A one-dimensional KS test along the asymmetry axis rejects the null-hypothesis that submm sources are drawn from the populations of local elliptical and spiral galaxies at and per cent significance respectively. The same comparison with ULIRG asymmetry values yields no significant difference.
Using the major merger criteria calibrated in Conselice et al. (2003a) for galaxies () we find that are classified as major mergers. Allowing for the two galaxies which were too faint to classify this becomes a minimum fraction of . We note that these fractions are formed by taking the conservative assumption that the CAS redshift corrections for the submm sources are the values appropriate for normal galaxies. Instead, if we assume the ULIRG redshift correction then the submm asymmetry values shown in Figure 3 would increase by , and the merger fraction would be substantially higher. We conclude that at least 60 per cent of the submm galaxies with secure/likely IDs are classified as mergers.

4.2 Comparison with Lyman-break galaxies

While it is clear that the submm galaxies are morphologically distinct from normal low-redshift galaxies, it is also valuable to perform a comparison with ‘normal’ galaxies at more comparable redshifts. Such galaxies are arguably the Lyman-break galaxy (LBG) population, first detected in large numbers in the pioneering work of Steidel et al. (1996).
In Figure 4 we compare the concentration/asymmetry parameters for the submm galaxies with those of photometrically-selected galaxies in the Hubble Deep Field North (HDF-N) in the redshift range , for which CAS parameters have already been determined in the work of Conselice et al. (2003). We find that submm galaxies show a tendency towards higher concentrations and greater asymmetries. A Kolmogorov-Smirnov (KS) test can reject the null hypothesis that they are drawn from the same distribution in asymmetry with a confidence level of per cent. In concentration, the KS test can reject the corresponding null hypothesis more strongly, at per cent confidence.
Since the LBGs cover a wide range in luminosity (), we separate these into high and low luminosity sub-samples (at ) and repeat the KS comparison with the submm galaxies. We find that the difference in asymmetry is largely due to the low-luminosity LBGs, and formally do not find a significant difference with the high-luminosity sub-sample. This is consistent with the findings of Conselice, Chapman & Windhorst (2003), where it was found that the major merger fraction among submm sources is similar to that of the most luminous Lyman-break galaxies. Interestingly, however, the difference in concentration distributions remains similar for both LBG sub-samples (significant at per cent in each case).
4.3 analysis
A new morphology estimator, the index, has recently been developed by Lotz, Primack & Madau (2004). This is defined as the second-order moment of the brightest 20 per cent of light, and was found to be a sensitive indicator of merger signatures such as multiple nuclei. For completeness, we include measurements of the index in Table 1. We find a broad range of values for the submm galaxies, with a median value of . By comparison with the study of Lotz, Primack & Madau (2004), we find that these are intermediate between those of normal galaxies () and ULIRGs (). This suggests a mixture of morphological types, with a tendency for submm galaxies to have morphologies more like ULIRGs than normal local galaxies, which is consistent with the findings of the C/A analysis given above.
5 Half-light radii and physical sizes
5.1 Measuring galaxies sizes
The process of measuring size scales for faint galaxies can be prone to a number of systematic biases. Traditional methods use the radius at which a certain isophotal surface-brightness is reached, but these can be prone to uncertainties in the photometric zero-point. Such measurements are also not robust for studying faint and/or low-surface brightness objects, particularly when comparisons are made over a wide range in redshift, due to the strong surface-brightness dimming. We have therefore adopted the technique of Bershady et al. (2000), which uses a non-isophotal method to define the total-aperture magnitude, independent of the surface-brightness distribution and the photometric calibration. This is based on a dimensionless parameter which is defined as the ratio of the average surface brightness within radius to the local surface brightness: . We define the Petrosian radius , following Conselice (2003). The half-light radius () is then obtained at the radius which encloses half of this total-light value.
For comparison we also measure half-light radii using a standard curve-of-growth technique. This was found to give virtually identical values to the method outlined above (typically within pixel). As a third test, we also obtained half-light radii using the output from the SExtractor software (Bertin & Arnouts 1996). In some cases this required some tuning of the deblending parameters to prevent the software from separating multi-component features into separate objects. These resulting values for were found to be in generally good agreement with the other methods, although on average arcsec smaller. We believe this difference is due to the SExtractor software measuring features within a segmentation map which effectively truncates the outer regions of a galaxy. We stress, however, that this small difference does not affect any of the conclusions presented here.
Since these techniques are broadly consistent, hereafter we adopt the half-light and Petrosian radii measured using the first method. These are presented in Table 1.

5.2 Comparison with field galaxies and LBGs

In Figure 5 we plot submm galaxy sizes as a function of redshift. For the three galaxies without spectroscopic redshifts (all in the ‘likely’ category) we use photometric redshifts provided by I. Aretxaga (private communication; see Section 6.2). For comparison, the curve shows the mean half-light radii for field galaxies as a function of redshift from the study of Ferguson et al. (2004), which is based on HST ACS observations of the GOODS deep fields. Galaxies in this study were restricted to rest-frame luminosities in the range (where is the characteristic luminosity of a LBG from Steidel et al. 1999). They found that the mean size evolution can be well described by a function of the form , where is the Hubble parameter. Although our submm sample is small, it is notable that we see no clear difference in average size compared to the LBG population (Figure 5). There is marginal evidence that the highest redshift () submm galaxies lie above the LBG relation, but since these all have uncertain optical IDs it is impossible to draw firm conclusions.
As a second test, in Figure 6 we compare both half-light and Petrosian radii with the LBG study of Conselice et al. (2003b), the same sample used in the morphological comparison in Figure 4. This has the advantage that we are evaluating the and values in precisely the same manner as the submm galaxies, and all based on observations in the HST F814 filter. Since the LBGs cover a wide range in luminosity () we once again split the sample into two subsets. In terms of both half-light and Petrosian radii, the submm galaxies are consistent with the distribution of sizes seen in either class of LBG (as confirmed by a a KS test). For the most luminous LBGs with (absolute magnitudes ) we find a mean half-light radius of kpc, while the fainter sample give kpc (where errors reflect the standard deviation, not the error on the mean). For comparison, our submm galaxies yield kpc. Restricting the sample to the ‘secure’ IDs, we obtain kpc. We conclude that the submm galaxies have mean radii that are between those of faint and luminous LBGs, although statistically they are indistinguishable from either class.
5.3 Comparison with previous studies of submm galaxies
At face value, our results appear to be in contrast to previous studies (Chapman et al. 2003b, Smail et al. 2004, Pope et al. 2004) which report that submm galaxies are typically larger than LBGs, perhaps by up to a factor of two. In this section we briefly compare our findings with these previous papers.
Our distribution certainly differs from the study of Smail et al. (2004), who present sizes for galaxies in the GOODS-N field. (a mixture of submm galaxies and optically-faint radio galaxies). Of these, they report with half-light radii in excess of arcsec. In contrast, none of the galaxies in our study have values exceeding arcsec. According to a KS test, the probability that our galaxies are drawn from the same underlying distribution is less than 1 per cent, suggesting a clear difference between our samples.
Chapman et al. (2003b) present a study of submm galaxies, and both half-light and Petrosian radii are tabulated. According to KS tests, our samples are statistically indistinguishable using either radius measurement. The only notable difference is the mean value for the Petrosian radii, which is arcsec in their work compared to arcsec from our sample. In Chapman et al. (2003b) their large mean Petrosian value is compared to the mean value for LBGs in the HDF-N ( arcsec) as evidence that submm galaxies are larger. We note, however, that this mean value is dominated by two galaxies which are substantially larger than the rest in their sample, with Petrosian radii of and arcsec. Both are multiple-component systems, one of which is also in the sample of Smail et al. 2004. If instead we compare median Petrosian radii, the Chapman et al. sample yields arcsec, which is in good agreement with the median value for LBGs and formally smaller than the median value for our sample ( arcsec).
Pope et al. (2004) quote only Petrosian radii, and again a KS test reveals no statistically significant difference compared to our study. The mean value from their sample is arcsec, which is marginally smaller than our sample mean of arcsec. The GOODS HST data used in their paper is deeper than our observations, so a fairer comparison would be to restrict the Pope et al. sample to those with , which is comparable to the limits of our data. A KS test again reveals no difference, although formally their mean value is now closer to ours at arcsec. No comparison with LBGs is made, but it is reported that submm galaxies are generally larger than field galaxies in the HDF-N. However, this conclusion is based on a sub-sample (those which are either optically-bright and/or at ), and has a statistical significance of only .
In summary, we conclude that the submm galaxy radii measured in previous studies are broadly consistent with our findings. Only the work of Smail et al. (2004) presents galaxies which are significantly larger than our findings. We also note that the previous studies have strongly overlapping samples. We therefore suggest that the perceived wisdom that submm galaxies are larger than LBGs is so far inconclusive. A fairer statement may be that submm galaxies show a wider variance in properties compared to LBGs, but further (independent) studies are clearly required before firm conclusions can be drawn.
6 Notes on individual sources
These brief notes are designed to complement the descriptions given in Ivison et al. (2002), where further information on these submm galaxies can be obtained.
6.1 Secure identifications
N2_850.1: This is the brightest submm source in the field, associated with a close pair of radio sources. A relatively bright, compact galaxy is aligned with the brightest knot of radio emission, which was subsequently found to lie at a redshift (Chapman et al. 2005). The 450/850m flux ratios would then imply a surprisingly low dust temperature (K at ), so it has been suggested that this could be evidence for strong gravitational lensing by a massive, compact foreground galaxy (see Ivison et al. 2002, Chapman et al. 2002). Our observations would appear to rule out this strong-lensing hypothesis, since the HST imaging reveals this to be a clear face-on spiral galaxy (which was not clear from ground-based data). The integrated mass density from a face-on spiral would not be sufficient to cause strong gravitational lensing (Moller & Blain 1998). However, we note that a faint knot of optical emission is resolved at approximately the location of the weaker radio source, approximately 1 arcsec east of the galaxy centre. While more likely to be a knot of star-formation in a spiral arm, this could plausibly be associated with a more distant background object. There is therefore a slim possibility of a chance alignment with the bright foreground galaxy, although we estimate the probability of a chance coincidence with a radio-emitting galaxy of this optical magnitude to be per cent. We note, however, that this is a region of strongly enhanced foreground galaxy density, where the probability of a chance alignment could be enhanced by the more subtle effects of weak gravitational lensing bias (Almaini et al. 2005).
N2_850.2: This submm source is associated with a close pair of ERO galaxies. The northern (optically-fainter) ERO is associated with the radio emission and hence the likely source of submm emission. Chapman et al. (2005) find a redshift
N2_850.4: This is a well-studied submm galaxy at , examined in detail by Smail et al. (2003) and Swinbank et al. (2004). HST reveals a clearly disturbed multiple-component morphology (formally the most asymmetric galaxy in the sample; see Table 1). Spatially resolved spectroscopy shows evidence for vigorous starburst activity, an active Seyfert component and a galactic-scale starburst driven wind (Swinbank et al. 2004).
N2_850.7: HST reveals an unambiguous merger system, with a highly distorted morphology and possibly 3 distinct components. Chapman et al. (2004) find a redshift .
N2_850.8: This is the only submm source detected in X-rays by Chandra (Almaini et al. 2003). The X-ray luminosity and spectrum suggest an absorbed, moderate luminosity AGN. Ground-based imaging indicated only a very compact galaxy, but this is spectacularly revealed by HST as a face-on spiral with a bright, highly distorted nucleus. At least two compact nuclei can be distinguished, strongly suggesting a recent major merger. Chapman et al. (2005) find a redshift of . Some association with the nearby ring galaxy seems likely, which is confirmed by Chapman et al. (2005) to lie at the same redshift.
N2_850.13: A strong radio source is associated with an optically faint ERO, barely detected by HST but with a distorted K-band morphology (Targett et al., in preparation). Chapman et al. (2005) report a redshift and classify this as an AGN.
6.2 Likely identifications
For completeness, we include brief notes on the galaxies classified as ‘likely’ identifications (see Section 3), although we stress that these should be treated with some caution. Three of these galaxies do not have a spectroscopic redshift, so we use photometric redshifts from Aretxaga et al. (private communication; see also Aretxaga et al. 2005). These are based on a combination of radio, mm and submm photometry, and do not depend on the uncertain optical/IR counterparts.
N2_850.3 A faint red galaxy, classified as a VRO (). A photometric redshift from Aretxaga et al. (private communication) suggests . Our HST ACS imaging reveals a compact, asymmetric light profile.
N2_850.6 A very red galaxy, classified as an ERO (), with a photometric redshift estimate of (Aretxaga et al., private communication). HST reveals a distorted, multiple-component morphology.
N2_850.9 This source is in the ‘likely’ category since there are two possible radio counterparts to the submm emission. One is associated with a low-redshift, low surface-brightness (LSB) galaxy, and the other is associated with a faint, red ERO to the north, with extreme colours (). Ivison et al. (2002) choose the LSB galaxy as a ‘plausible’ ID, while in this paper we favour the faint ERO. We select the ERO following the argument outlined in Section 3, noting also that this object clearly stands out in the K-band image (where the LSB is barely detected). Furthermore, the radio/mm/submm photometric redshift yields (Aretxaga et al., in private communication) which would not be consistent with the LSB galaxy.
N2_850.12 An elongated irregular galaxy, identified as VRO (). This is also a weak radio source, although not a formally significant radio-submm association (Ivison et al. 2002). Near-infrared spectroscopy reveals a redshift (Simpson et al. 2004), which is consistent with a photometric estimate of from Aretxaga et al. (2005).
7 Summary and Conclusions
We present high-resolution HST ACS imaging of a sample of 10 SCUBA submillimetre galaxies. These are drawn from an initial flux-limited sample of 15 submm sources from a contiguous field in the ELAIS-N2 region (Scott et al. 2002). We find that we can assign secure optical/IR identifications to 6 submm sources with unambiguous radio detections, and ‘likely’ counterparts to a further 4 which are associated with ERO/VRO galaxies.
A large fraction of the submm galaxies show disturbed, compact, multi-component morphologies. In many cases these distorted morphologies were not revealed with ground-based imaging. Using the CAS system of quantitative morphological classification, we find that at least are classified as major mergers. Simulations suggest that the morphological parameters are very different in appearance to local spiral and elliptical galaxies, in particular by being significantly more asymmetric in their light distribution. The morphological parameters are, however, similar to those of local ULIRGs.
A comparison with typical high-z field galaxies (the Lyman-break population) shows that the submm galaxies are on average more asymmetric and also significantly more concentrated in their light distribution. This difference in asymmetry drops if we restrict the comparison to the most luminous Lyman-break galaxies, but the difference in concentration remains and appears to be a clear difference between these populations.
The submm galaxies display a narrow range of half-light radii in the range kpc. These sizes are consistent with measurements of ‘typical’ LBGs at , and we reach the same conclusion using Petrosian radii. We therefore cannot support previous claims that submm galaxies are significantly larger than LBGs (Chapman et al. 2003b, Smail et al. 2004, Pope et al. 2005). We find that the sizes reported in previous studies are broadly consistent with ours, so we suggest that the perceived wisdom that submm galaxies are larger than LBGs is far from conclusive.
We note that we have been forced to exclude 5 submm sources without reliable optical/IR counterparts, either because they were not detected as radio sources or as ERO/VRO galaxies to the limit of our optical/IR data. A further 2 were excluded from the morphological analysis since they were too faint to give meaningful values. These effects are likely to bias us against the highest redshift systems, so formally our conclusions are restricted to the optically-bright () low-redshift () submm galaxies.
In summary, our observations lend support to the growing realisation that many submm sources are triggered by major mergers. These galaxies also appear morphologically distinct from more typical Lyman-break galaxies, with notably more concentrated light profiles. We speculate that this could be due to a higher fraction of stellar mass in the form of a central spheroidal component.
ACKNOWLEDGMENTS
We are grateful to Alfonso Aragón-Salamanca, Meghan Gray, Kyle Lane and Jennifer Lotz for useful discussions. We are also indebted to Itziar Aretxaga for providing photometric redshifts in advance of publication. OA and RJM acknowledge the generous support of the Royal Society. TAT acknowledges the award of a PPARC studentship. This work is based on observations made with the NASA/ESA Hubble Space Telescope, obtained from the data archive at the Space Telescope Science Institute. STScI is operated by the association of Universities for Research in Astronomy, Inc. under the NASA contract NAS 5-26555. This work is also based on observations obtained at the Gemini Observatory, which is operated by the Association of Universities for Research in Astronomy, Inc., under a cooperative agreement with the NSF on behalf of the Gemini partnership: the National Science Foundation (United States), the Particle Physics and Astronomy Research Council (United Kingdom), the National Research Council (Canada), CONICYT (Chile), the Australian Research Council (Australia), CNPq (Brazil) and CONICET (Argentina).
References
- [1] Alexander, D.M., et al., 2003, AJ, 125, 383
- [2] Alexander, D.M., et al., 2005, Nature, 434, 738
- [3] Almaini O. Lawrence A., Boyle B.J., 1999, MNRAS, 305, L59
- [4] Almaini O., et al., 2003, 338, 303
- [5] Almaini O., Dunlop J.S., Willott C.J., Alexander D.M., Bauer F.E., Liu C.T., 2005, MNRAS, 358, 875
- [6] Aretxaga I., Hughes D.H., Dunlop J.S., 2005, MNRAS, 358, 1240
- [7] Baugh C.M., et al.. 2005, MNRAS, 356, 1191
- [8] Barger, A., et al., 1998, Nat, 394, 248
- [9] Bershady M.A., Jangren A., Conselice C.J., 2000, AJ, 119, 2645
- [10] Bertin E., Arnouts S., 1996, A&AS, 117, 393
- [11] Blain A.W., Moller O., Maller A.H., 1999, MNRAS, 303, 423
- [12] Chapman S.C., Smail I., Ivison R.J., Blain A.W., 2002,
- [13] Chapman S.C., Blain A.W., Ivison R.J., Smail I., 2003a, Nature, 422, 695 MNRAS, 335, L17
- [14] Chapman S.C., Windhorst R., Odewahn S., Yan H., Conselice C., 2003b, ApJ, 599, 92
- [15] Chapman S.C., Blain A.W., Ivison R.J., Smail I., 2005, ApJ, in press (astro-ph/0412573)
- [16] Conselice C.J., Bershady M.A., Jangren A., 2000, ApJ, 529, 886
- [17] Conselice C.J., 2003, ApJS, 147, 1
- [18] Conselice C.J., Bershady M.A., Dickinson M., Popovich C., 2003a, AJ, 126, 1183
- [19] Conselice C.J., Chapman S.C., Windhorst R.A., 2003b, ApJ, 596, L5
- [20] Dunlop J.S., 2001, Lowenthal J., Hughes D.H., eds, DeepProc. UMass/INAOE Conf., Deep Millimeter Surveys: Implications for Galaxy Formation and Evolution. World Scientific, Singapore, p. 11
- [21] Eales, S., et al., 1999, ApJ, 515, 518
- [22] Fabian, A.C., et al., 2000, MNRAS, 315, L8
- [23] Ferguson H., et al., 2004, ApJ, 600, L107
- [24] Graham A.W., Trujillo I., Caon N., 2001, AJ, 122, 1707
- [25] Granato, G.L., et al., 2001, MNRAS, 324, 757
- [26] Hughes D.H., et al., 1998, Nat, 394, 241
- [27] Ivison R.J., et al., 2002, MNRAS, 337, 1
- [28] Lilly S.J. et al. 1999, ApJ, 518, 641
- [29] Lotz J.M., Primack J., Madau P., 2004, AJ, 128, 163
- [30] Manners J.C., et al., 2003, MNRAS, 343, 293
- [31] Moller O., Blain A.W., 1998, MNRAS, 299, 845
- [32] Pope A., Scott D., Borys C., Conselice C., Dickinson M., Mobasher B., 2005, MNRAS, 358, 149
- [33] Roche N.D., Almaini O., Dunlop J.S., Ivison R.J., Willott C.J., 2002, MNRAS, 337, 1282
- [34] Sanders D.B., Mirabel I.F., 1996, ARA&A, 34, 749
- [35] Scott, S.E., et al., 2002, MNRAS, 331, 817
- [36] Severgnini, et al., 2000, A&A, 360, 457
- [37] Simpson C., Dunlop J.S., Eales S.A., Ivison R.J., Scott S.E., Lilly S.J., Webb T.M.A., 2004, MNRAS, 353, 179
- [38] Smail, I., Ivison R.J., Blain A.W., 1997, ApJ, 490, L5.
- [39] Smail, I., Chapman S.C., Blain A.W., Ivison R.J., 2004, ApJ, 616, 71
- [40] Steidel C.C., Giavalisco M., Pettini M., Dickinson M., Adelberger K.L., 1996, ApJ, 462, L17
- [41] Steidel C.C., Adelberger K.L., Giavalisco M., Dickinson M., Pettini M., 1999, ApJ, 519, 1
- [42] Swinbank A.M., Smail I., Chapman S.C., Blain A.W., Ivison R.J., Keel W.C., 2004, ApJ, 617, 64
- [43] Tecza M., et al., 2004, ApJ, 605, L109
- [44] Waskett T.J., et al., 2003, MNRAS, 341, 1217