1]INAF-Osservatorio Astronomico di Brera, via Brera 28, I-20121 Milan, Italy 2]Johns Hopkins University, 3400 N. Charles Street, Baltimore, MD 21218,USA 3]on behalf of the XMM-Newton SSC collaboration
The Bright Side of the hard X-ray Sky: The XMM-Newton Bright Survey
Abstract
We discuss here the main goals and some interesting results of the “XMM-Newton Bright Serendipitous Survey”, a research program conducted by the XMM-Newton Survey Science Center 111The MM-Newton Survey Science Center (SSC, see http://xmmssc-www.star.le.ac.uk.) is an international collaboration, involving a consortium of 10 institutions, appointed by ESA to help the SOC in developing the software analysis system, to pipeline process all the XMM-Newton data, and to exploit the XMM serendipitous detections. The OABrera is one of the Consortium Institutes. in two complementary energy bands (0.5–4.5 keV and 4.5–7.5 keV) in the bright (above erg cm-2 s-1) flux regime. The very high identification rate (96%) for the X-ray source sample selected in the 4.5–7.5 keV band is used here to have, in this energy range, an “unbiased” view of the extragalactic hard X-ray sky at bright fluxes.
keywords:
Diffuse X-ray Background – X-ray Surveys– Active Galactic Nuclei1 Introduction
Deep Chandra and XMM–Newton observations have resolved % and % of the 0.5–5 keV and 5–10 keV cosmic X-ray background (CXB) into discrete sources down to 10-16 erg cm-2 s-1 and 10-15 erg cm-2 s-1, respectively (Worsley et al. 2005 and reference therein).
The X–ray data (stacked spectra and hardness ratios) of these faint samples are consistent with AGN being the dominant contributors to the CXB (Brandt & Hasinger 2005 and references therein; G. Hasinger and Y. Ueda contributions to this meeting) and, as inferred by the X–ray colors, a significant fraction of these sources have hard, presumably obscured, X–ray spectra, in agreement with the predictions of CXB synthesis models (Setti and Woltjer 1989; Comastri et al. 2001; Gilli et al. 2001; Ueda et al. 2003; Treister & Urry 2005).
On the other hand, the majority of the sources found in medium to deep fields are too faint to provide good X–ray spectral information. Furthermore, the extremely faint magnitudes of a large number of their optical counterparts make the spectroscopic identifications very difficult, or even impossible, with the present day ground–based optical telescopes. Thus, notwithstanding the remarkable results obtained by reaching very faint X–ray fluxes, the broad–band physical properties (e.g. the relationship between optical absorption and X-ray obscuration and the reason why AGN with similar X-ray properties have completely different optical appearance) are not yet completely understood. In the medium flux regime a step forward toward the solution of some of these problems has been undertaken by Mainieri et al. (2002), Piconcelli et al. (2003), Perola et al. (2004) and Mateos et al. (2005).
With the aim of complementing the results obtained by medium to deep X-ray surveys, we have built the “The XMM-Newton Bright Serendipitous Source Sample” (Della Ceca et al. 2004). We describe below the main characteristics of this sample and discuss some of the results obtained so far. The contribution of this project to the solution of some critical open (and “hot”) questions like the relationship between optical absorption and X-ray obscuration and the physical nature of the “X-ray bright optically normal galaxies” have been already discussed in Caccianiga et al. (2004) and Severgnini et al. (2003), respectively. We stress that many of these issues are investigated with difficulties when using the fainter X-ray samples because of the typical poor counts statistics available for each source. Here we consider the cosmological model with (,,)=(65,0.3,0.7).
2 The XMM-Newton Bright Serendipitous Source Sample
The XMM Bright Serendipitous Source Survey, a project led by the Osservatorio Astronomico di Brera, consists of two flux-limited samples: the XMM BSS and the XMM HBSS sample having a flux limit of erg cm-2 s-1 in the 0.5–4.5 keV and 4.5–7.5 keV energy bands, respectively. This approach was determined by the need of studying the composition of the source population as a function of the selection band and in order to reduce the strong bias against absorbed sources. which occurs when selecting in soft X-rays.
Two-hundred and thirty-seven suitable XMM fields (211 for the HBSS) at deg were analyzed and a sample of 400 sources was selected (see Table 1 for details and Della Ceca et al. 2004).
| BSS | HBSS | |
| Objects1 | 389 | 67 |
| Area Covered (deg2) | 28.10 | 25.17 |
| Identified | 308 | 64 |
| Identification rate | 79% | 96% |
| AGN-1 | 201 | 38 |
| AGN-2 | 29 | 20 |
| Galaxies2 | 8 | 1 |
| Clusters of Galaxies 3 | 6 | 1 |
| BL Lacs | 6 | 2 |
| Stars4 | 58 | 2 |
1 Fifty-six sources are in common between the BSS and HBSS samples; 2 we stress that some of the sources classified as “Optically Normal Galaxy” could indeed host an optically elusive AGN (Severgnini et al. 2003); 3 the source detection algorithm is optimized for point-like objects, so the sample of clusters of galaxies is not statistically complete nor representative of the cluster population; 4 all but one of the sources classified as stars are coronal emitters. The stellar content of the XMM-BSS has been presented to this meeting by J. Lopez-Santiago.
It is worth noting that among the ongoing surveys performed with Chandra and XMM-Newton the XMM BSS survey is currently covering the largest area; furthermore, unlike deep pencil beam surveys, the XMM BSS is unbiased by problems connected to the cosmic variance.
The majority of the BSS X-ray sources have enough statistics (hundreds to thousands counts when the data from the three EPIC detectors are considered) to allow X-ray studies in terms of energy distributions, absorption properties, source extent and flux variability. Moreover the optical counterpart of % of the X-ray sources has a magnitude brighter than the POSS II limit (R 21mag), thus allowing spectroscopic identification at a 2-4 meter class telescope; this fact, combined with the XMM positional accuracy for bright sources (90% error circle of 4′′) implies that, in almost all cases, only one object needs to be observed to secure the optical identification.
Up to now 318 X-ray sources have been spectroscopically identified (220 sources from our own observations and the remaining from the literature) leading to a 79% and 96% identification rate for the BSS and HBSS samples respectively (see Table 1 for a summary). The optical selection criteria for the spectroscopic classification have been discussed in Caccianiga et al. (2004) and Della Ceca et al. (2004); a full description of the optical properties of the sources will be presented in Caccianiga et al., in preparation.
3 The HBSS sample
The HBSS sample is now almost completely identified ( of spectroscopic identifications with only three sources currently unidentified), therefore it can be used to have an unbiased view of the high galactic ( deg) 4.5–7.5 keV sky in the bright flux regime. First results, based on a complete subsample of 28 objects completely identified, have been already discussed in Caccianiga et al. (2004). We stress that an identification rate around 80% (as e.g. in the BSS sample or in other samples appeared in literature) could be not enough to have this unbiased view. Indeed, interesting classes of X-ray emitting sources (e.g. the narrow line AGN population), which could represent an important minority of the source population, could be more difficult to identify. We concentrate here the discussion on three main results concerning the HBSS sample: the 4.5–7.5 keV extragalactic number-flux relationship, the position of the AGN sample in the - plane, and the correlation between X-ray colours and intrinsic .
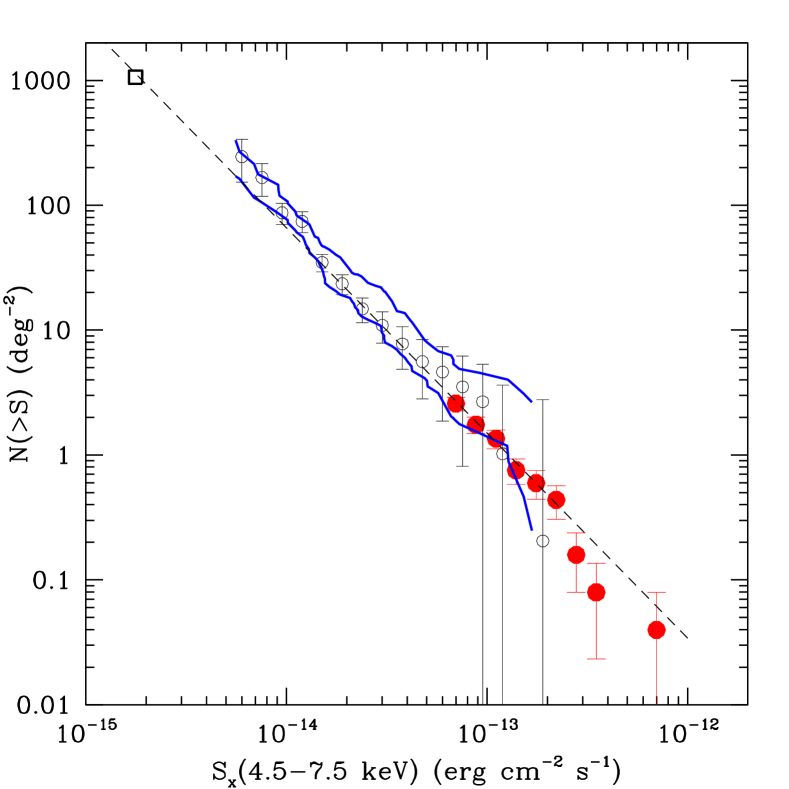
3.1 The 4.5–7.5 keV extragalactic number-flux relationship
In Fig. 1 we compare the extragalactic number-flux relationship in the 4.5–7.5 keV energy band obtained using the HBSS sample (binned representation: filled circles) with other XMM-Newton based Log(NS)LogS, obtained in a similar energy domain: the agreement is very good making us confident about the reliability of the data selection and analysis. Furthermore, since we are covering the largest area in the bright flux regime we are able to set the most stringent constraints on the extragalactic source surface densities above ergs cm-2 s. In Fig. 1 we have also reported the best fit power-law Log(NS)LogS obtained using the HBSS source sample (Della Ceca et al. 2004) extrapolating it down to ergs cm-2 s; it is clear that we have no compelling evidence of a flattening of the 4.5–7.5 keV energy extragalactic number-flux relationship down to the flux limits sampled so far.
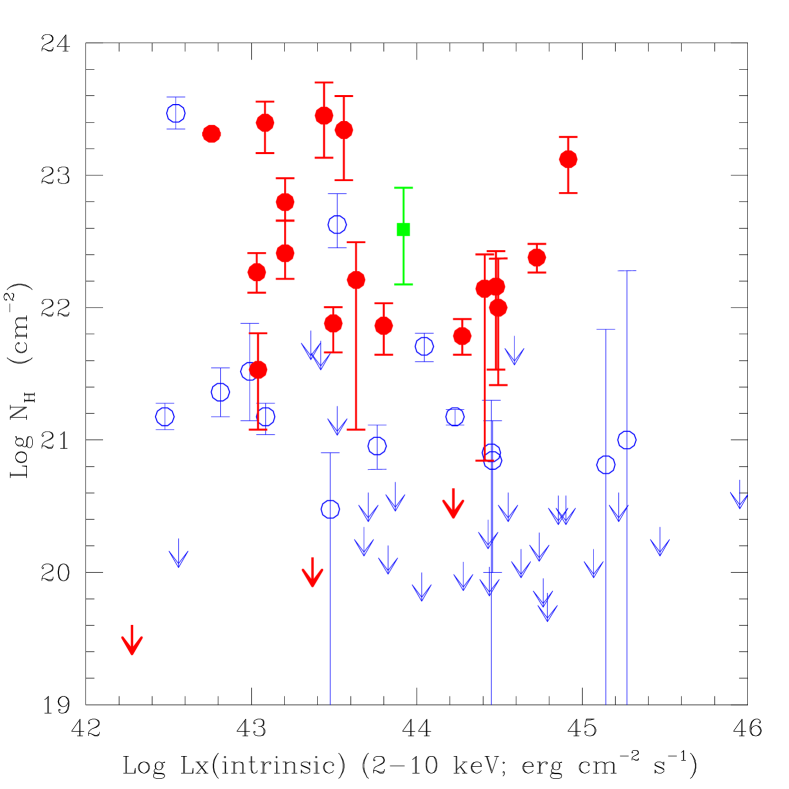
3.2 The plane
In Fig. 2 we show the intrinsic versus intrinsic for the sources belonging to the HBSS sample. Both the intrinsic 2-10 keV luminosity (e.g. de-absorbed from the measured at the source redshift) and the intrinsic have been derived from a complete X-ray spectral analysis using, when possible, data from all the three instruments on-board XMM-Newton (MOS1, MOS2, pn).
As already discussed in Caccianiga et al. (2004) some hot questions
could be investigated from a close inspection of Fig. 2, especially
considering the fact that we are dealing with a well defined and complete
sample which has been almost completely identified.
The main results can be summarized in these points:
We do not find a strong evidence of a large population of absorbed ( cm-2) optically Type 1 AGN. We only have two objects belonging to this category, i.e. about of the total extragalactic population and of the Type 1 AGN population shining in the 4.5–7.5 keV sky at the sampled fluxes. For one of these two objects the X-ray spectra could also be described by a typical Type 1 AGN power-law model with a large relativistic iron line; a deeper investigation (using all the data in the XMM archive) is in progress to asses the presence of intrinsic absorption. The other absorbed object is a nearby (z=0.019) and well known Narrow Line Seyfert 1 galaxy (MKN 1239) studied in X-ray also by Grupe et al. (2004) using pointed XMM observations;
Among optically Type 2 AGN about 65% are characterized by an cm-2, 20% by an between and cm-2 and 15% are apparently unabsorbed ( cm-2; the three objects marked with thick arrows). Two unabsorbed sources have an intrinsic luminosity of ergs sand ergs sand are both classified as Seyfert 1.9. The latter unabsorbed Type 2 AGN is apparently a high luminosity ( ergs s) narrow line AGN although, unfortunately, the line is not sampled at the moment. Similar unabsorbed Type 2 QSOs have been discussed in Wolter et al. (2005) (see also the A. Wolter contribution to this meeting);
As already found by other surveys we note a strong deficiency of the number of high luminosity ( erg s-1) absorbed ( cm-2) AGN, the so called absorbed Type 2 QSOs predicted to be a consistent number by the synthesis models of the CXB. The HBSS sample lists 5 Type 2 QSOs with 4 of them having an absorbing column density in a narrow range between cm-2 and cm-2;
At the fluxes covered by the HBSS survey the 4.5–7.5 keV selection is an efficient way to sample AGN with absorbing column densities up to cm-2. Furthermore we have no strong evidence of cm-2 (e.g. the presence of a strong iron line) for the three optically Type 2 AGN that are unabsorbed in the X-ray regime. Therefore, unless some of our absorbed objects are characterized by a dual absorber model (with an absorbed component not visible below 10 keV) we do not find Compton thick AGN. A new, unexpected and interesting result is that very few Compton thick AGN seem also to emerge from the Swift/BAT and INTEGRAL surveys of the hard (20-100 kev) sky above a flux limit of ergs cm-2 s(see V. Beckmann and R. Mushotzky contributions to this meeting). We are now evaluating if the results from the HBSS can be used to constraint the density of the elusive Compton thick AGN at fainter fluxes;
We only have one object that is optically classified as normal galaxy, but the line is not sampled at the moment. Its absorbing column density and luminosity are highly indicative of the presence of an absorbed AGN. A deeper investigation is in progress.
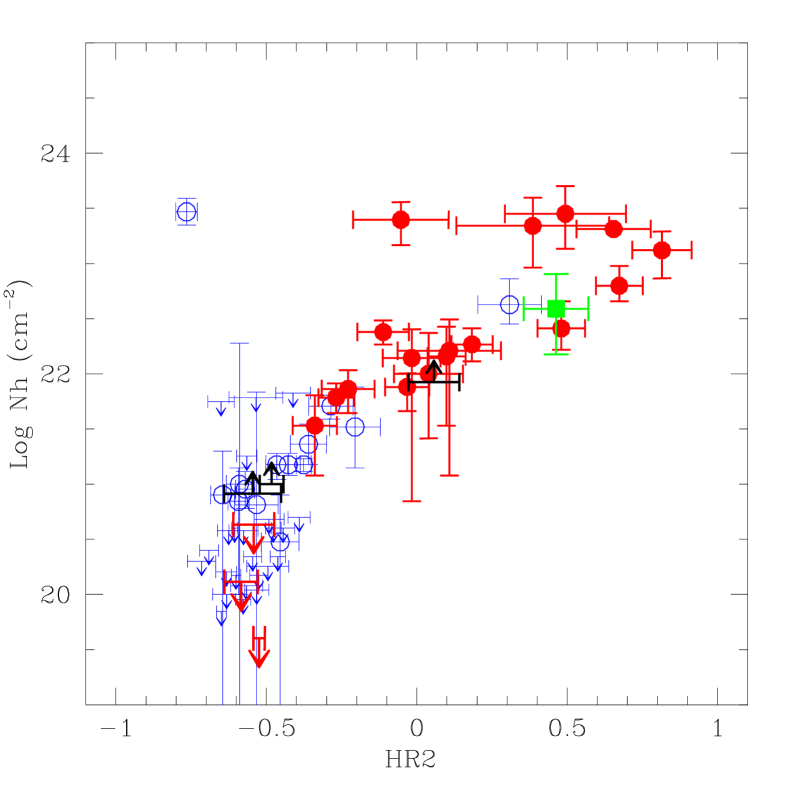
3.3 X-ray colors versus absorbing column densities
One of the responsibilities of the XMM-Newton SSC is the production of the XMM-Newton Source Catalogue. This catalogue will provide a rich and unique resource for generating well-defined samples for specific studies, considering the fact that X-ray selection is a highly efficient way of selecting AGN, clusters of galaxies and active stars.
Having completed the X-ray spectral analysis of the sources in the HBSS
sample we can investigate the (expected) correlation
between the hardness ratios and the absorbing column densities for the
AGN population.
We have used here the hardness ratios HR2 as defined from the XMM-Newton
pipeline processing :
where C(0.52 keV), C(24.5 keV) are the “PSF and vignetting corrected” count rates in the 0.52 and 24.5 keV energy bands, respectively. We stress that a “Hardness Ratio” is often the only X-ray spectral information available for the faintest sources in the XMM-Newton catalogue, and thus, a “calibration” in the parameter space is needed to select “clean” and well-defined samples. With the data we have accumulated so far we can work out this “calibration” for e.g. absorbed AGN.
In Fig. 3 we show the expected correlation between the hardness ratio HR2,
the absorbing column densities and the optical spectral properties of the
selected AGN.
A few considerations are needed:
The 4.5–7.5 keV selection, at the flux limits investigated here, seem to be extremely efficient in selecting sources that are described at the “first” order by an absorbed power-law model. This emerge from the consideration that there are very few objects which significantly deviate from the correlation between the hardness ratio HR2 and the . A close inspection of the X-ray spectra of these few sources show best fit spectral models more complex than a simple absorbed power-law. We have some indications that the situation could be a bit more complicated for the sample of sources selected in the 0.5–4.5 keV energy band;
We strengthen the results first discussed in Caccianiga et al. (2004) and Della Ceca et al. (2004). First, all but one source characterized by an intrinsic cm-2, have HR2. Second, all but 3 of the objects optically classified as Type 2 AGN have HR2. Third, only three objects classified as optically Type 1 AGN have HR2 and only one of them have (but see the discussion above) cm-2.
The results shown in Fig. 3 allow us to design a very simple process to pinpoint absorbed AGN with very high efficiency using XMM-Newton data: selection in the 4.5–7.5 keV energy band combined with the condition that the selected sources should have HR2. The fact that we are dealing with a well defined and complete sample which has been almost completely identified allows us to make a step forward: from a simple selection of sources to a sample with well defined statistical properties. In fact, using the current HBSS sample as an “unbiased” view of the X-ray sky in the 4.5–7.5 keV energy band, we gain information on which kind of sources we are leaving out by imposing the constraint of HR2. The incoming 2XMM catalog will allow us to build up a sample of about 100 absorbed AGN (from the analysis of about 1000 useful XMM fields) having fluxes above ergs cm-2 s. Extrapolating the results obtained so far on the HBSS (Della Ceca et al. in preparation) these sources should allow us to study the cosmological evolution properties (XLF and evolution) of the absorbed AGN population in the luminosity range from to ergs sand up to z=1, i.e. a useful redshift and luminosity range to investigate their connection with galaxy evolution and star formation in the Universe (Ballantyne, Everett, & Murray 2005).
Acknowledgments
We acknowledge partial financial support by ASI (grants: I/R/062/02 and I/R/071/02), by MURST (Cofin-03-02-23) and by INAF. We thank the TNG and the ESO NTT Time Allocation Committee for a generous and continuous allocation of observing time.
References
- Baldi et al. (2002) Baldi, A., et al. 2002, ApJ, 564, 190
- Ballantyne, Everett, & Murray (2005) Ballantyne, D.R., Everett, J.E. and Murray N. 2005, in press [astro-ph/0509356]
- Brandt & Hasinger (2005) Brandt, W.N. & Hasinger, G. 2005, ARAA, 43, 827
- Caccianiga et al. (2004) Caccianiga, A., et al. 2004, A&A, 416, 901
- Comastri et al. (2001) Comastri, A., et al. 2001, MNRAS, 327, 781
- Della Ceca et al. (2004) Della Ceca, R., et al. 2004, A&A, 428, 383.
- Gilli et al. (2001) Gilli, R., et al. 2001, A&A, 366, 407
- Grupe et al. (2004) Grupe, D., et al. 2004, AJ, 127, 3161
- Hasinger et al. (2001) Hasinger, G., et al. 2001, A&A, 365, L45
- Mainieri et al. (2002) Mainieri, V., et al. 2002, A&A, 393, 425
- Mateos et al. (2005) Mateos, S., et al. 2005, A&A, 433, 855
- Perola et al. (2004) Perola, G.C., et al. 2004, A&A, 421, 491
- Piconcelli et al. (2003) Piconcelli, E., et al. 2003, A&A, 412, 689
- Severgnini et al. (2003) Severgnini, P., et al. 2003, A&A, 406, 483
- Setti and Woltjer (1989) Setti, G. & Woltjer, L. 1989, A&A, 224, 21
- Treister & Urry (2005) Treister, E. & Urry, C. M. 2005, ApJ, 630, 115
- Ueda et al. (2003) Ueda, Y., et al. 2003, ApJ, 598, 886
- Veron–Cetty & Veron (2001) Veron-Cetty, M. P. & Veron, P. 2001, A&A, 374, 92
- Wolter et al. (2005) Wolter, A., et al. 2005, in press [astro–ph/0510045]
- Worsley et al. (2005) Worsley, M. A., et al. 2005, MNRAS, 357, 1281