Do dwarf galaxies form in tidal tails?
Abstract
The formation of tidal dwarf galaxies (TDG) inside tidal arms of interacting disk galaxies has been studied with N-body and N-body/SPH simulations at different resolutions. In pure N-body simulations no bound objects are formed at high resolution. At low resolution bound objects can form in tidal tails in agreement with previous work. We conclude that tidal dwarf galaxies are not likely to form by pure collisionless collapse in tidal tails. However, the presence of a sufficiently massive and extended gas component in the progenitor disk supports the formation of bound stellar objects in the tidal arms. Our results clearly favor a dissipation supported scenario in which the formation of TDGs is induced by the local collapse of gas which then triggers the collapse of the stellar component.
keywords:
galaxies: interactions – galaxies: dwarf – methods: N-body simulations1 Introduction
1.1 Observations of Tidal Tails in Interacting Galaxies
Interacting galaxies are very complex and highly dynamic systems. They can be comprised of spiral galaxies as well as elliptical galaxies which possibly merge and change morphological type. If the mass ratio of spiral mergers is in the range to , from theoretical as well as observational point of view the systems are likely to evolve into elliptical galaxies (Genzel et al., 2001, but see Robertson et al., 2006 for a counter example). For those mass ratios the remnant properties resemble elliptical galaxies (Naab & Burkert, 2003; Naab & Trujillo, 2006). Typically, mergers take place in field and group environments where the velocity dispersion is of the order of the escape speed of the galaxies. However, merging has also been observed in probably unrelaxed clusters (van Dokkum et al., 1999; Tran et al., 2005).
Mergers between spheroidal galaxies are not spectacular. As these systems are mostly gas poor and dynamically hot the merger is neither accompanied by a starburst nor by distinct tidal features (van Dokkum et al., 1999; Bell et al., 2006; Naab et al., 2006). Hence the formation of new dwarf galaxies inside tidal features is very unlikely.
If spiral galaxies with gas and dynamically cold discs are involved in a merger the systems show striking features like starbursts, AGN activity (Genzel et al., 1998; Sanders & Mirabel, 1996; Dasyra et al., 2006) and long arms of stellar and gaseous material which extend from the parent galaxy to sometimes hundreds of kiloparsecs away. Some famous examples are NGC 4676 (’The Mice’), NGC 4038/39 (’The Antennae’), IRAS 19254-7245 (’The Superantennae’) (see e.g. Hibbard & van Gorkom, 1996; Wilson et al., 2000; Hibbard et al., 2001; Fabbiano et al., 2003; Hibbard et al., 2005; Mirabel et al., 1991; Vanzi et al., 2002; Charmandaris et al., 2002, and references therein). These arms are produced during the close encounters of the galaxies when strong tidal forces expel the material from the discs of their parent galaxies (Toomre & Toomre, 1972). Already Zwicky (1956) suggested that inside these tidal tails new stellar systems could be forming. This idea was revived by Schweizer (1978) who found a low surface brightness object slightly beyond the tip of the southern tail in NGC 4038/39. Since then, a lot effort has been spent on observations of candidate objects for such tidal dwarf galaxies (TDGs).
The distribution of gas and stars in tidal tails can be very different (Hibbard & van Gorkom, 1996; Hibbard & Yun, 1999; Heithausen & Walter, 2000; Smith et al., 1997; Hibbard et al., 2000). Some tails show gaps which could be a consequence of local collapse or feedback associated with star formation (Hibbard & van Gorkom, 1996) and in some tails, there is an offset between the stellar and the gaseous material (Hibbard & Yun, 1999). Tidal tails can easily contain up to several M⊙ of gas and a similar mass in stars (see e.g. Hibbard et al., 1994; Hibbard & Yun, 1999; Hibbard et al., 2001). The molecular complexes forming in the tails can reach masses of a few M⊙ (see e.g. Heithausen & Walter, 2000; Walter & Heithausen, 1999).
The formation processes of TDGs and star clusters in tidal tails seem to be linked, as tidal tails with TDG candidates seem to have few star clusters, while those with many star clusters have no TDG candidates (Knierman et al., 2003). Both star cluster formation as well as TDG formation are directly coupled to the local properties of the gas reservoir. The formation of TDGs might rely on exceeding a threshold in HI column density (Duc et al., 2000), much like the similar threshold for star formation in dwarf irregulars and low surface brightness galaxies (Davies et al., 1976; Gallagher & Hunter, 1984; Skillman, 1987; Taylor et al., 1994; van der Hulst et al., 1993; van Zee et al., 1997). As the threshold should be metallicity dependent (Franco & Cox, 1986), TDGs should have a lower threshold than dwarf galaxies formed in isolation because TDGs are made from recycled material of the progenitor discs (Duc et al., 2000).
To the present day, there are around 60 well known TDG candidate objects (Schweizer, 1978; Mirabel et al., 1992; Hibbard et al., 1994; Yoshida et al., 1994; Duc et al., 1997; Duc & Mirabel, 1998; Heithausen & Walter, 2000; Duc et al., 2000; Mendes de Oliveira et al., 2001; Weilbacher et al., 2002; Temporin et al., 2003; Weilbacher et al., 2003; Mundell et al., 2004; Bournaud et al., 2004; Amram et al., 2004). However, the quality and level of details of the observations still varies considerably for these objects, which also introduces some scatter in the reliability of their detections as TDG candidates.
In general a TDG can be detected either while it is still embedded in the tidal tail or as a dwarf galaxy accompanying an already merged system. In the first case, one will try to detect overdensities in gas and stars inside the tidal tail, with the ultimate proof for a newly formed TDG being that it kinematically decoupled from the surrounding tail (Duc et al., 2000). However, corresponding signatures in velocity gradient or dispersion can easily be masked by projection effects (Bournaud et al., 2004) and so far only only one such object has been confirmed (Bournaud et al., 2004), while for other observed objects the velocity gradients are not large enough to assure self-gravity (see e.g. Mendes de Oliveira et al., 2001; Hibbard et al., 2001; Saviane et al., 2004; Amram et al., 2004; Bournaud et al., 2004).
Alternatively, one can detect TDGs after their decoupling from the tidal tail, i.e. to search the population of dwarf galaxies in merger systems for TDGs (see e.g. Deeg et al., 1998; Delgado-Donate et al., 2003). Duc & Mirabel (1998) suggested to use a metallicity based selection criterion of Z for TDGs. Given the higher metallicity of TDGs compared to usual dwarf galaxies, TDGs would thus also deviate from the luminosity-metallicity relation of dwarf and giant galaxies (see e.g. Skillman et al., 1989; Richer & McCall, 1995; Skillman et al., 1997).
Recently, a sample of 13 TDG candidate objects has become available (Weilbacher et al., 2000, 2002, 2003). The majority of these TDG candidates has luminosities of to in -band and a mean H luminosity of 2.2 erg s-1. Their mean oxygen abundance is , consistent with material in the outer disc of spiral galaxies like the Milky Way (see e.g. Naab & Ostriker, 2006). All 13 objects seem to have internal velocity gradients, but higher resolution spectra would be required for confirmation.
1.2 Theoretical Modelling of Tidal Tails
The formation and evolution of tidal features in systems of interacting galaxies has been studied with theoretical models since the early 1960s (see e.g. Pfleiderer & Siedentopf, 1961; Pfleiderer, 1963; Toomre & Toomre, 1972; Yabushita, 1971; Clutton-Brock, 1972a, b; Wright, 1972; Eneev et al., 1973). Most of these models relied on restricted three-body simulations. With the advent of more powerful computers, also more advanced algorithms for such particle simulations became available. Tree codes have been the method of choice for many merger studies, as they offer a wide dynamic range regarding their spatial and mass resolution (see e.g. Appel, 1985; Jernigan, 1985; Barnes & Hut, 1986; Press, 1986; Jernigan & Porter, 1989; Barnes, 1990). Gas has been incorporated into such tree code simulations using the Smoothed Particle Hydrodynamics method, or short SPH (Lucy, 1977; Gingold & Monaghan, 1977; Benz, 1990; Monaghan, 1992).
Self-consistent merger simulations have been used since the mid 1980s to study the formation of the remnant galaxy and its properties. General studies of merging systems (see e.g. Barnes, 1988b, a, 1989; Naab et al., 1999; Naab & Burkert, 2003) have been conducted as well as attempts to model specific observed merger systems (see e.g. Mihos et al., 1993; Hibbard & Mihos, 1995; Mihos & Bothun, 1997; Mihos et al., 1998; Duc et al., 2000; Barnes, 2004). The distribution of gas and stellar material in the tidal tails is of major importance to determine the encounter geometry of the observed system. However, those simulations reproduced the tidal tails as such and were not particularly aimed at modelling the formation of bound structures in the tidal tails.
Reproducing the star formation history of merging systems has been another constraint for simulations. However, the star formation rate can easily be underestimated in regions where strong compression due to shocks in the encounter occur, which also makes it difficult to model merger induced starbursts which are strong enough to yield emission comparable to observed ULIRGs (Mihos et al., 1993). More refined star formation prescriptions in the models are required to model such star bursts (Barnes, 2004).
Merger simulations have also been successful in understanding the offsets between gas and stellar material observed in some merging systems (Smith et al., 1997; Hibbard & Yun, 1999; Hibbard et al., 2000). Rather than being due to complex feedback phenomena in the tails, those offsets are due to dissipational effects during the interaction, which lead to a kinematical decoupling of the gaseous component from the stellar one soon after the tidal tails are ejected (Mihos, 2001). Hence such offsets are a kinematical consequence of some specific encounter geometries.
The tidal debris of a merger can be used to probe the properties of the underlying dark matter halos (Faber & Gallagher, 1978; White, 1982; Negroponte & White, 1983; Barnes, 1988b). Merger models in which the dark matter halos are set up as pseudo-isothermal spheres (see e.g. Hernquist, 1990) or NFW halos (Navarro et al., 1996, 1997) can form significant tidal tails, provided that the ratio of escape velocity to circular velocity at about the solar radius in the progenitor galaxy is (Dubinski et al., 1999; Springel & White, 1999).
Most merger simulations concentrated either on the properties of the remnant galaxies or on the global distribution of mass in tidal tails. Barnes & Hernquist (1992) were the first to concentrate explicitly on the formation of structures inside the tidal tails. They modeled one encounter, corresponding to one pair of tidal tails, in which they found clumps of material, possibly being TDGs or their progenitors. The resolution of these tails was limited by the low numbers of particles in the simulation, in total per galaxy with of them for the gas component. The most massive clump of material in the tidal tails was resolved with 350 particles and had a total mass of M⊙ if the progenitor galaxies are scaled to the Milky Way (Barnes & Hernquist, 1992). 25% of the mass inside the object was in gas. The dark matter content of the object was . The distance from the remnant at which the most massive object forms varies between pure N-body simulations of the same encounter (Barnes, 1992) and simulations including gas (Barnes & Hernquist, 1992, 1996). While the stellar material which ends up in the TDG candidates gently collapses once removed from the parent galaxy, the gas is driven into a thin ’ridge line’ along the tail by convergent flows. The bound objects were thought to form in the stellar component alone, then gas assembles in these potential wells (Barnes & Hernquist, 1992, 1996). This formation scenario has been one of the two standard paradigms for the formation of TDGs. Barnes & Hernquist (1996) emphasize that their pure -body simulation showed similar objects than the one including gas and thus point out that “dissipative effects are not crucial in forming such structures”, as the density fluctuations in the stellar component alone were sufficient to produce the TDG candidates. This should, however, be taken with care, as the source for the density fluctuations in the tail which then collapse and form TDG candidate objects are most probably particle noise and swing amplification during the merger (Barnes & Hernquist, 1992), which means that at different resolutions and thus different particle noise levels, the fragmentation of a tidal tail possibly looks quite different which hasn’t been addressed since Barnes & Hernquist (1992). We will attempt to do so in section 3.
Elmegreen et al. (1993) and Kaufman et al. (1994) suggested a different process for the formation of bound clumps in tidal arms. This scenario, in which gas plays the key role in the formation of TDGs is the other major paradigm established for the formation of TDGs. The simulations of Elmegreen et al. (1993) and Kaufman et al. (1994) show the growth of large cloud complexes as massive as M⊙ in the tidal arms. The contribution of gas to the total mass of those objects was . Elmegreen et al. (1993) explained the formation of these objects with the high velocity dispersion in the gas of interacting systems. A cloud forming from gravitational instabilities inside an ISM with increased velocity dispersion is likely to be more massive, as the local Jeans mass of the gas is increased as well. In addition, the dispersion intrinsic to the cloud should also be increased, allowing it to form stars with higher efficiency as the cloud is more stable against self-destruction. The conclusion of Elmegreen et al. (1993) and Kaufman et al. (1994) that gas is the key ingredient for the formation of TDGs clearly contradicts the results of Barnes & Hernquist (1992). It should be noted that the numerical models used to arrive at these two results differ considerably in terms of the numerical methods as well as the initial conditions.
Li et al. (2004) simulated the formation of globular clusters in tidal tails. Although they were able to reproduce the distribution and metallicity of globular clusters in ellipticals, the insight on TDG formation in those simulations is rather limited because of the use of sink particles (Bate et al., 1995) for modelling the collapse of gaseous structures into globular clusters. As every sink particle resembles one globular cluster, no larger stellar dynamical systems like TDG are modelled. Stellar superclusters formed in mergers possibly merge later and form ultracompact dwarf galaxies (Kroupa, 1998; Fellhauer & Kroupa, 2002).
Recently there has been some discussion about the conditions under which TDGs can be formed at the very tip of the tidal tail, a location in which they or their progenitors are frequently found in observed systems (note that not all TDG candidates are located at the tip of their ambient tidal tail, though). Bournaud et al. (2003) and Duc et al. (2004) have argued that there could exist two distinct formation mechanisms for TDG candidates: Local gravitational instabilities in the inner part of tidal tails lead to the formation of TDG candidates with masses of while massive () TDG candidates at the very tip of tidal tails form in a top down scenario in which the tidally expelled gas accumulates at the tip of the tail and then undergoes gravitational collapse. This process might be similar to the process of collapsing sheets (Burkert & Hartmann, 2004). Bournaud et al. (2003) and Duc et al. (2004) argue for a threshold in the radial extension of the progenitor galaxy’s dark matter halo relative to the size of the progenitor’s stellar disc. Only haloes with cutoff radii at least times larger than the radial scale length of the disc should hence be able to form such massive TDG candidates at the tip of tidal tails.
However, some care is advised in the interpretation of those simulations, as they have a rather coarse spatial resolution of the -body component of kpc, which is why the gravitation of the gas component in Bournaud et al. (2003) is only simulated in two dimensions, while the rest of the simulation is three dimensional. The 2D resolution is pc at the cost of neglecting the extent of the gas in the tail perpendicular to the orbital plane completely. This problem is overcome in Duc et al. (2004), but still the resolution is only pc in one simulation and even a factor of two worse for all other simulations. Both studies don’t model the gas component with full hydrodynamics, but with the simpler sticky particles approach.
In this paper we explore the origin of TDGs with high resolution simulations. In Section 2.1 we describe the initial conditions of our numerical models and in Section 2.2 the simulation code. The gravitational force softening used in our simulations is discussed in Section 2.3. The results of our simulations are presented in Section 3, where we discuss in detail the influence of numerical resolution on structure formation in the tidal tails in Section 3.1. The effects of gravitational softening on the results are discussed in Section 3.2, while the effects of gas in the tails are discussed in Section 3.4. In Section 3.5 we present detailed photometric and kinematical analysis of our most massive TDG candidate. Finally, we summarize and conclude in Section 4.
2 NUMERICAL MODELS
2.1 Initial Conditions
Every galaxy in our simulations consists of an exponential stellar disc component, a stellar bulge and a dark matter halo. In addition, a subset of the simulations included also a gaseous disc. The galaxies have been set up with the method described by Hernquist (1993) and have been run in isolation to verify that they are in equilibrium for a time scale longer than the time until the first encounter in the merger. Note that for one model including a gaseous disk, we verify the stability in detail in Section 3.4. We will only give a short summary of the parameters of our galaxy models and the system of units used. For details of the method, we refer the reader to Hernquist (1993). We assume and the galaxies are intrinsically scale-free. As a general rule, all quantities inside this paper are given in these intrinsically scale free units unless otherwise noted. The conversion to physical units is performed by scaling a galaxy to some system with known physical properties. If the progenitors are scaled to the Milky Way, the unit time is Myr, unit length is kpc, unit velocity km s-1 and unit mass is M⊙.
| Model | |||||||||
|---|---|---|---|---|---|---|---|---|---|
| A | 80k | 16k | 160k | 256k | 288k | 0. | 05 | 0. | 071 |
| A2 | 80k | 16k | 640k | 736k | 768k | 0. | 05 | 0. | 035 |
| B | 160k | 32k | 320k | 512k | 544k | 0. | 039 | 0. | 056 |
| C | 320k | 64k | 640k | 1024k | 1056k | 0. | 031 | 0. | 044 |
| D | 640k | 128k | 1.280k | 2048k | 2080k | 0. | 025 | 0. | 035 |
| D2 | 640k | 128k | 160k | 928k | 960k | 0. | 025 | 0. | 056 |
| E | 1280k | 256k | 2.560k | 4096k | 4128k | 0. | 019 | 0. | 028 |
The stellar disc has a mass of . The discs surface density profile is an exponential with scale length and vertical scale height . The cut off radius of the disc is and the vertical cut off is at . The Toomre parameter (Toomre, 1964) at the solar radius is . A stellar bulge component with mass and scale length is used. The cut off radius for the bulge component is . The dark matter halo is realized as a pseudo isothermal sphere with mass . It has a core radius of and a cut off radius of .
From the large sample of merger simulations of Naab & Burkert (2003) with different mass ratios and encounter parameters, we chose the encounter which produces the most pronounced tidal tail and hence is a most favorable case for TDG formation. The initial conditions used by Naab & Burkert (2003) were consistent with initial conditions derived from cosmological N-body simulations (see Khochfar & Burkert, 2006). In the encounter we selected, the disc of the galaxy which produces the tidal tails is aligned with the orbital plane of the encounter, the galaxies have equal mass and the encounter is prograde. The galaxies are put on a parabolic orbit, the initial separation between their centers of mass is 30. The pericenter distance of the encounter is . Together with their masses, this determines the orbit completely.
In order to study the formation and subsequent evolution of tidal tails in detail, the resolution of the progenitor galaxy from which the tidal tail emerges should be maximized as far as possible in a simulation. The second galaxy, on the other hand, only acts as a perturber. It creates the tidal forces which strip the future tail material from the progenitor disc. The internal structure, dynamics and orientation of the perturbing galaxy are irrelevant for the tidal tail as long as the tidal forces during the encounter are reproduced accurately enough. In order to be able to maximize the resolution of the progenitor galaxy, we therefore only resolve the perturbing galaxy comparatively coarse. This approach allows the study of only one tidal arm per merger, but this in greater detail, which is the aim of this work. We have confirmed the validity of this approach in a test simulation in which both galaxies were resolved at the same level. The matter which is found inside the tidal arm of one galaxy contains no particles of the perturbing galaxy. The tidal arm forms inside halo material of the galaxy to which also the stellar material of the tail once belonged.
We set up the perturbing galaxy with a resolution of 10000 particles for the stellar disc, 2000 particles for the bulge component and 20000 for the dark matter halo. Both the perturbing galaxy as well as the one which develops the tidal tail share the parameters for the mass and extent of the components as described above. However, the galaxy which develops the tidal tails is realized at much higher resolution than the perturbing one. The particle numbers for our different models are summarized in Table 1. The lowest resolution model, A, has already more particles inside one galaxy than the entire simulation of the classical Barnes & Hernquist (1992) paper and the follow up simulations of Barnes & Hernquist (1996). As far as we know, our highest resolution simulation, model E, is the highest resolution simulation of a tidal tail published so far.
2.2 Numerical Method
The simulations were performed with our hybrid N-body / SPH code VINE. The code will be described in detail in a forthcoming paper (Wetzstein et al., in preparation), so here we will only give a short description of the numerical algorithms used. VINE uses a binary, mutual nearest neighbor tree for the efficient calculation of gravitational forces (Appel, 1985; Press, 1986). A distant tree node is accepted for the interaction list of particle if their distance satisfies the condition where and are the physical size of the particle and node, respectively. For the tolerance parameter , we adopted a value of for our simulations presented here. The time integration was carried out using a leapfrog integrator in combination with an individual time step scheme which allows the code to follow very high density contrasts in the simulated system very efficiently. The individual time step scheme is similar to the blockstep scheme of the TREESPH code (Hernquist & Katz, 1989). The timestep of a particle is computed using the minimum of three different criteria: where is the gravitational softening length, the velocity and the acceleration of the particle. The are tolerance parameters, for which we used and . Our highest resolution simulations required time steps being a factor of more than smaller than the maximum timestep in the scheme. The SPH scheme in VINE follows the SPH formulation of Benz (1990). The artificial viscosity included the additional terms suggested by Balsara (1990, 1995) to reduce entropy generation in shear flows. Our choice of parameters of the code allowed us to keep the error in the total energy of the system lower than in our -body simulations.
VINE is fully parallelized with OpenMP. The gravitational force calculation, which is the most time consuming part of a simulation, scales linear up to processors and the second most time consuming part, i.e. the SPH calculation scales equally well. The simulations have been run in parallel on 32 processors of our SGI Altix supercomputer at the University-Observatory, Munich, as well as the IBM Regatta supercomputer at the Rechenzentrum of the Max Planck Society, Garching.
2.3 Gravitational Softening
As we want to study the collapse of objects inside the tidal arms, the particle noise is an important factor (Barnes & Hernquist, 1992). An additional effect here is the gravitational force softening used. The optimal choice for the force softening, regarding its functional form as well as the particular softening scale used as a function of particle number have been a subject of intensive debate in the literature (see e.g. Merritt, 1996; Romeo, 1997; Athanassoula et al., 2000; Dehnen, 2001, and references therein). We use the SPH spline kernel to soften the gravitational forces of all particles. It has the advantage that outside the softening length it exactly resembles the Newtonian potential. The benefits of this choice over Plummer softening (Aarseth, 1963) have been discussed by Dehnen (2001).
Regarding the choice of the softening lengths, there exist no studies particularly dedicated to mergers of interacting galaxies. We have thus used empirical values for the softening of the stellar disc in model A. For a merger with a disc of 80000 particles, our choice for the softening length is (see e.g. Naab & Burkert, 2003), which guarantees a stable thin disc after several rotation periods. In order to obtain softening lengths for the bulge and halo component of the galaxy, we have adopted the point of view of force softening being equivalent to giving a point mass a finite mass distribution. Particles with higher mass should thus have increased softening lengths as well. This idea was applied to every component (and thus particle species with a given mass) of the galaxy by scaling the smoothing length of for our particles in the disc of model A (80000 particles) with mass to other masses according to . The effects of two body relaxation and associated disc heating should hence be decreased, together with similar effects of dark matter halo particles penetrating the tidal tail at later stages of the simulation. The corresponding softening lengths used for the model galaxies are listed in Table 1. The softening lengths of the components of the perturber galaxy have been adjusted in the same way, resulting in a fixed softening length of for the stellar disc, for the bulge and for the dark matter halo.
In any resolution study like the one presented here, softening can affect the results. This can only be addressed by numerical experiments, i.e. actually varying the softening lengths and the particle numbers. We have carried out such tests in order to assure the validity of our results against softening effects, see Section 3.2 for a detailed discussion.
3 RESULTS OF THE RESOLUTION STUDY
3.1 Influence of Increased Progenitor Resolution
In order to study the effects of numerical resolution, we have conducted a sample of simulations with different resolutions of the same configuration, as described in Section 2.1. Starting from a low resolution simulation with 80000 particles in the disc of the progenitor galaxy (model A), we increased the mass resolution up to a factor of 16 (model E). This should allow us to assess the hypothesis of Barnes & Hernquist (1992) that particle noise is one of the sources of the density perturbations which lead to the gravitational collapse of objects.
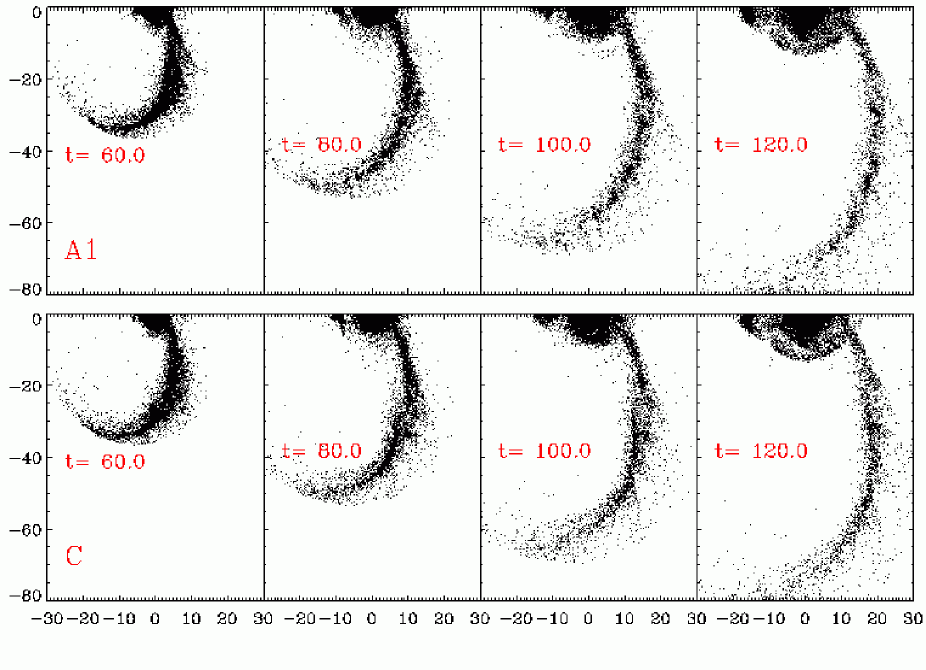
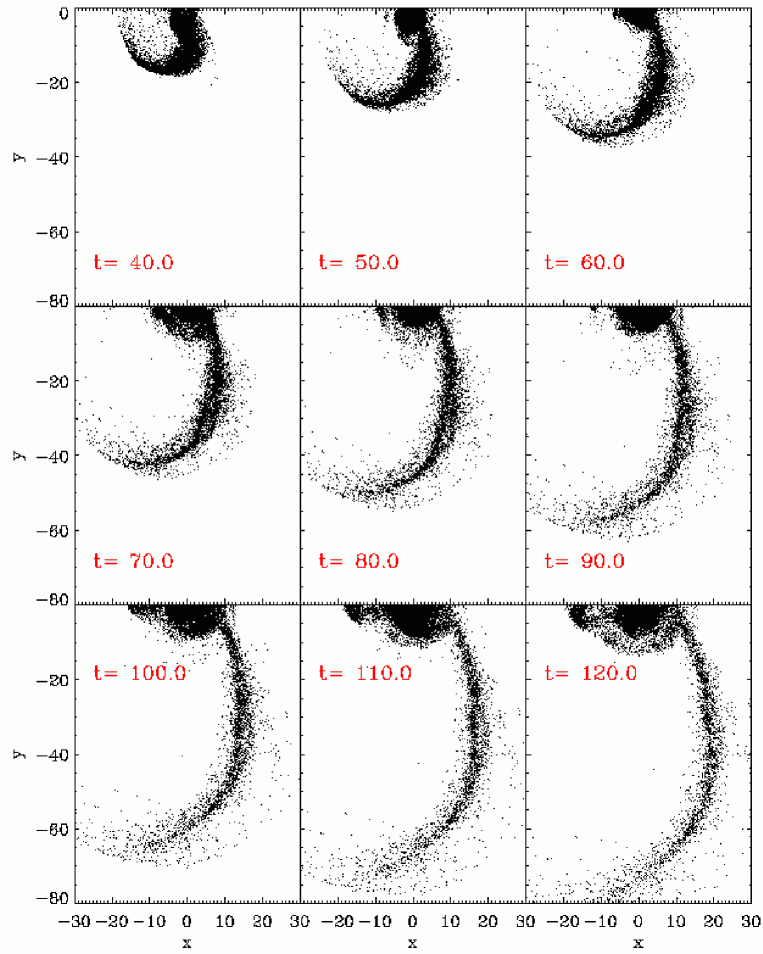
All the simulations have been run from until , at which the central part of the remnant galaxy has relaxed into a new equilibrium configuration. The first close encounter of the two galaxies occurs at and the galaxies merge until . The time evolution of model A from to is shown in the upper panel of Figure 1. In this and the following particle scatter plots, we show only a randomly chosen subset of 40000 particles to allow for better viewing. The tidal tail initially goes through a phase of rapid expansion. Later, its inner parts fall back onto the merger remnant, while the outer parts still expand and move further away from the remnant.
Several fragments formed within the tidal tail and collapsed afterwards. They decoupled from the surrounding tail and became self-gravitating entities. For our analysis, we identify the objects with a friends-of-friends algorithm and check every object in the tail for self-gravity. We require the object to reach central stellar densities similar to those of observed dwarf galaxies, otherwise we don’t consider the object as a possible candidate for a TDG. We adopt a stellar density threshold of Mpc3, corresponding to in our code units. This choice is motivated by the low central density tail of observed dwarf galaxies (Mateo, 1998), lowered slightly to yield a conservative lower limit. The formation of the objects in our model A is very similar to those in the simulation of Barnes & Hernquist (1992). We can confirm their result that dark matter does not significantly contribute to the overall mass of those objects and find a fraction of .
Model B evolves very similar to model A, hence we don’t show its evolution in a separate figure. Several collapsed objects form inside the tidal tails, but their distribution along the tidal tail is different from the one in model A. This indicates that results of simulations on TDG formation are affected by numerical resolution, as one would expect if particle noise is affecting the gravitational collapse.
Increasing the mass resolution by another factor of two seems to suppress the gravitational collapse, as can be seen from the lower panel of Figure 1 which shows the time evolution of model C. Apparently some regions in the tidal tail are more dense than others, but no collapsed objects as in the lower resolution models are formed. In order to study this result more quantitatively, Figure 2 shows the density inside the tidal arm as a function of distance from the center of the merger remnant for models A, B, C, D, and E. The upper panel shows the density at , the latest time shown in Figure 1. In addition, the lower panel shows the densities along the tidal tail at , a rather late phase of the tail evolution which allows us to assess the final stage of collapse along the tidal arm.
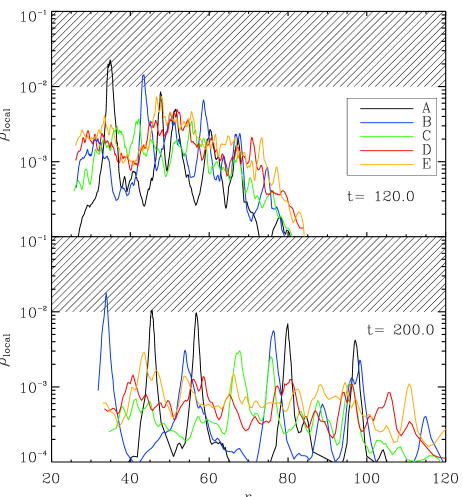
We obtain the density in the tidal arm from the stellar components alone, as the contribution of dark matter to the total mass of the tidal arm is negligible. For every star particle, we compute its distance from the center of the merger remnant. The density of the particle is computed in a way similar to the SPH density calculation: For every particle, we search for the 50 nearest neighbouring particles and compute a mean density of the sphere containing those particles. For the plots in Figure 2, we create bins of equal mass in order to allow for a reasonable comparison between the different resolutions. Every point in the profiles of Figure 2 represents the maximum stellar density of the corresponding bin. The fixed mass inside each bin is chosen as , corresponding to 10 particles in model A and 160 in model E, respectively.
Figure 2 shows that with increased resolution, no collapsed objects form inside the tail anymore. Note that the innermost objects in the tail at have fallen back into the remnant galaxy at and hence are no longer present in the lower panel of Figure 2. The tidal tail in model B, which also forms collapsed objects, exhibits a similar evolution as model A. However, the growth of overdensities is delayed with respect to model A.
As was already indicated in Figure 1, the tidal tail of model C does produce overdense regions, but these hardly develop into collapsed objects. Following the trend of model B, the growth of overdensities is delayed further. Only at very late stages, some of these overdensities developed a high density contrast relative to their surroundings.
Models D and E follow this trend as well. The mass assembly of overdense regions is delayed even further, and the associated regions do not gravitationally collapse to form distinct entities, such as the objects in model A or B. Comparing the density evolution of the different models further, there are remarkable differences between models A to D. However, the density of the tidal tails in model D and E do not differ much and agree considerably well especially for the early stages of the tail evolution. We interpret this as a sign that for the time scale until studied here, the simulations start to converge somewhere around the resolution of model E.
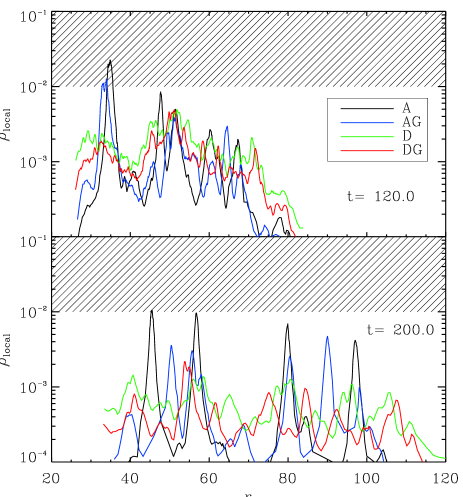
In order to assure that our result is independent of the simulation code used, we re-simulated models A and D, using a different random seed for the setup and the Gadget2 code (Springel, 2005) for the time evolution. We used an integration accuracy parameter of and a tolerance parameter for the tree accuracy of . The results of the Gadget2 run are shown in Figure 3. Again we see that the density in the peaks decreases when resolution is increased.
We thus conclude from this analysis that the gravitational collapse of objects inside a tidal arm, which has been reported for pure -body simulations (Barnes & Hernquist, 1992, 1996), is strongly suppressed if the simulations have high enough resolution. The TDG candidate objects formed in models A and B are artifacts of the poor resolution in those models. Furthermore, only these two models are able to form TDG candidate objects with central densities similar to those of observed dwarf galaxies (Mateo, 1998). All other models shown in Figure 2 fail to reach such central densities in objects in the tidal arm. As we described in Section 2.1, the particular encounter which we study here is a most favorable case for the formation of extended tidal arms. Hence it is unlikely that other encounter parameters for the merger would work better to produce TDGs. We can conclude that pure -body simulations of merging galaxies fail to generate collapsed objects in the tidal tails which resemble dwarf galaxies, provided that the resolution of the simulations is high enough.
3.2 Effects of Gravitational Softening on Tidal Tail
In resolution studies like the one presented here the total number of particles is not the only parameter affecting the local gravitational potential. The other key parameter in this context is the gravitational softening length. Both, the softening length and the number of particles can cause two body relaxation effects such as artificial heating of an N-body system. For example, a system realized with few particles can have a very noisy gravitational potential if the softening lengths are small, or a rather smooth potential if the softening length is increased considerably. Especially if the gravitational collapse of small structures is to be studied, both softening length and number of particles should ideally be explored to evaluate their effects on the results obtained from such simulations. As the exploration of this two parameter space is usually very expensive in terms of cpu time, such studies are rather rare. The usual approach is to resolve the system at hand with the highest particle number affordable under given cpu time constraints and to simulate this setup with a hopefully well chosen gravitational softening length. The latter is extremely dependent on the simulator’s personal experience, as systematic studies of force softening as a function of particle number are rare and usually only exist for certain well behaved mass distributions which in turn are often very different from the system to be studied (see e.g. Merritt, 1996; Romeo, 1997; Theis, 1998; Athanassoula et al., 2000; Dehnen, 2001, and references therein).
Nevertheless, we have explored the effects of different gravitational softening lengths for some of our models. The set of simulations used for this purpose is summarized in Table 2.
| Model | ||||
|---|---|---|---|---|
| C | 0. | 031 | 0. | 044 |
| CL4 | 0. | 0078 | 0. | 011 |
| CH4 | 0. | 124 | 0. | 176 |
| D | 0. | 025 | 0. | 035 |
| DL4 | 0. | 0063 | 0. | 0088 |
| DL16 | 0. | 0016 | 0. | 0022 |
We have repeated the simulation of model C, but with a factor of 4 lower (model CL4) and a factor of 4 higher (model CH4) softening length. A similar set of models has been created for case D, with factors of 4 and 16 lower softening lengths in models DL4 and DL16, respectively. Apart from the different softening lengths, all other parameters of those models have been inherited from models C and D, respectively.
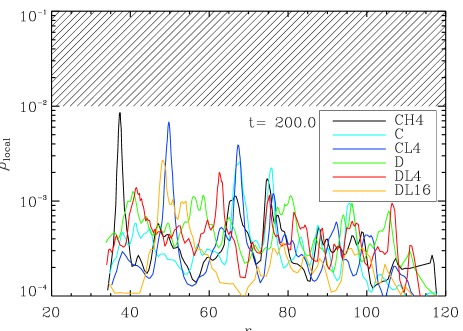
Figure 4 shows the density in the tidal tails of models C, CH4, CL4, D, DL4 and DL16 as a function of distance from the center of the merger remnant.
Although different softening lengths lead to the formation of different high density regions in the tidal arm, none of these regions reach densities of dwarf galaxies. We can therefore conclude that our particular choice of softening lengths in models A to E has not artificially suppressed the formation of bound objects with central densities similar to dwarf galaxies.
3.3 Influence of Progenitor Dark Matter Halo
From the analysis presented so far, it is not clear which component of the progenitor galaxy, i.e. disc, bulge or halo, plays the key role in triggering the collapse of objects in the tidal arm at low resolutions. The bulge component is very unlikely to play an important role here, as the vast majority of the bulge particles is located inside the merger remnant rather than the tidal tail. So we need to address the question if the resolution of the stellar disc of the progenitor galaxy is important or if the resolution of the dark matter halo of the progenitor galaxy plays a crucial role in this respect. The halo component could cause perturbations in the stellar material of the tidal arm which then could grow and finally collapse. However, it could as well be the resolution of the stellar component itself which causes the collapse.
In order to study the effects of both, we have created two additional models, A2 and D2. They are identical in setup to model A and D, respectively, but their dark matter halos have been realized with different particle numbers (see Table 1). In model A2, the halo bas been sampled with 640000 particles, while in model D2 the halo has been sampled with only 160000. Model A2 shares the resolution of the stellar disc with model A, but the dark halo is resolved with four times more particles than in A, thereby giving A2 the halo resolution of model C. Model D2 also shares the resolution of the stellar disc with model D, but its dark matter halo is resolved with eight times less particles, giving it the halo resolution of model A.
Apart from the different disc / halo resolutions discussed above, the simulations of models A2 and D2 shared the identical set of parameters as used in the other models. The density profiles of the tidal tails for models A2 and D2 are compared with the results of models A and D in Figure 5.
In the tidal tail of model A2, the density evolution of the outer tail is very similar to that of model A. In the inner region of the tail, however, instead of two overdensities in model A there forms only one overdensity in model A2. The peak densities are almost identical. The overall behavior is similar in the sense that dense objects are actually formed in both A and A2.
Model D2 also evolves rather similar to D. There are only small differences between the two simulations. In model D2 there forms a density peak at which is not present in D. Apparently, the formation of this overdensity was caused by the lower resolution dark matter halo of D2. But apart from this one region, the results of D and D2 are similar. Collapse of objects along the tidal tail is still highly suppressed.
If shot noise from the dark halo plays an important role regarding the collapse of objects in simulated tidal tails, this should be visible in model A2 as well as D2. The tidal tail in D2 results from a stellar disc which is as well resolved as in model D, which did not form collapsing objects in its tidal tail. Thus if in model D2 collapsed objects would have formed in the tail, this would indicate that shot noise of the dark halo plays an important role. In addition, as model A2 is otherwise identical to model A, its halo has been given the resolution of model C. So if the resolution of the halo would dominate the collapse of objects in the tidal tail, then this collapse should be effectively suppressed in model A2. However, model A2 still shows collapsed objects as in model A while at the same time the lower resolution halo of model D2 only triggers the collapse of one region in the tidal tail. The rest of the tail is very similar to model D.
In summary, the high resolution dark matter halo in model A2 did not at all suppress the collapse of structures inside the tidal tail. The evolution was very similar to the model with low resolution dark halo, A. On the other hand, the high resolution stellar disc of model D2 did not exhibit collapsing objects like in model A, for example, although the disc in D2 resided in a low resolution dark matter halo. The evolution of the tidal tail was comparable to that of model D, apart from one additional overdense region which formed in D2.
If we would have chosen a single softening length for all particles in the simulation, as is often done when using Plummer softening, this softening length would need to be large enough to keep the most massive particles, i.e. those in the halo, collisionless. This choice would probably result in larger softening lengths than those which we used, possibly suppressing local collapse to some extent.

We conclude that the major effect leading to artificial numerical collapse of structures inside tidal tails of pure -body simulations is the resolution of the stellar disc of the progenitor galaxy which forms the tidal tail. With high enough resolution, collapse of such structures is strongly suppressed. The resolution of the dark halo has some influence on the formation of overdense regions, but the effect is small compared to that of the stellar disc resolution.
3.4 Gas Dynamical Effects on the Formation of TDGs
| Model | |||||
|---|---|---|---|---|---|
| G1 | 32k | 0. | 1 | 1. | 0 |
| G2 | 45k | 0. | 3 | 1. | 0 |
| EG1 | 32k | 0. | 1 | 3. | 0 |
| EG2 | 45k | 0. | 3 | 3. | 0 |
The resolution study of pure -body simulations presented in Section 3.1 resulted in the interesting fact that in such simulations, tidal dwarf galaxies are suppressed if the resolution of the simulations is high enough.
As gas is observed in practically any tidal tail (see Section 1.1), it could possibly be the lacking ingredient in simulations of tidal dwarf galaxy formation. Barnes & Hernquist (1996) argue that gas would not play an important role in triggering the collapse of structures inside a tidal tail. However, their argumentation was based on their result that pure -body simulations of tidal tails, without any gas, all by themselves already lead to the formation of collapsed objects and hence gas would not be required for this process. As we have shown that for our models, such collapse in pure -body simulations is artificial and induced by too low resolution, it seems viable that we explore in how far gas could actually be important for the collapse of structures in tidal tails.
In order to study the effects of gas on tidal tails, we take the setup of model C (see Table 1 for the details) and add a gaseous disc component using the SPH approach. Model C was the lowest resolution simulation in our sample which did not show collapsed objects like those in models A and B in the tail. In addition, including hydrodynamic effects in a merger simulation significantly increases the amount of CPU time required for completion. So model C is a good starting point for the study of gas dynamical effects when taking the increased computational expense into account.
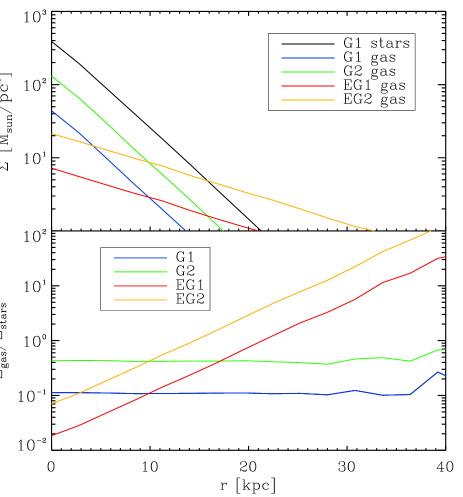
We have run a set of four models including gas, which is distributed in an exponential disc. Our models comprise a combination of discs which have the same scale length as the stellar disc or a scale length which is a factor of larger. The mass of the gaseous discs is either or of the total disc mass, which is fixed at as before in model C. The scale height of the gaseous disk is . The resulting combinations are listed in Table 3. The less massive discs in models G1 and EG1 have been resolved with 32000 SPH particles, while the more massive ones in models G2 and EG2 are represented with 45000 SPH particles. For the setup with the massive, extended gas disc in model EG2, we have matched the surface density of the gas at the solar radius to the observations of Dame (1993), adopting a value of M⊙ pc-2. Scaling our galaxy to the Milky Way, we fix the corresponding surface density in our gas disc accordingly. Model EG2 hence is more likely to resemble the actual gas distribution in late type galaxies. Nevertheless, it is important to study the possible effects of different gas distributions in the progenitor disc on the distribution of gas in the tidal arm. The initial surface densities of the gas components in our models are shown in Figure 6.
In all models, the gas has been evolved with an isothermal equation of state at temperature . The functional form of the gravitational softening of the SPH particles is the same spline kernel used for the -body particles. The gravitational softening length of the SPH particles is always identical to their SPH smoothing length. This approach prevents effects of artificial numerical collapse or stabilization against such (Bate & Burkert, 1997). In addition, we use the gravitational softening length of the stellar disc particles as a lower limit on the softening length of the SPH particles. Note that this can only lead to underestimating the degree of collapse and not to artificially enhancing it. The remaining parameters of the simulation are as described in Section 2.2.
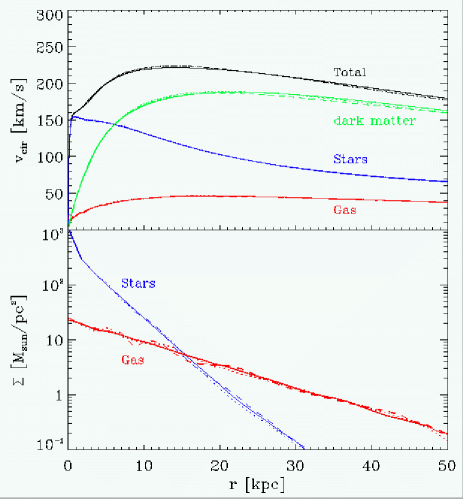
In order to demonstrate the stability of the models, we evolve the high resolution galaxy in model EG2 in isolation. In Figure 7 we show the initial radial profile of the Toomre stability parameter Q (Toomre, 1964) for the gas, modified for a composite disc made out of gas and stars (Wang & Silk, 1994; Naab & Ostriker, 2006):
| (1) |
Here, is the epicyclic frequency, is velocity dispersion and the surface density, indices and refer to gas and stars, respectively. Between 6 and 10 kpc, the disc is only marginally stable, but as we impose a lower limit on the gravitational softening of the gas particles, this slightly stabilizes the disc. We observe no local collapse during the evolution of the disc. The rotation curves and surface density profiles are presented in Figure 8. We show the profiles for and where is the rotation period at the half-mass radius. When the galaxy is scaled to the Milky Way, this corresponds to Myr and Myr, respectively. The galaxy remains globally stable for these time scales. Note that the first encounter of the two galaxies takes place at around , so by this time the perturbation due to the tidal interaction will be much stronger than any effects internal to the galaxy.
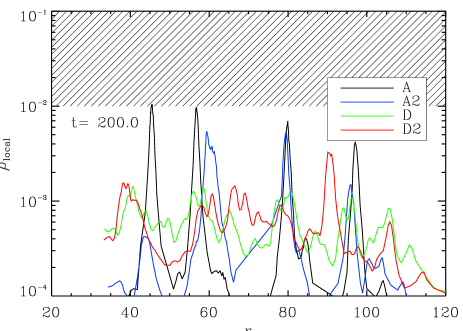
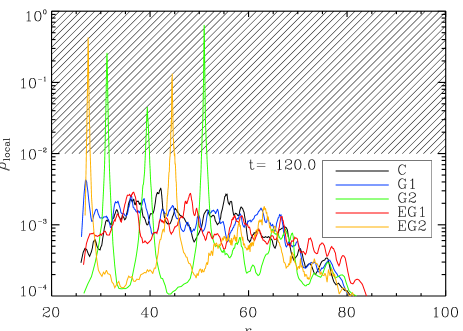
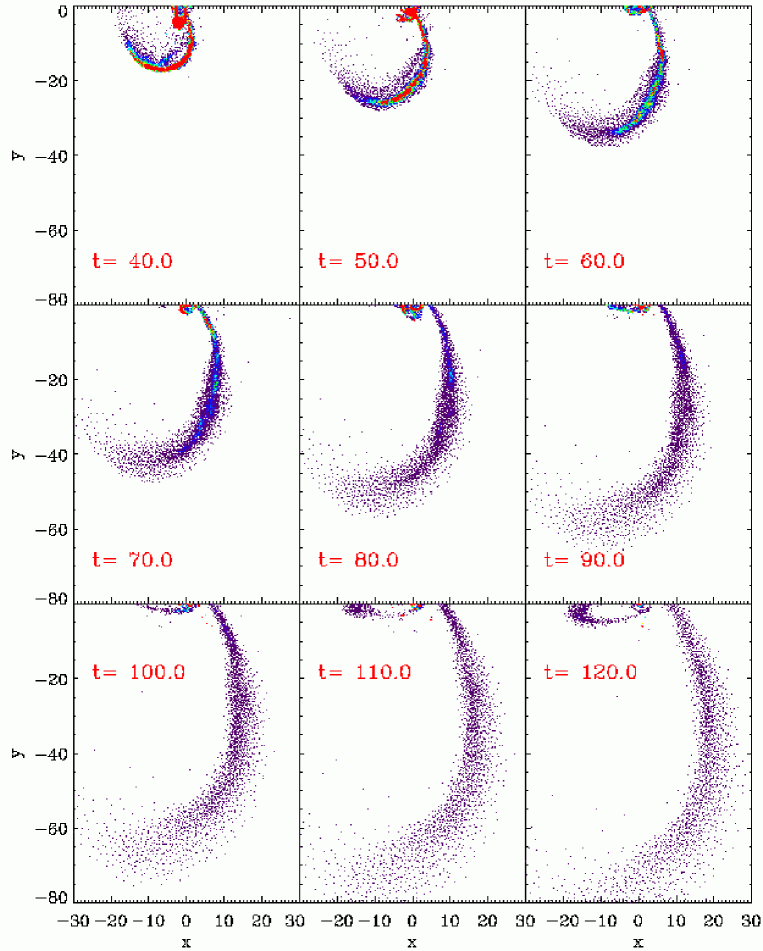
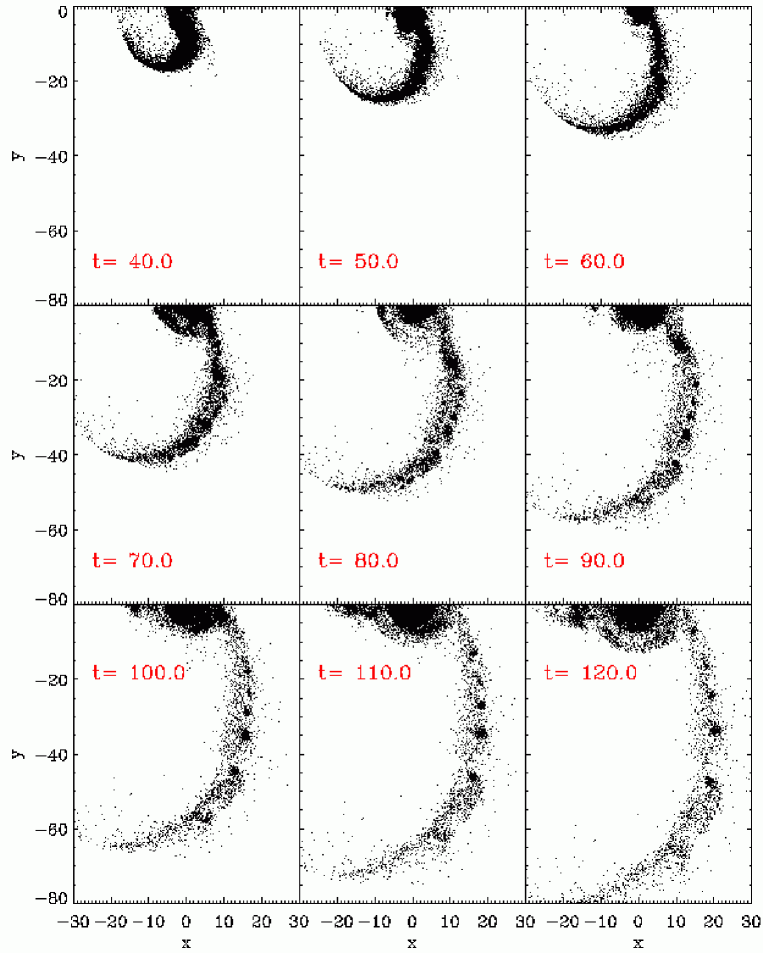
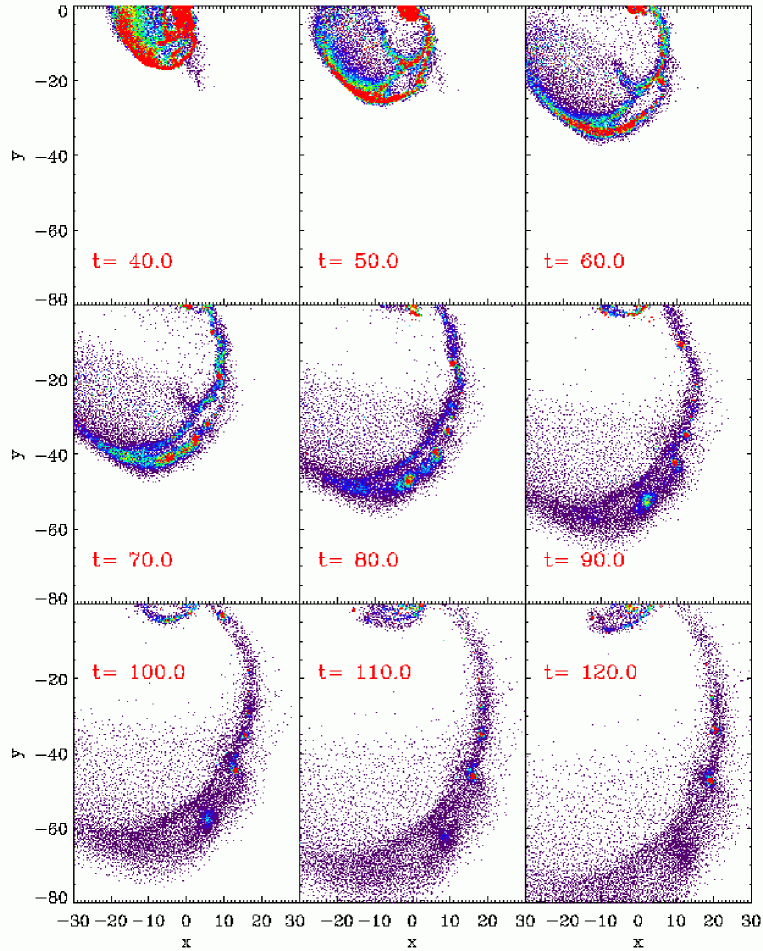
In Figure 9 we show the stellar densities along the tidal tails in all four gas models. Model C is shown as well to allow for an easy comparison. The densities plotted in Figure 9 are obtained in the same way as those plotted in Figures 2-5. Note that only stellar material and no gas was taken into account. Only models G2 and EG2 have developed collapsed structures in the tidal tail at . The central stellar densities inside those collapsed objects is higher than in the low resolution pure -body models A and B. Those failed to reach densities similar to observed dwarf galaxies (shaded region in Figure 9), while the objects in G2 and EG2 easily reach such central densities. To illustrate the formation sequence of these objects, we show the evolution of the tidal tail in model G1 in Figures 10-11 and that of model EG2 in Figures 12-13. The stellar material is shown in the first figures, i.e. 10 for G1 and 12 for EG2, while the evolution of the gaseous component is shown in Figure 11 for G1 and 13 for EG2.
In model G1, the gas is ejected from the progenitor disc together with the surrounding stellar material. It is then compressed into a thin line along the middle of the tidal tail. A significant fraction of the gas in the tidal tail flows back onto the remnant galaxy. Those regions in the tail which have initially high densities (see panel for t=50 in Figure 11) are dispersed by the expanding tail so that at late stages (t=120) no density enhancements have survived in the tidal tail. However, in model EG2, the more extended setup of the gas disc leads to much more gas which is tidally ejected from the progenitor disc. Later in the evolution of the tidal tail in model EG2, the gas forms a transient bifurcated structure (panels at in Figure 13). The gaseous tidal tail extends about further than the stellar tidal tail. Both these features in the gas distribution are also present in observed tidal tails (see e.g. Hibbard et al., 1994; Hibbard & Yun, 1999; Hibbard et al., 2000; Hibbard et al., 2001). At later stages the tidal tail in model EG2 forms collapsing objects () in the mid region of the tail, in contrast to the pure -body model C and model G1.
Model EG2 forms at least 5 collapsed objects in the tidal tail, while in model G1 there exists none. Looking at the distribution of the objects in EG2 more closely, they are slightly offset from the center line of the tidal tail towards its leading outer edge. This is a result of the offset between stellar and gaseous material in the tail, which develops as a consequence of the different initial mass distributions and the dissipative nature of the gas (see Mihos, 2001, for details). Apparently, the gas triggers local gravitational collapse in the tidal tail where its own density is maximal, as one would expect for gravitational instabilities in a gas distribution. For the overall tidal tail, this leads to the collapse of both the stellar and gaseous components slightly offset from the center line of the stellar tail. After the gas has triggered the collapse, it settles in the centers of the objects formed. As our model does not include a numerical recipe for star formation and associated feedback, the gas forms very dense knots in the center of each stellar body.
Note that not only models G2 and EG2 formed collapsed objects. Also in model EG1, there forms a massive collapsed object. However, the object is located in the inner part of the tidal tail and the object falls back into the remnant galaxy where it is tidally disrupted. In the late phase of the tidal tail, as shown in Figure 9, the object has long disappeared. So it would be wrong to believe that massive gas discs in the progenitor galaxy, like in models G2 and EG2, are required to form TDGs. Also a less massive gas disc can lead to their formation, provided that the disc is extended enough. Also, the mere presence of a dissipational component does not lead to the formation of collapsed objects, as clearly indicated by model G1.
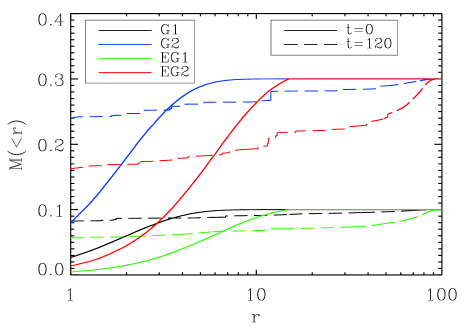
In order to quantify how much gas is torn out of the progenitor disc, we plot radial profiles of the cumulative gas mass for all models, see Figure 14. The profiles of the initial conditions are shown as well as the profiles at , the same evolved state of the tidal arm which is also shown in Figure 9. In model G1, a mass of in gas is contained within the remnant and its immediate surroundings (). This corresponds to of the total gas mass in this model. The distribution of the gas in the tidal tail is very smooth, no gaseous substructures are present in G1. A similar smooth distribution can be seen in model EG1, although more mass is deposited further out in the tidal arm due to the more extended initial distribution. In model G2, the mass of the gas inside and close to the remnant is while the remaining gas with a mass of is located outside. Assuming an inner cut for the tidal tail of , the gas mass inside the tidal tail is , more than a factor of more than in model G1. This clearly shows the effect of the gas distribution in the progenitor disc, as both G1 and EG1 have the same total mass and only differ in the corresponding distribution. In model EG2, much more gas is torn out of the progenitor disc than in any other of our gas models, as one would expect from the massive and extended disc in the progenitor. A mass of around is located at , which corresponds to of the total gas mass. Assuming again an inner cut for the tidal tail of , we find that a mass of resides outside , corresponding to of the total gas mass. Some of the density peaks in Figure 9 can also be found as jumps of the cumulative mass at the location of the object.
We conclude that in contradiction to the previous findings of Barnes & Hernquist (1996), gas is the most important factor in the formation of collapsed objects inside the tidal tails of merging galaxies. Also the processes which lead to the formation of the offset between stellar and gaseous tails are in the end not responsible for the suppression of TDG candidate objects, as suggested by Hibbard & Yun (1999), but in the contrary are closely linked to their formation. The gas disc in the progenitor galaxy needs to supply enough gas into the tidal arm to trigger the onset of collapse there. The mere presence of a dissipative component is not enough.
3.5 Properties of a TDG Candidate


The most massive TDG candidate object formed in our model EG2, located at (20,-48) in the panel of Figure 13, has a mass of , corresponding to M⊙ if the progenitor galaxy is scaled to the Milky Way. About of its mass is in gas while there is no dark matter inside the object. The velocity dispersion of the dark matter halo is too high to allow for their efficient capture in the substructures of the tidal arm.
The object described above is our best candidate object for a TDG. However, if this system resembles observed substructures in tidal tails requires a more detailed study which infers directly observable quantities. In order to assess the properties of our candidate object, we convert the particle distribution into an artificial image which is then analyzed in a similar way as observations to avoid systematic differences. For the details of the procedure, see Naab & Burkert (2003).
We find an ellipticity of our object of . In Figure 15, we show profiles of the rotation velocity, the velocity dispersion and the ratio of the two along the major axis. We plot gas and stars together, which is equivalent to assuming that all gas was converted into stars after the TDG has formed. Although there is a signature of rotation as well as a peak in the velocity dispersion, the magnitude of these are rather low: A maximum rotation velocity of corresponds to km s-1 for a progenitor like the Milky Way, while the maximum dispersion of corresponds to km s-1. Such values might be missed in observations, especially when the object is possibly seen in less favorable projections.
We obtained a stellar surface density profile of our TDG candidate, see Figure 16, following the method used by Naab & Trujillo (2006). The line represents the best fitting Sersic model, corresponding to an index of and an effective radius of , which corresponds to kpc if the progenitor galaxy is scaled to the Milky Way. The high index is caused by the concentration of the gas towards the center. For the profile without the newly formed stars (open circles in Figure 16), we obtain index of and an effective radius of , corresponding to kpc.
The stellar properties of our TDG candidate are similar to observed properties of local group dwarf galaxies (Mateo, 1998) as well as dwarf galaxies in groups or clusters (Jerjen et al., 2000; Barazza et al., 2003; de Rijcke et al., 2005). But given the uncertainty in the evolution of the gas in the shallow potential well, a more realistic model for star formation might well affect the results. We expect that values for and with and without gas outline the most extreme cases.
4 SUMMARY AND DISCUSSION
In this study we investigated the formation of tidal dwarf galaxies. Since the early simulations of Barnes & Hernquist (1992) and Elmegreen et al. (1993), not much work has been done regarding the detailed study of TDG formation. A well accepted model for the formation of TDGs has, up to now, still to be established. We have studied the importance of resolution and force softening on the results of numerical simulations of tidal tails. Although particle noise has already been suggested by Barnes & Hernquist (1992) as an important effect in this respect, no study prior to this work had investigated in detail the effects of different resolutions on TDG formation. Performing an extensive resolution study of pure -body simulations, ranging from a total of particles to particles, we find that with increasing resolution the collapse of objects inside the tidal tail is subsequently suppressed. At a resolution level of particles in the progenitor stellar disc, the tidal tail only develops overdense regions which do not collapse within code time units, corresponding to Gyr if the progenitor galaxy is scaled to the Milky Way. This result is robust at even higher resolution. The collapsed objects formed in the low resolution models cannot be identified with dwarf galaxies, either, as they don’t reach central densities comparable to those of dwarf galaxies. For the initial conditions presented here, we have shown that low resolution disk mergers lead to collapsed objects in the tidal arms whereas for higher resolution this collapse is suppressed.
In order to assess the effects of force softening on such simulations, we have run a second set of simulations in which the gravitational softening length has been varied. Using these models, we have shown that the lack of dense, collapsed objects in the tidal tails for high enough particle numbers is not affected by our particular choice of softening lengths. Furthermore we have demonstrated that the resolution of the stellar disc of the progenitor galaxy seems to be most important to suppress the artificial collapse of regions in the tidal tail. The resolution of the corresponding dark matter halo only plays a minor role in preventing artificially collapsing objects. We hence conclude that whether or not we form collapsed objects mainly depends on the resolution of the initial disk. The previous findings of Barnes & Hernquist (1996) might originate from their low nuemrical resolution. Based on this study, we suggest the use of at least half a million particles for modeling the progenitor disc and twice that number for the dark matter halo in future simulations of tidal dwarf galaxy formation.
We have studied the effects of gas in tidal tails using four different gas distributions in the progenitor discs. The presence of a dissipative component alone is not sufficient for the formation of TDG like objects. However, if the gas reservoir in the progenitor disc is massive and / or extended enough, the tidal tail contains enough gas to trigger the collapse of objects. The TDG candidates in our gaseous models easily reach central densities comparable to dwarf galaxies, in contrast to their counterparts in low resolution pure -body simulations. Our findings favor a dissipation supported scenario for TDG formation, as suggested by Elmegreen et al. (1993) and Kaufman et al. (1994).
We have analyzed the most massive TDG candidate object in greater detail. It has a mass of M⊙ if the progenitor galaxy is scaled to the Milky Way. The object contains no dark matter and of its mass is in gas. There exists a clear signature of rotation but the maximum rotation velocity is km s-1. The velocity dispersion profile shows a clear peak in the center, corresponding to km s-1. The surface density of our candidate object can be reasonably fit with a Sersic profile of index and effective radius of kpc. If we analyze only the stellar component, we find and kpc. Our values for and outline extreme cases, in which either no or all gas is transformed into stars. A detailed model for star formation might result in values somewhere in between. Stellar feedback could also expel some fraction of the gas from the system. We will address these interesting questions in future simulations. Given the uncertainties in the treatment of gas physics and star formation, we find reasonable agreement with observations.
Our results demonstrate the importance of the gas component and the need for high resolution simulations in order to study the formation of TDGs in mergers. In this context, models should ideally also take star formation and stellar feedback into account. Such simulations including additional physical processes are beyond the scope of this paper, which aimed at studying more fundamental effects, including numerical resolution and force softening. More detailed models which take star formation and feedback into account will be investigated in future work.
Acknowledgments
M.W. acknowledges support by the Volkswagen Foundation under grant I/80 040. The simulations have partly been performed at the Rechenzentrum of the Max Planck Society, Garching, Germany. We thank the anonymous referee for his valuable comments.
References
- Aarseth (1963) Aarseth S. J., 1963, MNRAS, 126, 223
- Amram et al. (2004) Amram P., et al., 2004, AJL, 612, L5
- Appel (1985) Appel A. W., 1985, SIAM J. Sci. Stat. Comp., 6, 85
- Athanassoula et al. (2000) Athanassoula E., Fady E., Lambert J. C., Bosma A., 2000, MNRAS, 314, 475
- Balsara (1990) Balsara D. S., 1990, PhD thesis, University of Illinois
- Balsara (1995) Balsara D. S., 1995, JCP, 121, 357
- Barazza et al. (2003) Barazza F. D., Binggeli B., Jerjen H., 2003, A&A, 407, 121
- Barnes (1988a) Barnes J., 1988a, BAAS, 20, 733
- Barnes (1988b) Barnes J., 1988b, ApJ, 331, 699
- Barnes (1989) Barnes J., 1989, Nat, 338, 123
- Barnes (1990) Barnes J., 1990, JCP, 87, 161
- Barnes (1992) Barnes J., 1992, ApJ, 393, 484
- Barnes (2004) Barnes J., 2004, MNRAS, 350, 798
- Barnes & Hernquist (1992) Barnes J., Hernquist L., 1992, Nat, 360, 715
- Barnes & Hernquist (1996) Barnes J., Hernquist L., 1996, ApJ, 471, 115
- Barnes & Hut (1986) Barnes J., Hut P., 1986, Nat, 324, 446
- Bate et al. (1995) Bate M. R., Bonnell I. A., Price N. M., 1995, MNRAS, 277, 362
- Bate & Burkert (1997) Bate M. R., Burkert A., 1997, MNRAS, 288, 1060
- Bell et al. (2006) Bell F., et al., 2006, ApJ, 640, 241
- Benz (1990) Benz W., 1990, in Buchler J. R., ed., Numerical Modelling of Nonlinear Stellar Pulsations: Problems and Prospects Kluwer, Dordrecht, p. 269
- Bournaud et al. (2004) Bournaud F., Duc P.-A., Amram P., Combes F., Gach J.-L., 2004, A&A, 425, 813
- Bournaud et al. (2003) Bournaud F., Duc P.-A., Masset F., 2003, A&A, 411, L469
- Burkert & Hartmann (2004) Burkert A., Hartmann L., 2004, ApJ, 616, 288
- Charmandaris et al. (2002) Charmandaris V., Laurent O., Le Floc’h E., Mirabel I. F., Sauvage M., Madden S. C., Gallais P., Vigroux L., Cesarsky C. J., 2002, A&A, 391, 429
- Clutton-Brock (1972a) Clutton-Brock M., 1972a, Astrophys. Space Sci., 16, 101
- Clutton-Brock (1972b) Clutton-Brock M., 1972b, Astrophys. Space Sci., 17, 292
- Dame (1993) Dame T. M., 1993, in AIP Conf. Proc. 278: Back to the Galaxy pp 267–278
- Dasyra et al. (2006) Dasyra K. M., Tacconi L. J., Davies R. I., Genzel R., Lutz D., Naab T., Burkert A., Veilleux S., Sanders D. B., 2006, ApJ, 638, 745
- Davies et al. (1976) Davies R. D., Elliott K. H., Meaburn J., 1976, MmRAS, 81, 89
- de Rijcke et al. (2005) de Rijcke S., Michielsen D., Dejonghe H., Zeilinger W. W., Hau G. K. T., 2005, A&A, 438, 491
- Deeg et al. (1998) Deeg H. J., Munoz-Tunon C., Tenorio-Tagle G., Telles E., Vilchez J. M., Rodriguez-Espinosa J. M., Duc P. A., Mirabel I. F., 1998, A&AS, 129, 455
- Dehnen (2001) Dehnen W., 2001, MNRAS, 324, 273
- Delgado-Donate et al. (2003) Delgado-Donate E. J., Muñoz-Tuñón C., Deeg H. J., Iglesias-Páramo J., 2003, A&A, 402, 921
- Dubinski et al. (1999) Dubinski J., Mihos J. C., Hernquist L., 1999, ApJ, 526, 607
- Duc et al. (2004) Duc P.-A., Bournaud F., Masset F., 2004, A&A, 427, 803
- Duc et al. (2000) Duc P.-A., Brinks E., Springel V., Pichardo B., Weilbacher P., Mirabel I. F., 2000, AJ, 120, 1238
- Duc et al. (1997) Duc P.-A., Brinks E., Wink J. E., Mirabel I. F., 1997, A&A, 326, 537
- Duc & Mirabel (1998) Duc P.-A., Mirabel I. F., 1998, A&A, 333, 813
- Elmegreen et al. (1993) Elmegreen B. G., Kaufman M., Thomasson M., 1993, ApJ, 412, 90
- Eneev et al. (1973) Eneev T. M., Kozlov N. N., Sunyaev R. A., 1973, A&A, 22, 41
- Fabbiano et al. (2003) Fabbiano G., Krauss M., Zezas A., Rots A., Neff S., 2003, ApJ, 598, 272
- Faber & Gallagher (1978) Faber S. M., Gallagher J. S., 1978, ARA&A, 29, 409
- Fellhauer & Kroupa (2002) Fellhauer M., Kroupa P., 2002, MNRAS, 330, 642
- Franco & Cox (1986) Franco J., Cox D. P., 1986, PASP, 98, 1076
- Gallagher & Hunter (1984) Gallagher J. S., Hunter D. A., 1984, ARA&A, 22, 37
- Genzel et al. (1998) Genzel R., et al., 1998, ApJ, 498, 579
- Genzel et al. (2001) Genzel R., Tacconi L. J., Rigopoulou D., Lutz D., Tecza M., 2001, ApJ, 563, 527
- Gingold & Monaghan (1977) Gingold R. A., Monaghan J. J., 1977, MNRAS, 181, 375
- Heithausen & Walter (2000) Heithausen A., Walter F., 2000, A&A, 361, 500
- Hernquist (1990) Hernquist L., 1990, ApJ, 356, 359
- Hernquist (1993) Hernquist L., 1993, ApJS, 86, 389
- Hernquist & Katz (1989) Hernquist L., Katz N., 1989, ApJS, 70, 419
- Hibbard et al. (2005) Hibbard J. E., et al., 2005, AJL, 619, L87
- Hibbard et al. (1994) Hibbard J. E., Guhathakurta P., van Gorkom J. H., Schweizer F., 1994, AJ, 107, 67
- Hibbard & Mihos (1995) Hibbard J. E., Mihos J. C., 1995, AJ, 110, 140
- Hibbard et al. (2000) Hibbard J. E., Vacca W. D., Yun M. S., 2000, AJ, 119, 1130
- Hibbard et al. (2001) Hibbard J. E., van der Hulst J. M., Barnes J., Rich R. M., 2001, AJ, 122, 2969
- Hibbard & van Gorkom (1996) Hibbard J. E., van Gorkom J. H., 1996, AJ, 111, 655
- Hibbard & Yun (1999) Hibbard J. E., Yun M. S., 1999, AJ, 118, 162
- Jerjen et al. (2000) Jerjen H., Binggeli B., Freeman K. C., 2000, AJ, 119, 593
- Jernigan (1985) Jernigan J. G., 1985, in IAU Symp. 113: Dynamics of Star Clusters Vol. 113. pp 275–283
- Jernigan & Porter (1989) Jernigan J. G., Porter D. H., 1989, ApJS, 71, 871
- Kaufman et al. (1994) Kaufman M., Elmegreen B. G., Thomasson M., 1994, in Mass-Transfer Induced Activity in Galaxies p. 404
- Khochfar & Burkert (2006) Khochfar S., Burkert A., 2006, A&A, 445, 403
- Knierman et al. (2003) Knierman K. A., Gallagher S. C., Charlton J. C., Hunsberger S. D., Whitmore B., Kundu A., Hibbard J. E., Zaritsky D., 2003, AJ, 126, 1227
- Kroupa (1998) Kroupa P., 1998, MNRAS, 300, 200
- Li et al. (2004) Li Y., Mac Low M., Klessen R. S., 2004, AJL, 614, L29
- Lucy (1977) Lucy L. B., 1977, AJ, 82, 1013
- Mateo (1998) Mateo M. L., 1998, ARA&A, 36, 435
- Mendes de Oliveira et al. (2001) Mendes de Oliveira C., Plana H., Amram P., Balkowski C., Bolte M., 2001, AJ, 121, 2524
- Merritt (1996) Merritt D., 1996, AJ, 111, 2462
- Mihos (2001) Mihos J. C., 2001, ApJ, 550, 94
- Mihos & Bothun (1997) Mihos J. C., Bothun G. D., 1997, ApJ, 481, 741
- Mihos et al. (1993) Mihos J. C., Bothun G. D., Richstone D. O., 1993, ApJ, 418, 82
- Mihos et al. (1998) Mihos J. C., Dubinski J., Hernquist L., 1998, ApJ, 494, 183
- Mirabel et al. (1992) Mirabel I. F., Dottori H., Lutz D., 1992, A&A, 256, L19
- Mirabel et al. (1991) Mirabel I. F., Lutz D., Maza J., 1991, A&A, 243, 367
- Monaghan (1992) Monaghan J. J., 1992, ARA&A, 30, 543
- Mundell et al. (2004) Mundell C. G., James P. A., Loiseau N., Schinnerer E., Forbes D. A., 2004, ApJ, 614, 648
- Naab & Burkert (2003) Naab T., Burkert A., 2003, ApJ, 597, 893
- Naab et al. (1999) Naab T., Burkert A., Hernquist L., 1999, AJL, 523, L133
- Naab et al. (2006) Naab T., Khochfar S., Burkert A., 2006, AJL, 636, L81
- Naab & Ostriker (2006) Naab T., Ostriker J. P., 2006, MNRAS, 366, 899
- Naab & Trujillo (2006) Naab T., Trujillo I., 2006, MNRAS, 369, 625
- Navarro et al. (1996) Navarro J. F., Frenk C. S., White S. D. M., 1996, ApJ, 462, 563
- Navarro et al. (1997) Navarro J. F., Frenk C. S., White S. D. M., 1997, ApJ, 490, 493
- Negroponte & White (1983) Negroponte J., White S. D. M., 1983, MNRAS, 205, 1009
- Pfleiderer (1963) Pfleiderer J., 1963, Zeitschrift für Astrophysik, 58, 12
- Pfleiderer & Siedentopf (1961) Pfleiderer J., Siedentopf H., 1961, Zeitschrift für Astrophysik, 51, 201
- Press (1986) Press W., 1986, in Hut P., McMillan S., eds, The Use of Supercomputers in Stellar Dynamics Vol. 267 of Lecture Notes in Physics. Springer-Verlag, Berlin Heidelberg New York, pp 184–192
- Richer & McCall (1995) Richer M. G., McCall M. L., 1995, ApJ, 445, 642
- Robertson et al. (2006) Robertson B., Bullock J. S., Cox T. J., Di Matteo T., Hernquist L., Springel V., Yoshida N., 2006, ApJ, 645, 986
- Romeo (1997) Romeo A. B., 1997, A&A, 324, 523
- Sanders & Mirabel (1996) Sanders D. B., Mirabel I. F., 1996, ARA&A, 34, 749
- Saviane et al. (2004) Saviane I., Hibbard J. E., Rich R. M., 2004, AJ, 127, 660
- Schweizer (1978) Schweizer F., 1978, in Berkhuijsen E. M., Wiebelinski R., eds, IAU Symp. 77: Structure and Properties of Nearby Galaxies Reidel, Dordrecht, pp 279–284
- Skillman (1987) Skillman E. D., 1987, in Lonsdale C. J., Persson C. J., eds, Star Formation in Galaxies NASA, Washington, pp 263–266
- Skillman et al. (1997) Skillman E. D., Bomans D. J., Kobulnicky H. A., 1997, ApJ, 474, 205
- Skillman et al. (1989) Skillman E. D., Kennicutt R. C., Hodge P. W., 1989, ApJ, 347, 875
- Smith et al. (1997) Smith B. J., Struck C., Pogge R. W., 1997, ApJ, 483, 754
- Springel (2005) Springel V., 2005, MNRAS, 364, 1105
- Springel & White (1999) Springel V., White S. D. M., 1999, MNRAS, 307, 162
- Taylor et al. (1994) Taylor C. L., Brinks E., Pogge R. W., Skillman E. D., 1994, AJ, 107, 971
- Temporin et al. (2003) Temporin S., Weinberger R., Galaz G., Kerber F., 2003, ApJ, 587, 660
- Theis (1998) Theis C., 1998, A&A, 330, 1180
- Toomre (1964) Toomre A., 1964, ApJ, 139, 1217
- Toomre & Toomre (1972) Toomre A., Toomre J., 1972, ApJ, 178, 623
- Tran et al. (2005) Tran K. H., van Dokkum P., Franx M., Illingworth G. D., Kelson D. D., Schreiber N. M. F., 2005, AJL, 627, L25
- van der Hulst et al. (1993) van der Hulst J. M., Skillman E. D., Smith T. R., Bothun G. D., McGaugh S. S., de Blok W. J. G., 1993, AJ, 106, 548
- van Dokkum et al. (1999) van Dokkum P. G., Franx M., Fabricant D., Kelson D. D., Illingworth G. D., 1999, AJL, 520, L95
- van Zee et al. (1997) van Zee L., Haynes M. P., Salzer J. J., Broeils A. H., 1997, AJ, 113, 1618
- Vanzi et al. (2002) Vanzi L., Bagnulo S., Le Floc’h E., Maiolino R., Pompei E., Walsh W., 2002, A&A, 386, 464
- Walter & Heithausen (1999) Walter F., Heithausen A., 1999, AJL, 519, L69
- Wang & Silk (1994) Wang B., Silk J., 1994, ApJ, 427, 759
- Weilbacher et al. (2003) Weilbacher P. M., Duc P.-A., Fritze-v. Alvensleben U., 2003, A&A, 397, 545
- Weilbacher et al. (2000) Weilbacher P. M., Duc P.-A., Fritze v. Alvensleben U., Martin P., Fricke K. J., 2000, A&A, 358, 819
- Weilbacher et al. (2002) Weilbacher P. M., Fritze-v. Alvensleben U., Duc P., Fricke K. J., 2002, AJL, 579, L79
- White (1982) White S. D. M., 1982, in Saas-Fee Advanced Course 12: Morphology and Dynamics of Galaxies Saas-Fee Vol. 12: Morphology and Dynamics of Galaxies pp 289–420
- Wilson et al. (2000) Wilson C. D., Scoville N., Madden S. C., Charmandaris V., 2000, ApJ, 542, 120
- Wright (1972) Wright A. E., 1972, MNRAS, 157, 309
- Yabushita (1971) Yabushita S., 1971, MNRAS, 153, 97
- Yoshida et al. (1994) Yoshida M., Taniguchi Y., Murayama T., 1994, PASJ, 46, L195
- Zwicky (1956) Zwicky F., 1956, Ergebnisse der exakten Natuerwissenschaften, 29, 34