11email: silich@inaoep.mx 22institutetext: Sternberg Astronomical Institute, Universitetskii pr. 13, Moscow, 119992 Russia
22email: lozinsk@sai.msu.ru 33institutetext: Special Astrophysical Observatory, Russian Academy of Sciences, Nizhnii Arkhyz, 357147 Karachai-Cherkessian Republic, Russia
33email: moisav@sao.ru 44institutetext: Instituto de Astronomía, Universidad Nacional Autónoma de México, AP 70-264, 04510 México DF, México
44email: margarit@astroscu.unam.mx 55institutetext: European Southern Observatory, Ave., Alonso de Cordova 3107, Casilla 19 Santiago 19001, Chile
55email: jborisso@eso.org 66institutetext: Instituto de Astronomía, UNAM, AP 877, Ensenada 22800, B.C., México
66email: mago@astrosen.unam.mx
On the neutral gas distribution and kinematics in the dwarf irregular galaxy IC 1613
Aims. We study the neutral hydrogen distribution and kinematics in the Local Group dwarf irregular galaxy IC 1613 and compare them with the ionized gas distribution and stellar content of the galaxy. We discuss several mechanisms which may be responsible for the origin of the observed complicated HI morphology and compare parameters of the most prominent kpc-scale HI structure with the multiple SNe scenario.
Methods. The observations were performed with the Vary Large Array of NRAO with a linear resolution pc at the adopted distance of 725 kpc and the spectral channel width of 2.57 km s-1. The numerical calculations have been provided with our 2.5D Lagrangian scheme based on the thin layer approximation.
Results. We found that the ISM of the galaxy is highly inhomogeneous and identified a number of intermediate-scale (200 pc - 300 pc in diameter) HI arcs and shells having expansion velocities of 10 to 20 km s-1. Besides these shells, several giant holes and arc-shaped structures have been revealed, whose radii exceed several hundred parsecs. We found that parameters of the most prominent ( ) kpc-scale structure and the level of the detected star formation activity are inconsistent with the multiple SNe hypothesis.
Key Words.:
Galaxies: irregular – Galaxies: individual – IC1613: ISM – kinematics and dynamics: ISM – supershells1 Introduction
The neutral component of the ISM in star-forming dwarf and spiral galaxies presents a collection of holes, arcs, and shell-like structures (Davies & Tovmassian, 1963; Heiles, 1984; Brinks & Bajaja, 1986; Puche et al. 1992; Ehlerová et al. 2004). Recent studies of late-type dwarf galaxies indicate that of the galaxies present a high column density and sometimes broken rings with cm-2 (Stil & Israel, 2002). The origin of HI holes and shell-like structures has been the subject of debate for more than two decades, but still remains a controversial issue (see, for example, Block & Walter, 2005).
Several different mechanisms have been proposed for the formation of the observed HI distribution and kinematics in different galaxies (see, for example, reviews by Tenorio-Tagle & Bodenheimer, 1988; van der Hulst, 1996).
In the standard approach based on the Dyson & de Vries (1972), Weaver et al. (1977) model, HI shells result from the cumulative effects of multiple stellar winds and supernovae explosions inside the volume presently encompassed by the shell. In such a case the energy released by stellar winds and supernovae is thermalized and generates a hot, high pressure cavity that drives a shock wave into the surrounding interstellar medium (ISM). This shock collects interstellar gas and compresses it into a dense, expanding shell. As the hot cavity continues to expand, the temperature and pressure inside the cavity drop while the outer shell decelerates. When the pressure becomes comparable to that of the ambient medium, the shock wave vanishes. At such a pressure-confined stage (Koo & McKee, 1992), the shell stalls and starts to disintegrate with its local sound speed.
Despite many cases in which this approach gives a plausible explanation for the observed structures (see, for example, Oey & García-Segura, 2004; Vorobyov et al., 2004, 2005; van der Hulst, 1996 and references therein), it was recognized long ago (Heiles, 1984; Tenorio-Tagle & Bodenheimer, 1988) that this scenario cannot explain all types of observed structures. In particular, it encounters problems when attempting to explain the origin of the largest supershells where the stellar associations found within the HI rings seem to be inadequate energy sources. More recently, Rhode et al. (1999) found that in the case of the Holmberg II (HoII) galaxy, the observed upper limits for stellar cluster remnants detected inside neutral hydrogen holes is in many cases inconsistent with the SNe hypothesis. Although a year later Stewart et al. (2000) re-examined their results using deep far-ultraviolet (FUV), H and HI data and decided that the energy deposited by stellar winds and SNe explosions into the ISM of HoII is sufficient, there are many HI holes that have no optical counterparts consistent with the rate of mechanical energy required by the standard model.
In other galaxies, Kim et al. (1999) found only a weak correlation between the LMC neutral hydrogen holes and the HII regions and concluded that the hypothesis of multiple winds and supernovae is inconsistent with their data. Perna & Gaensler (2004) proposed a non-traditional approach to the problem by counting the number of radio pulsars associated with Milky Way supershells. They performed Monte-Carlo simulations for the expected pulsar population and predicted that several tens of radio pulsars may be detected in the directions to the largest Milky Way supershells, and few of them should be found inside regions encompassed by the contours of smaller shells. They found that for the smaller shells their predictions are consistent with the detected pulsar population. However for the giant supershell GSH242-03+37 the observed number of radio pulsars is inconsistent with the multiple winds and supernovae model.
Several other mechanisms that do not require violent stellar activity include collisions of high velocity clouds with galactic disks (Tenorio-Tagle, 1981), the radiation pressure from field stars (Elmegreen & Chiang, 1982), the non-linear evolution of self-gravitating turbulent galactic disks (Wada et al. 2000; Dib & Burkert, 2004), the ram pressure of the intergalactic medium (Bureau & Carignan, 2002), and even exotic mechanisms such as the distortion of the ISM by powerful gamma-ray bursts (Efremov et al. 1999). Despite many efforts attempting to resolve this problem, the detailed comparison of different scenarios with objects detected in different galaxies remain scarce and controversial.
IC 1613 is a member of the Local Group and is located 725 - 730 kpc from the Milky Way (Freedman, 1988a,b; Dolphin et al., 2001). Because of its proximity , it represents an excellent target to study the interplay among the stellar and gaseous components in galaxies. Its HI mass, derived from single-dish observations by Lake & Skillman (1989), is . The galactic rotation is slow, with an almost linear rotation curve inside the inner 2.5 kpc radius, having a maximum amplitude of rotation velocity around 25 km s-1 (Lake & Skillman, 1989).
The stellar population of IC 1613 and its star formation history (SFH) have been studied by a number of authors. Hunter et al. (1993) estimated the total H luminosity to be erg s-1. The associated star formation rate (SFR) is in good agreement with that obtained by Cole et al. (1999), who found SFR yr-1 over the past 10 Myr. Skillman et al. (2003) did not find any evidence for recent episodes of violent star formation in this galaxy from their analysis of color-magnitude diagrams and concluded that it looks unlikely that this and similar galaxies may be responsible for the chemical enrichment of the intergalactic medium. Georgiev et al. (1999) obtained deep UBV photometry for more than 3000 stars in selected areas of IC 1613. The isochrone fit of their data clearly indicates the presence of young (age Myr) stars and stellar associations.
On the other hand, Fabry-Perot interferometric studies of the ionized gas kinematics (Valdez-Gutiérrez et al. 2001; Lozinskaya et al. 2003) revealed a number of supershells covering the whole extent of the optical galaxy. The complex radial velocity pattern indicates expansion velocities up to 60 – 75 km s-1. The majority of the supershells presents an interior OB-association, suggesting a physical link between them. Lozinskaya et al. (2003) identified three large ( pc), bright HI supershells in the north-east part of the galaxy. They expand at km s-1 and overlap with several smaller HII shells distributed along the walls of the HI supershells and are ionized by the young OB-associations. The location of the HII shells and OB-associations suggests that sequential star formation was triggered in this region by larger neutral hydrogen supershells. This implies that, despite a quiet history of star formation, the ISM of IC 1613 has complex gas kinematics and morphology which are linked to the embedded stellar population.
Here we present a study of the neutral hydrogen distribution and kinematics within this galaxy based on Very Large Array observations and compare them with our previous studies of the ionized gas and stellar content in this galaxy. We have found several giant HI rings and arc-like structures. The smallest ones present clear 21-cm line splitting indicating that in these cases we observe expanding shells generated by the embedded OB-associations. The origin of the largest ones is not clear. In particular, the largest, kpc in diameter, structure contains several OB-associations of different ages which appear to be potential sources of energy. However we did not find any indication of a regular shell expansion that leads to an assumption that this structure may represent a case of the standing, pressure-confined shell. This initiated us to compare the observed parameters of the “main supershell” with the standard model based on the multiple winds and supernovae hypothesis. We found that the SNe hypothesis is in poor agreement with the observationally restricted rate of star formation that indicates a different origin of this large, kpc-scale structure.
The paper is organized as follows. In Section 2 we present the results of the observations, the procedures for the data reduction, discuss the neutral hydrogen distribution and the observed velocity field and compare this with properties of the ionized ISM and stellar content of the galaxy. In particular, we discuss properties of the largest HI structure 1 kpc in diameter that is similar to the largest HI supershells detected in other galaxies. In Section 3 we discuss the standard superbubble model, present the results of numerical calculations and compare them with the observed parameters of the “main supershell”, the largest HI structure detected in IC 1613. Section 4 summarizes our results.
2 HI data: morphology, kinematics and their links with other galactic components
Neutral hydrogen observations were made with the Very Large Array (VLA) of The National Radio Astronomy Observatory (NRAO) in configurations B, C and D. The application for the current observations was compiled by E.M. Wilcots. The first results, together with the brief discussion for data reduction, were presented in Lozinskaya et al. (2001).
The data cube has an angular resolution of , and a pixel size of . This implies a linear resolution of pc at the adopted distance of 725 kpc. The spectral channel width is 2.57 km s-1. Our data cube allows us to derive the distribution and kinematics of the HI gas of the entire galaxy. To build up the position-velocity diagrams and the integrated 21-cm line intensity map, the 40 velocity channels, from the 127 available, have been selected by the condition that the signal-to-noise ratio exceeds the limit in three or more adjacent velocity channels (a windowing technique; see, for example, Thornley & Mundy, 1997). The selected channels cover velocity interval from to km s-1.
2.1 The distribution of neutral hydrogen
The integrated 21-cm line flux density derived from our data is . This implies that the total HI mass of the galaxy is . This value is in good agreement with the single-dish measurements by Lake & Skillman (1989; see Table II from their paper), despite a “negative bowl” in our data that leads to a negligible underestimation of the HI mass. An average 1D velocity dispersion of 5.9 km s-1 was measured from our data cube after accounting for the instrumental resolution. This corresponds to a 3D velocity dispersion km s-1. Lake & Skillman (1989) adopted a somewhat larger value of 7.5 km s-1 for the 1D velocity dispersion. However, our data have better spectral and spatial resolutions (5 km s-1 versus 6.2 km s-1, and 7′′ versus 45′′).
The map of the 21-cm line surface brightness is presented in Figure 1a. The three brightest and most clearly defined shells (Shells I, II and III) in the N-E sector of the galaxy have diameters of 200 - 300 pc and are clearly related to the only region of noticeably enhanced star formation discovered so far in the galaxy (see Lozinskaya et al. 2003). Several more shells and arcs of similar sizes having lower surface brightness are clearly identified in Figure 1a and Figure 3a (e.g. Shells IV and V).

Besides these intermediate-size shells, one can easily recognize in Figure 1 several larger arcs and ring-like structures which are similar in size and morphology to the supergiant shells revealed by Meaburn (1980) at the Large Magellanic Cloud. The most prominent structure seen in Figure 1a coincides with the giant region of low surface brightness emission visible in the lower angular resolution map of Lake and Skillman (1989). It is a hole surrounded by a thick HI ridge. The hole has a 5′ diameter ( kpc diameter at the distance adopted for IC 1613) and is centered at RA(2000) = 1h 4m 52s, Dec(2000) = 2. The thickness of the HI ridge, , is about 200 pc. The Northern, Eastern and Southern parts of the ring have a complicated morphology and a kinematical pattern suggesting a feedback from the local star formation. Shells II and III form the brightest part of the northern wall. The northwest sector of the ring appears to have a lower surface brightness and is not clearly identified in our map. Figure 1a also presents the locations of the OB-associations (shown by circles whose radii are proportional to the sizes of the OB-associations) taken from the list of Borissova et al. (2004). Figure 1b displays a population of superbubbles identified by Valdez-Gutiérrez et al. (2001). Hereafter the whole structure is referred to as the “main supershell”.
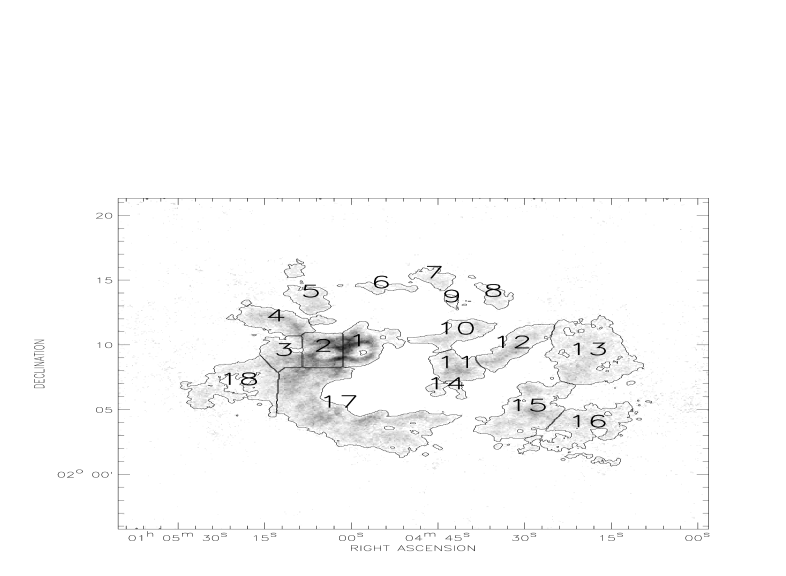
We split the galaxy into a number of segments (Figure 1c) and then calculated the mass of each segment by integration of the HI column density over the segment surface. The segment masses are presented in Table 1. We associate the “main supershell” with segments 1, 2, 11, 14, 17 (Figure 1c). The HI mass of the “main supershell” is then , which corresponds to a total mass of when including helium.
| Segment | 1 | 2 | 3 | 4 | 5 | 6 |
|---|---|---|---|---|---|---|
| Mass () | 5.37 | 6.17 | 2.39 | 2.86 | 1.70 | 0.38 |
| Segment | 7 | 8 | 9 | 10 | 11 | 12 |
| Mass () | 0.57 | 0.48 | 0.14 | 1.57 | 2.20 | 2.66 |
| Segment | 13 | 14 | 15 | 16 | 17 | 18 |
| Mass () | 4.95 | 0.34 | 4.46 | 3.60 | 14.02 | 3.18 |
| Total mass (): 57.0 | ||||||
Another example of a large shell-like structure is an elliptical hole in the HI distribution at the north of the main supershell surrounded by sectors 1, 5, 6, 7, 9 and 10 (Figure 1c). One can also recognize several incomplete shells formed by sectors 10, 11 and 12, sectors 14, 11, 12, 13 and 15, and sectors 13, 15 and 16 at the northwest and west of the main supershell. The size of the shell to the north is similar to that of the “main supershell” but it has a smaller mass, .
2.2 The ionized component, the stellar population, and the local SFR
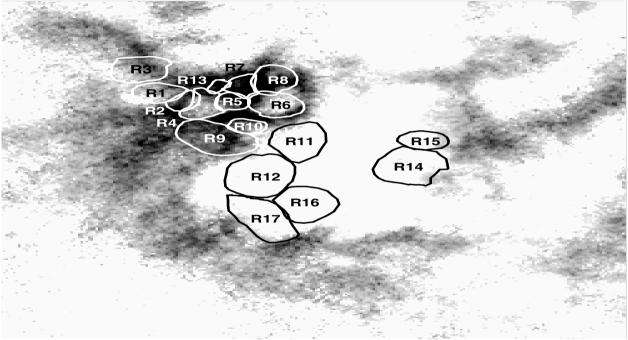
The examination of the distribution of the HII regions and superbubbles from the list of Valdez-Gutiérrez et al. (2001; Tables 4 and 5) shows that many of them are located inside the area encompassed by the contour of the “main supershell” or directly inside the HI ridge. Figure 1b displays the boundaries of the superbubbles found by Valdez-Gutiérrez et al. (2001) superimposed on the HI image of the galaxy. Several superbubbles (R11, R12, R14, R15, R16 and R17) are located inside the “main supershell”. R1, R4 and R6 seem to coincide with HI shells I, II and III identified by Lozinskaya et al. (2003). The rest are projected onto the HI ridge and seem to be associated with the extended region of star formation at the northeast of the galaxy.
The luminosities of the HII regions and superbubbles obtained by Valdez-Gutiérrez et al. (2001) allow us to estimate the mass of the ionized gas and the local star formation rate within the area encircled by the “main supershell”. The mass of the ionized gas associated with superbubbles was calculated from the relation ( ), where radii of superbubbles, , and electron number densities, , were taken from Table 8 of Valdez-Gutiérrez et al. (2001), the thickness of the superbubble shells was assumed to be 1/12 of their radii, and the contribution from the helium was taken into account. For the HII regions we assume a homogeneous density distribution. Then . The rms electron number densities were calculated from the relation , where is the equivalent angular diameter of the HII region expressed in square arc-seconds and is the flux in the units of ergs cm-2 s-1. The radii of the superbubbles and the HII regions were measured in parsecs. The total mass of the ionized component, , is small in comparison with the HI mass of the main supershell and, therefore, we neglected its contribution in our calculations.

We then estimated the local SFR using the calibration given in Kennicutt (1998)
| (1) |
adding up the luminosities of the superbubbles (R11, R12, R14, R15, R16 and R17 from the list of Valdez-Gutiérrez et al. (2001), see Figure 1b) that are located inside the inner boundary of the “main supershell” and therefore may contribute to the dynamics of the supershell. We found that the reddening correction is small because, according to the NASA/IPAC-Extragalactic-Database (NED), is only 0.083 mag. The luminosity then is erg s-1, and the local star formation rate, yr-1. This value has been compared with the SFR (Figure 2) obtained from the analysis of stellar contents of OB-associations from the list of Borissova et al. (2004). The masses, the absolute visual magnitudes, Mv, and the ages of OB-associations within the field of the main supershell are listed in Table 2.
| OB-association | Number of O,B stars | Mass | Mv | Age |
|---|---|---|---|---|
| ( ) | (Myr) | |||
| 31 | 6 | 62 | -4.48 | 25 |
| 32 | 7 | 107 | -5.28 | 19 |
| 33 | 10 | 109 | -4.18 | 24 |
| 34 | 4 | 35 | -3.04 | 30 |
| 35 | 17 | 236 | -5.90 | 16 |
| 36 | 7 | 47 | -5.08 | 20 |
| 37 | 7 | 59 | -5.47 | 18 |
| 38 | 21 | 176 | -5.47 | 18 |
| 39 | 6 | 48 | -4.91 | 21 |
| 40 | 4 | 25 | -5.29 | 19 |
| 41 | 5 | 35 | -4.03 | 25 |
| 42 | 6 | 46 | -3.39 | 28 |
| 43 | 4 | 17 | -3.42 | 28 |
| 44 | 5 | 40 | -3.47 | 28 |
| 45 | 5 | 34 | -4.72 | 22 |
| 46 | 7 | 60 | -5.40 | 18 |
| 47 | 7 | 41 | -4.82 | 21 |
| 49 | 4 | 19 | -3.65 | 27 |
| 50 | 4 | 22 | -2.86 | 34 |
| 51 | 5 | 35 | -3.61 | 28 |
| 52 | 6 | 36 | -3.88 | 28 |
| 53 | 7 | 52 | -3.70 | 26 |
| 54 | 6 | 28 | -4.54 | 23 |
| 55 | 6 | 25 | -4.80 | 21 |
| 56 | 4 | 28 | -5.41 | 18 |
| 57 | 4 | 14 | -3.72 | 27 |
| 58 | 7 | 38 | -5.00 | 20 |
The ages of the associations have been calculated from the observed color-magnitude diagrams which were converted into absolute magnitudes and the true colors for each of the associations. The foreground reddening was calculated for each star individually using the reddening free parameter and the latest calibration equations of Massey et al. (2000) summarized in their Table 4. A distance modulus and a metallicity were adopted where (Dolphin et al. 2000), and (Mateo 1998). The ages were then calculated by the best fit to the theoretical isochrones from the Geneva library (see Lejeune & Schaerer 2001). The likely error of our method is 2-2.5 Myr.
In order to obtain the masses of individual stars and a generalized mass function we have used the procedure proposed by Massey et al. (2000), which allows the determination of the effective temperatures () and the bolometric corrections (BC) for individual stars. The evolutionary tracks from Lejeune & Schaerer (2001) for were then used to establish mass intervals. The local SFR derived from the comparison of this mass function with the constant star formation rate model is yr-1.
Obviously, these values only give a lower limit to the star formation rate within the galactic area covered at the current epoch by the “main supershell”. The mass function obtained from the Borissova et al. (2004) data is incomplete at the low mass end and does not account for the field stars. The local SFR derived from the data is also related to the current epoch and does not consider the diffuse emission. Nevertheless our estimates are reasonable when compared to the mean star formation rate over the galaxy. Therefore we adopt them as a likely limit to the SFR within the field of the main supershell.
2.3 The HI kinematics
In order to study the kinematics of the interstellar medium (ISM) in IC 1613 we obtained position-velocity diagrams in more than 30 directions. The orientations of several scans and the corresponding position-velocity diagrams are presented in Figure 3.


The kinematics of Shells I, II and III were discussed by Lozinskaya et al. (2003). Shells II and III have expansion velocities of 12 - 18 km s-1 and kinematical ages 5.3 - 5.6 Myrs. The expansion velocity of Shell I could not be measured, while its size is similar to that of Shells II and III. Shells IV and V mentioned in the previous section are much fainter and their properties are harder to determine than those of Shells I, II and III. Their radii are about 150 - 200 pc. The position-velocity diagram taken across the eastern part of the “main supershell” (cut 4 at Figure 3a) reveals an offset of approximately of 15 km s-1 between the regular rotation velocity of the galactic gas (which is in between -225 km s-1 and -235 km s-1 in this region) and the maximum values found in the field of the shells. This is -215 km s-1 for shell IV (at 170′′ - 230′′ along the cut), and -220 km s-1 at the field of Shell V (at 250′′ - 315′′ along the cut). These offsets together with the characteristic shapes of local velocity ellipses suggest that the expansion velocities of both of the shells are around 15 km s-1.
The position-velocity diagram taken along a shell formed by sectors 10, 11 and 12 also indicates a regular shell expansion (see cuts 7 and 8 at Figure 3, at 550′′ - 700′′ and 300′′ - 400′′ along the cuts). The expansion velocity is around 13 km s-1. The size of this shell is 3′ that corresponds to a linear diameter, pc, and the HI mass is (see Table 1). Other giant structures at the north and northwest of the “main supershell” show no evidences of regular shell expansion.
The “main supershell” was cut in 12 directions. We did not find any indication of regular expansion of the “main supershell” in any of the cuts. Only local gas perturbations were identified in some sectors of the “main supershell” (e.g. at the positions corresponding to 115′′ - 200′′ of cut 2, 135′′ - 180′′ of cut 3, 430′′ - 630′′ of cut 5 and 90′′ - 210′′ of cut 7). The observed local velocities are in the range 215 - 245 km s-1. The best example of the local high velocity flow is observed in the vicinity of the WO star which is located at the southeast wall of the “main supershell” (see Lozinskaya et al., 2001). In this region we probably observe the blow-out of the WO stellar wind from the shell into the low density bubble interior. The local velocities observed in this region (see Figure 3b, at the positions corresponding to 190′′ - 300′′ along the cut 1) fall into the range -205 km s-1 - -250 km s-1. We believe that other arc-shaped structures seen in the inner part of Segment 17 result from the collective feedback given by the associations 26, 34, 36, 37, 38, 42, 45 of Borissova et al. (2004), which are located near the ridge of the “main supershell”. The expansion velocities of the local arcs are less than or equal to 25 km s-1.
The absence of regular expansion and the large thickness of the “main supershell” led us to conclude that if this structure results from the combined action of the embedded groups of massive stars, then the main supershell has already reached its standing position and is now confined by the external gas pressure (see Koo & McKee, 1992).
3 The multiple SNe scenario
In the standard SNe scenario, the shell expansion is supported by a high thermal pressure provided by multiple supernova explosions and stellar winds from massive stars recently formed inside the superbubble volume. In the case of an homogeneous ISM and a constant input rate of mechanical energy, the time evolution of the radius, , the expansion velocity, , and the mass, , of the shell are given by (see Bisnovatyi-Kogan & Silich, 1995, and references therein):
| (2) | |||||
| (3) | |||||
| (4) |
where is the bubble age, is the rate of the mechanical energy deposited by SNe explosions and stellar winds and is the density of the ISM. Eliminating the evolutionary time and the ISM density from equations (2) - (4), one can find the mechanical power, , required to create a shell with radius , mass and expansion velocity :
| (5) |
where is the mass of the shell in units of , is the expansion velocity in units of 10 km s-1 and is the radius of the shell in units of 100 pc.
The transition to the pressure-confined stage occurs when the velocity of the shock approaches the ambient gas turbulent speed, . At that time the shell begins to expand in both directions from the stand-off radius, , with the local sound speed, . This may be consistent with the irregular boundary of the main supershell and with the standard scenario. If this is the case, it takes the shell yr to reach the observed thickness. Thus the detected configuration may be observed for a good fraction () of the total evolutionary time, . The stand-off radius is , where is the inner and is the outer radius of the shell. We assume that
| (6) |
where pc is the mean thickness of the shell. For the rate of mechanical energy we then obtain: erg s-1. This energy input rate requires a coeval star cluster of approximately with a Salpeter initial mass function with a lower and upper mass limits of 1 and 100 . We do not see stellar remnants of such massive clusters in the field of view of the “main supershell”. On the contrary, OB-associations found inside the ring have a wide range of ages (see Table 2) that indicates that in the region encompassed by the main supershell the star formation lasts for more than 30 Myr. This suggests that a continuous star formation rate would be a better approximation for the star formation activity that occurred in this region.
In this case the rate of mechanical energy cannot be approximated by a constant value during the whole evolution. In such a scenario the maximum value is reached Myr after the beginning of star formation (see Leitherer & Heckman, 1995). On the other hand the thermal pressure of the interstellar gas also reduces the shell radius below the standard value (Oey & García-Segura, 2004). The calculated energy may be also affected by the deviation of the ISM density from a homogeneous distribution.
To take into consideration these effects and to obtain a realistic estimate for a SFR that is required to build up a shell of similar to the observed structure, we have provided several numerical runs using for calculations our 2.5D Lagrangian scheme based on the thin layer approximation (see Bisnovatyi-Kogan & Silich 1995; Silich & Tenorio-Tagle 1998). As an input model we adopt an exponential galactic disk with a constant velocity dispersion km s-1,
| (7) |
where is the midplane ISM density. It was assumed that the disk is embedded in a low density gaseous halo whose density was taken to be cm-3. We neglected the small shell distortion (Palouš et al., 1990; Silich, 1992) provided by the slow galactic rotation. The Z-component of the gravitational field was calculated from the equilibrium conditions. The mass and energy deposition rates were calculated from our simplified starburst model (see Silich et al. 2002) assuming that the SFR remains constant until the shell waist attains the observed radius. The SFR and the midplane ISM density were then calculated by iterations from the condition that the expansion velocity of the shell waist becomes equal to the ISM turbulent velocity and the calculated mass of the shell approaches the observed value when the radius of the shell waist reaches 600 pc.
The calculations have been provided for two different (thin and thick) galactic disk models with the characteristic scale-heights of the exponential disk pc and pc, respectively. Figure 4 presents the evolutionary sequence of superbubble shapes for these two cases.


In both cases the bubbles grow faster in the direction of the steepest density gradient. In the case of the thin disk, the superbubble already reaches a typical hour-glass form after 20 Myr (Figure 4a). Soon the shell accelerates rapidly into the low-density galactic halo and the top of the shell is disrupted under the action of Rayleigh-Taylor instabilities. At this age ( Myr), the top of the shell reaches approximately three characteristic Z-heights of the interstellar gas distribution. The remnant is then able to “blow out”, driving its high temperature gas between the fragments into the halo of the host galaxy (Silich & Tenorio-Tagle, 2001), and to establish the cone-like structure seen in Figure 4b. The bubble then loses its thermal pressure and the waist of the shell reaches its standing position at the age Myr. Despite the large size of the cone, the bulk of the swept-up material is located within a thin cylindrical segment around the base of the cone. In this particular case, about 50% of the mass of the remnant is concentrated inside a 400 pc (200 pc above and 200 pc below the midplane of the galaxy) segment.
To fit the observed parameters of the main supershell the midplane gas number density should be cm-3 and the star formation rate SFR yr-1. This value is more then an order of magnitude larger than the local star formation rate, yr-1, derived from the analysis of our data and stellar population of the embedded OB-associations, and approximately three times larger than the average star formation rate obtained by Cole et al. (1999) for the entire galaxy. Thus the thin-disk model is completely inconsistent with the the standard SNe scenario.
In the thick disk case the shell remains almost round after 20 Myr of expansion. Even at the end of the calculations, at Myr, the shell is only slightly distorted by the ISM density gradient (see Figure 4d). The Rayleigh-Taylor instabilities never disrupt the top of the shell and the hot gas remains bound within the cylindrically-shaped remnant slowly expanding in the Z-direction. To fit the observed parameters (the stand-off radius and the mass of the shell), the mid-plane density of the disk should be cm-3 and the star formation rate must be about yr-1. This value significantly ( times) exceeds our limit to the local star formation rate and is only slightly below the mean star formation rate obtained for the entire galaxy. There are also no indications on a massive single stellar cluster that may support shell expansion down to the observed radius. This leads us to the conclusion that multiple SNe hypothesis is inconsistent with the observed parameters of the “main supershell” also in the case of the thick disk ISM distribution. Some different mechanism (e.g. the outward force initiated by the radiation pressure of the field stars, Elmegreen & Chiang, 1982) is required to build up the observed structure.
4 Conclusions
Here we presented the results of our high resolution study of neutral hydrogen distribution and kinematics in a Local Group member, the dwarf irregular galaxy IC 1613 and compared them to our previous examination of the stellar population and ionized component of the ISM in this galaxy. The analysis of the 21 cm line data cube reveals a complicated, highly inhomogeneous structure of the interstellar medium with a number of HI holes, shells and arc-like structures of different sizes and expansion velocities.
We found that smaller shells with diameters of a few hundred parsecs tend to expand with velocities 10 km s km s-1 whereas the largest structures do not present evidences of global expansion. The only exception is the large incomplete shell with mass and expansion velocity, km s-1 at the northwest part of the galaxy. The best example of the large standing structure is an HI hole 1 kpc in diameter surrounded by a neutral hydrogen ring centered at RA(2000)=1h 4m 52s, D(2000)=2deg 07′.
There are many OB-associations of different ages inside the hole whose energetics potentially may be responsible for the development of this structure. To examine this hypothesis we have compared the energy required by the multiple supernovae model with that inferred from the star formation rate derived from the analysis of the embedded stellar population and Hα emission. We found that parameters of the observed structure and the level of the star formation activity detected inside the region encompassed by the contour of the “main supershell” are inconsistent with the SNe hypothesis. This indicates that, as it has been revealed in the past for the largest HI holes in HoII and LMC (Rhode et al. 1999; Broun et al. 1997), some different mechanism is required to build up the largest kpc-size HI structure that is detected in IC 1613.
Acknowledgements.
The authors thank William Wall and Guillermo Tenorio-Tagle for careful reading of the manuscript and suggestions and our referee, Dr. A. Burkert, for his critical comments. We also greatly appreciate help from the stuff of The National Radio Astronomy Observatory (NRAO) where the observations were performed. NRAO is part of the National Science Foundation (USA) and is operated by the Association of Universities Inc. under a contract with the NSF. This study was supported by CONACYT México research grants 47534-F and 40095-F, by DGAPA-UNAM grant IN120802, by Russian Foundation for Basic Research (projects 02-02-06048 and 04-02-16042). A.V.M. also wishes to thank the Russian Science Support Foundation.REFERENCES
- (1) Bisnovatyi-Kogan, G. S. & Silich, S. A. 1995, Rev. Mod. Phys. 67, 661
- (2) Borissova J., Kurtev R., Georgiev L., Rosado M., 2004 Astron. Astrophys., 413, 889
- (3) Brinks, E. & Bajaj, E. 1986, Astron. Astrophys., 169, 14
- (4) Broun, J.M., Bomans, D.J., Will, J. & de Boer, K.S. 1997, Astron. Astrophys., 328, 167
- (5) Bureau, M. & Carignan, C. 2002, AJ, 123, 1316
- (6) Cole, A. A., Tolstoy, E., Gallagher, J. S. et al., 1999, Astron.J., 118, 1657
- (7) Davies, R. D., Tovmassian, H. M. 1963, MNRAS, 127, 45
- (8) Dib, S. & Burkert, A. 2004, Ap&SS, 292, 135
- (9) Dolphin, A., Saha, A., Skillman, E. D., Tolstoy, E., et al., 2001, ApJ, 550, 554
- (10) Dyson, J. E. & de Vries, J. 1972, Astron. Astrophys., 20, 223
- (11) Efremov, Y. N., Ehlerová, S. & Palouš, J. 1999, ApJ, 350, 457
- (12) Ehlerová, S., Palouš, J. & Wünsch, R. 2004, ApSS, 289, 279
- (13) Elmegreen, B. G. & Chiang, W.-H. 1982, ApJ, 253, 666
- (14) Freedman, W., 1988a, ApJ. 326, 691
- (15) Freedman, W., 1988b, Astron.J. 326, 96
- (16) Georgiev L., Borissova J., Rosado M., Kurtev R., Ivanov G., Koenigsberger G., 1999, Astron. Astrophys. Suppl. Ser., 134, 21.
- (17) Heiles, C. 1984, ApJS, 55, 585
- (18) Hunter D. A., Hawley W. N., Gallagher J. S., 1993, Astron. J., 106, 1797
- (19) Kennicutt, R. C. 1998, ARA&A, 36, 189
- (20) Kim, S., Dopita, M. A., Stavelet-Smith, L. & Bessel, M. 1999, A&A, 350, 230
- (21) Koo, B.-C. & McKee, C.F. 1992, ApJ, 388, 93
- (22) Lake, G. & Skillman, E.D. 1989, AJ, 98, 1274
- (23) Leitherer, C. & Heckman, T.M., 1995 , ApJS, 96, 9
- (24) Lejeune, T., Schaerer, D., 2001, A&A, 365, 535
- (25) Lozinskaya, T., Moiseev, A., Afanasiev, V., Wilcots, E., Goss, W. M., 2001, Astronomy Reports, 45, 417 (Astro-ph/0103312)
- (26) Lozinskaya, T., Moiseev, A., Podorvanyuk, N., 2003, Astronomy Letters, 29, 77, (Astro-ph/0301214)
- (27) Massey, P., Waterhouse, E., DeGioia-Eastwood, K., 2000, AJ, 119, 2214
- (28) Mateo, M., 1998, ARA&A, 36, 435
- (29) Meaburn, J. 1980, MNRAS, 192, 365
- (30) Oey, M. S. & García-Segura, G. 2004, ApJ, 613, 302
- (31) Palous J., Franco, J. & Tenorio-Tagle, G. 1990, Astron. Astrophys. 227, 175
- (32) Perna, R. & Gaensler, B. M. 2004, ApJ, 606, 326
- (33) Puche, D., Westpfahl, D., Brinks, E. & Roy, J.-R. 1992, AJ, 103, 1841
- (34) Rhode, K. L., Salzer, J. J., Westpfahl, D. & Radice, L. A. 1999, AJ, 118, 323
- (35) Silich, S. A. 1992, Ap&SS 195, 317.
- (36) Silich, S. & Tenorio-Tagle, G. 1998, MNRAS, 299, 249
- (37) Silich, S., Tenorio-Tagle, G., Muñoz-Tuñón, C., & Cairos, L. M. 2002, AJ, 123, 2438
- (38) Skillman, E. D., Tolstoy, E., Cole, A. A., et al., 2003, ApJ, 596, 253
- (39) Stewart, S. G., Fanelli, M. N., Byrd, G. G., Hill, J. K., Westpfahl, D., Cheng, K.-P., O’Connell, R. W., Roberts, M. S., Neff, S. G., Smith, A. M. & Stecher, T. P. 2000, ApJ, 529, 201
- (40) Stil, J.M. & Israel, F.P. 2002, Astron. Astrophys., 389, 29
- (41) Tenorio-Tagle, G. 1981, Astron. Astrophys. 94, 338
- (42) Tenorio-Tagle, G. & Bodenheimer, P. 1988, ARAA, 26, 145
- (43) Thornley, M. D. & Mundy, L. G. 1997, ApJ, 490, 682
- (44) Valdez-Gutierrez M., Rosado M., Georgiev L., Borissova J., Kurtev R. 2001, Astron. Astrophys., 366, 35.
- (45) van der Hulst, T. 1996, in ASP Conference Ser. v. 106, ed. E.D. Skillman, p.47
- (46) Vorobyov, E. I., Klein, U., Shchekinov, Yu. A. & Ott, J. 2004, Astron. Astrophys., 413, 939
- (47) Vorobyov, E. I., & Basu, S. 2005, Astron. Astrophys., 431, 451
- (48) Weaver, R., McCray, R., Castor, J., Shapiro, P. & Moore, R. 1977, ApJ, 218, 377