Comparison of measured and simulated lateral distributions for electrons and muons with KASCADE
Abstract
Lateral distributions for electrons and muons in extensive air showers measured with the array of the KASCADE experiment are compared to results of simulations based on the high-energy hadronic interaction models QGSJet and SIBYLL. It is shown, that the muon distributions are well described by both models. Deviations are found for the electromagnetic component, where both models predict a steeper lateral shape than observed in the data. For both models the observed lateral shapes of the electron component indicate a transition from a light to a more heavy composition of the cosmic ray spectrum above the knee.
, , , , , , , , , , , , , , , , , , , , , , , , , , , , , , , , , , , , , , ,
1 Introduction
The particle lateral distribution of extensive air showers (EAS)
is the key quantity for cosmic ray ground observations,
from which most shower observables are derived.
The interaction cascade, which is initiated by a high energy
cosmic ray particle in the atmosphere, creates a multitude of
secondary particles, which arrive nearly at the same time but
distributed over a large area perpendicular to the direction
of the original particle.
The disc of secondary particles may extend over several hundred
meters from the shower axis, with maximum density in the center of the
disc, which is called the shower core. Apart from the arrival times, the
density distribution of particles within the shower disc contain all
informations on the primary particle, which are left after it has undergone
a millionfold multiplication process by the atmosphere. However, it is this
multiplication process, that foremost offers the chance to observe cosmic
rays in the ultra and very high energy region at all:
Due to their low flux measurements at ground, carried out with
large arrays of individual detectors which take samples of the shower
disc at several locations, are still the only possible
way to study these high-energy cosmic particles [1].
The lateral distributions of electrons and muons in EAS not only contains
information on the nature of the primary cosmic ray particle, which is
related to astrophysical questions, but it also carries information relevant
to particle physics. While the electromagnetic interactions are thought to
be well understood, this is not true for the high energy hadronic
interactions. The energy range and the kinematical region in which the
first hadronic interactions of the shower development occur are far
beyond the accessible realm of todays accelerator experiments.
Uncertainties in the description of hadronic interactions therefore imply
uncertainties in the prediction of the shape of the lateral distributions
[2].
A parameter, commonly used to describe the form of the lateral density
distribution, is the lateral form parameter in the Nishimura-Kamata-Greisen
(NKG)-function [3, 4, 5], usually
called age. The name expresses the relation
between the lateral shape of the electron distribution and the height of the
shower maximum. Due to the statistical nature of shower development,
the height of the shower maximum is subject to strong fluctuations.
Showers, which have started high in the atmosphere show a flat lateral
electron distribution, as electrons in the electromagnetic cascade suffer
more from multiple scattering processes. Such showers are called old
and are characterised by a large value of the age parameter.
Young showers have started deeper in the atmosphere and
had their maximum more close to observation level. This results in a
steeper lateral electron distribution, which corresponds to a smaller
value of the age parameter. Apart from fluctuations, the
height of the shower maximum depends on energy and mass of the shower
initiating primary. Therefore, the lateral shape parameter is also
sensitive to the mass of the primary.
The mutual interrelation of several independent parameters on which the
form of the lateral shape depends, makes it a delicate task to draw
unique conclusions from the results of the measurements. Moreover, the
interpretation of the measured raw data requires a profound understandig
on the details of the detector response functions. Sophisticated
simulations of the whole event chain that is initiated
by the first collision of an ultrahigh energy cosmic ray particle
with an air nucleus in the upper atmosphere and ends with the registration
of electronical signals in the various detector components are a
prerequisite to any reliable analysis of the lateral distributions of all
particle components.
This view encourages to measure the secondary particle
components separately, which from an experimental point
of view requires several detector components to be
operated simultaneously.
The detector array of the multi detector setup
KASCADE (Karlsruhe shower core and array detector) [6]
is designed to disentangle the electromagnetic, the hadronic,
and the muon component of the shower disc.
Lateral distributions of electrons, hadrons, and muons
(for different muon threshold energies) in the primary energy range
as measured
with KASCADE have already presented in a previous paper [7].
In this paper, the lateral distributions of electrons and muons in
EAS events as measured with the KASCADE array detectors will be
compared with the predictions of detailed Monte Carlo calculations,
which comprise the simulation of the full
cascading process of EAS, the simulation of the array detector
response and the final data reconstruction mechanisms.
Whereas in [7] the parameterisations of the lateral
distributions were analysed for mean values only, here
the reconstruction is also performed on a single event basis.
Special emphasis is given to investigations of the shape of
the lateral distributions, the so-called ’lateral age’, and its dependencies
on primary energy and mass of the cosmic rays.
Contrary to [7], the hadronic component, measured with the
KASCADE central hadron calorimeter, will not be considered in the
present analysis, as well as measurements from
the additional KASCADE muon devices.
The paper is organised as follows: After a brief description of the experimental setup an overview on the simulation methods is given. Then we shortly outline the data reconstruction scheme. A more detailed explanation is given on the method we use for the reconstruction of electron numbers and on function used to describe the measured and simulated lateral shapes. This is followed by the presentation of mean lateral distributions for muons and electrons, as measured with the KASCADE array and a comparison with the results from the simulations. Then we show the results for the lateral shape of individual showers and its dependence on the shower observables electron and muon number. The simulations results, the data will be compared with, are mostly based on the hadronic interaction model QGSJet [8], but simulations with lower statistics based on the SIBYLL model [9] have also been performed. Therefore, results based on the SIBYLL model and the differences in the predictions of both models are discussed at the end of the paper.
2 The KASCADE experiment
The KASCADE experiment is located at the site of the Forschungszentrum
Karlsruhe at an altitude of 110 m above sea level. A central hadron
calorimeter is surrounded by a rectangular array of 252 scintillation detector
stations, equally spaced by 13 m and covering an area of 200x200 m2.
In addition, there is a muon tracking detector with an effective area of
128 m2. The experiment measures the hadronic, muonic and electromagnetic
components of extensive air showers in the energy range of
eV up to eV of the primary particles. A detailed
description of the experiment can be found in [6].
The 252 detector stations of the KASCADE detector array are organized in 16
electronically independent clusters. Each cluster consists of 16 stations,
except the
inner four clusters, where one station per cluster had to give way to the
central detector. The stations of the inner four clusters contain four
liquid scintillation detectors, each with an area of 0.8 m2
read out by one photomultiplier. The stations of the outer clusters contain
two such detectors with 1.6 m2 total area. All photomultiplier signals
of a detector station are added, and the integrated charge of the
signal is recorded, together with the time of the earliest detector hit
by a shower particle. These
detectors are designed to measure arrival time and energy deposits of the
electromagnetic component of the showers and are therefore referred to as
-detectors here.
Additionally, the stations of the 12 outer clusters house 3.2 m2 plastic
scintillation detectors below a shielding of 10 cm lead and 4 cm of
iron, which gives 0.23 GeV threshold for muons. Each detector is read out by 4 photomultiplier devices and in turn
yields time and energy deposit information. Again, the sum of the multiplier
signals is recorded together with the hit pattern and the time of the earliest
detector hit. These detectors measure the muon component and are referred to as
muon-detectors here.
The shower observables which are reconstructed with the KASCADE array data are core position, shower direction and the lateral distribution of electrons and muons. From this, the shower size, expressed as total number of electrons above 3 MeV and a lateral shape parameter will be derived. For the muon component only the total number of muons above 100 MeV can be estimated. Due to the low muon densities, a reliable determination of the lateral shape parameter is in general not possible for single event analysis.
3 Monte Carlo simulation
A reliable interpretation of the data requires a detailed understanding of
the physics of shower development, as well as a detailed knowledge of the
detector response. The whole event chain, starting with
the primary interaction in the upper atmosphere, followed by the
cascading of the shower particles through the air up to the response of
the detectors at KASCADE ground level has been simulated carefully.
The simulation of extensive air showers is performed with the program
CORSIKA (version 6.156 and higher) [10]. For the high energy
hadronic interactions, the models QGSJet (version 01) [8] and SIBYLL
(version 2.1) [9] are used.
Hadronic interactions with energies below 200 GeV are treated with the FLUKA
code [11], and the electromagnetic component is treated with the EGS4
package [12]. The showers were simulated in the energy range from
eV to eV. With respect to computing time
the distribution in energy was chosen to follow a power law with
spectral index . To represent different primary masses, the set
contains equal numbers of showers for five different primary types,
namely protons, helium, carbon, silicon and iron. The position of
the shower cores were distributed randomly all over the array.
For the shower directions an isotropic distribution was chosen.
Output of the program is a list of all particles
reaching KASCADE ground level together with their coordinates, arrival
time, 3-momenta and particle type.
These data are input to the KASCADE simulation program, which is based on the GEANT3 package [13]. The simulation covers the whole experiment, with all its detectors modelled in great detail. All particles from a CORSIKA simulated shower are tracked through the detectors, the surrounding air and the absorber materials. Secondaries, created in interactions with the detector materials are likewise followed. In case of the array stations, energy deposits and timing information are gathered during the tracking step and converted into a photomultiplier signal and a signal time taking into account the light collecting geometry of the detector as well as the specific properties of the scintillation material. Output of this program, concerning the array part, are arrival times and multiplier signals for - and muon-detectors in exactly the same format, that is written by the real experiment after the calibration procedure, i.e. the simulated data can be analysed with the standard KASCADE reconstruction software. A more detailed description of the KASCADE array simulation can be found in [14].
4 Reconstruction of particle density distributions and shower parameters
Detector simulations applied to CORSIKA shower events have also been extensively used for the development and testing of the array data reconstruction algorithms and procedures. As the KASCADE array reconstruction scheme has already been described in several previous papers [6, 7, 14], only a brief overview will be given in this chapter. Those parts of the analysis chain, which are concerned with the reconstruction of the lateral electron distribution and its properties will be described in more detail, as they were subject to modifications applied for the present analysis.
4.1 Reconstruction of the component
Shower direction and shower core position, as well as shower size and the
lateral form parameter (usually known as age parameter) are reconstructed
from energy deposits and detector response times of the -detectors
using an iterative procedure involving three steps.
In the first step a rough estimate of the shower direction, core position and shower size is obtained using fast and robust algorithms, which don’t rely on any fit procedure. In the second step, the shower direction is determined more accurately, by evaluating the arrival times of the first particle in each detector. This yields an inclination resolution better than 0.3 degrees for showers with [6]. Then, corrections depending on core position and shower inclination are applied to the individual detector energy deposits. From this, particle numbers and corresponding particle densities are calculated for each detector. A 4-parameter fit to the spatial distribution of the particle densities yields core position and shower size, and in addition, a lateral shape parameter of the charged particle density distribution. The core position resolution at this level of reconstruction is better than 0.3 m for showers with , the shower size resolution at the percentage level [6]. The e/-detector signals contain contributions also from the muon component, for which must be corrected for, which is performed in the third step of the reconstruction scheme: As the analysis of the muon-detector data proceeds in parallel to the analysis of the e/-detector data, the total muon number is known at the time of step three from the step two muon analysis. Therefore, the expected muon density can be estimated individually for each e/-detector. The resulting signal contribution is then accounted for in the detector probabilities for the Likelihood minimisation function and the combined lateral density distributions are fitted. Since the accuracy in core position is in general not further improved in this step, only shower size and lateral form parameter are varied, yielding the final values of the total electron number , and the shape parameter of the lateral electron density distribution.
4.1.1 Reconstruction of particle densities
Reconstruction of the lateral particle density distribution requires to
interprete the measured energy deposits in terms of particle numbers.
After correcting for different track lengths in the scintillator due to
shower inclination, special attention must be paid to the
-component. The electrons are accompanied by a multitude of
-particles, which fake additional electrons, because the photon
efficiency of the scintillation detectors is roughly %.
The percentage of fake electrons strongly depends on core distance, because
the mean -ratio is a function of core distance.
In addition, the detector efficiency for electrons decreases with increasing
core distance, as their kinetic energy distribution becomes more and more
soft with growing core distance. Moreover, both effects depend on shower
size and primary particle type.
A shower size dependent lateral energy correction function (LECF) has been derived using the Monte Carlo simulations described in chapter 3. This function gives the average expected energy deposit per shower electron as a function of core distance and shower size and thereby accounts for the additional deposit due to accompanying photons and the dependence of the detector efficiency on the kinetic energy of the electrons. Dividing the measured energy deposit by the expected deposit per shower electron, an estimate on the number of electrons, hitting the detector is given.
Figure 1 left shows LECFs for proton induced showers for different shower sizes. The figure also shows the parametrisation of the mean -ratio and the mean energy deposits , per electron and photon, respectively. The energy deposited in average by electrons and accompanying photons in the detector is then given by
| (1) |
From this the functional form of the LECF ist derived according to
| (2) |
where the mean electron and photon energy deposits are assumed to depend
only on the mean kinetic particle energies.
The sudden fall of the LECF starting at the shower center reflects the decrease of the mean kinetic energy of electrons and ’s with increasing core distance. At a core distance of about 30 m, the corresponding loss in detector efficiency becomes compensated by the rising -electron ratio, which yields an increasing fraction of fake deposit due to -particles. At large core distances, ’s fake nearly half one of the average energy deposit per electron.
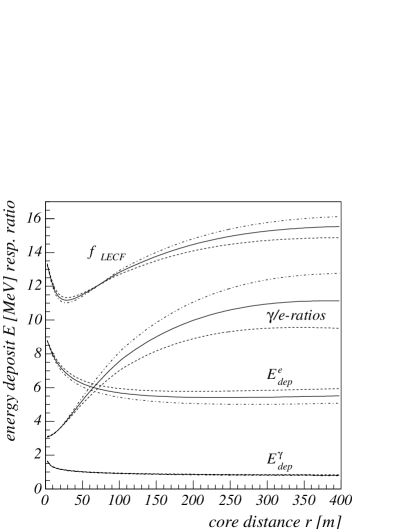
Comparing LECFs calculated for proton and iron primaries, one finds them
to differ by less than % within 100 m from the shower core.
For larger distances, the differences do not exceed %. So one is
free to use a common LECF for the analysis of data, where the primary
particle type is unknown. Moreover, the variation with shower size is
less than 100 m. There is a negligible dependence also on the inclination of the
showers, as geometrical effects are corrected for in the reconstruction
procedures.
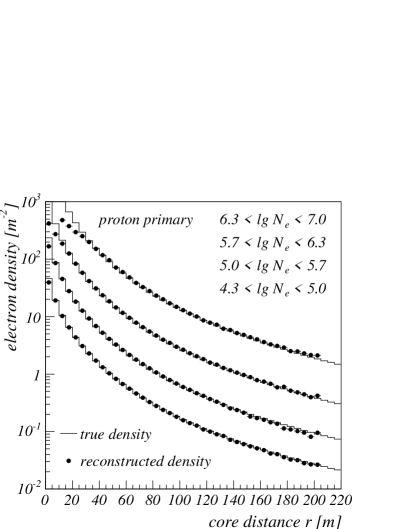
The right part of Figure 1 shows results of the reconstruction when applied to simulated detector deposits, calculated from CORSIKA showers with the detector Monte Carlo, as described above. To check the reliability of the LECF, only electrons and -particles have been tracked in this case. The reconstructed electron distributions compare well to the distributions of the CORSIKA electrons. Deviations from the original distribution are found only for large showers and small core distance. This however is due to saturation effects in the -detectors, which are included in the detector simulation.
4.1.2 Reconstruction of shower parameters size and lateral shape
A theoretically motivated function for the description of the lateral electron density distribution is given by the so-called Nishimura-Kamata-Greisen function (NKG) [3, 4, 5]
| (3) |
with the age parameter , the Moliere radius and the normalising factor
| (4) |
This function has been derived analytically for the case of purely
-induced air showers but is also used to describe the
lateral electron distribution of hadron induced showers. It is however known
[15, 16, 17], that the NKG functions have
shortcomings in fitting measured EAS electron distribution, most
obvious at large core distances. This deficit is usually addressed to the
fact, that the NKG-function was derived for electromagnetic
cascades, whereas hadron induced air showers are a superposition
of a large number of independent electromagnetic showers.
In a typical KASCADE event, the detector distances to the core may extend
up to 200 m. In case of large showers with sizes well above ,
which roughly correspond to a primary energy of 10 PeV,
the detectors close to the shower core become saturated and must be rejected
for the analysis. Thus, the lateral fit range differs for small and for
large showers significantly in both, the upper and lower bound. The deviation
of the NKG-function from the true shape of the lateral electron distribution
therefore gives rise to systematic errors in the lateral shape parameter
(age in the NKG-formula), which depend on the lateral fit range, and
thereby on shower size.
It has been pointed out [7], that fixing the age parameter and
instead varying the scale parameter (Moliere radius in
the NKG-formula)
considerably improves the fit behaviour of the NKG function. Unfortunately,
this does work well only for mean lateral distributions constructed from
a large number of showers. When fitting individual events, which suffer
from large statistical and physical fluctuations between the detector
stations, this method has proven to be significantly unstable. Especially
for small showers it yields unreliable results.
Other ways to cure the defects of the NKG function for describing electron lateral distributions of hadron induced air showers, is to replace it by a different function (e.g. as in [18]) or to modify its functional form by changing the values of the exponents. Indeed, this gives a better adaption to the shape of the lateral density distribution. For this, we replace equation (2) by
| (5) |
with
| (6) |
Testing this function with Monte Carlo data, as optimum values for
the exponents we have found and , when
m for the scale parameter is used. Optimum in this case means
an almost negligible systematic uncertainty in the reconstructed
shower size over the
full KASCADE range as shown in Figure 3. With these values
of and , equation (5)
limits the new parameter to the range . At the same
time, of course, it looses its numerical relation to
the longitudinal development of the electromagnetic cascade, as it is often
mentioned for its original form. In the following, the new parameter
will be called the shape or form parameter of the lateral density
distribution.
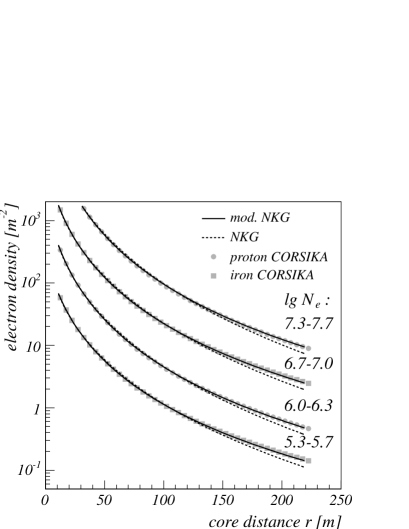
As an example, the left part of Figure 2 compares both variants
of the fit function when applied to mean lateral electron distributions
derived directly (i.e. without detector simulation) from CORSIKA simulated
proton and iron showers for two different shower sizes. The modified
NKG-function adapts much better to the lateral shapes, which becomes most
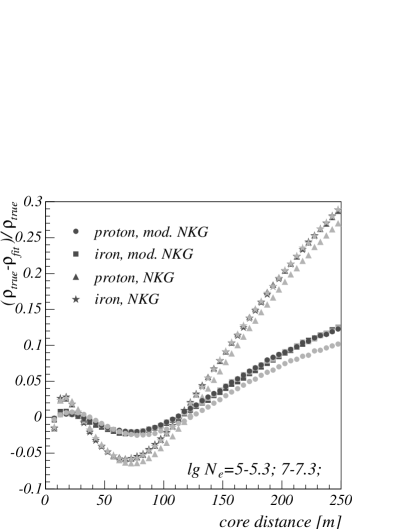
obvious at large core distances. This can be seen even better
at the right part of
Figure 2, which compares relative deviations of the fit function
from the distributions for the original NKG-function and the modified
one. Apart from the very vicinity of the shower core, the modified
NKG-function describes the shape of the mean lateral distributions
with significantly smaller residuals over the whole fit range.
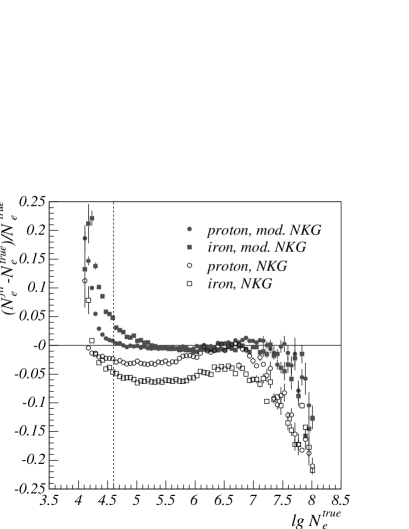
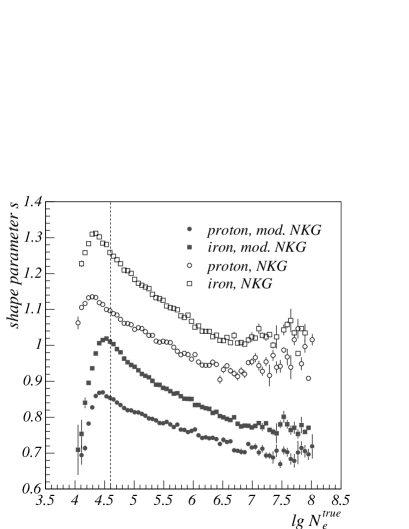
The benefits of the modified NKG-function when applied to individual showers
are shown in Figure 3. The left part shows results for the
estimate of the total shower size, derived by both functions.
With the modified function, the systematic uncertainty in shower
size is almost zero over the range and still below
%
between . Even more convincing, this does
not depend on the primary particle type, contrary to the results from the
original NKG function, which fits iron induced shower profiles
with a larger systematic uncertainty than proton induced ones.
The increasing systematic error towards small shower sizes below
in the case of iron primaries is related to the strongly
growing -ratio. For , the muon density becomes
comparable to the electron density even at small core distances. This makes
it difficult to disentangle both components in the -detector analysis
and finally leads to an overestimate in shower size. For on
the other hand, more and more detectors in the vicinity of the shower core
get saturated. This reduces the available lateral fit range and
results in a quickly growing underestimate of the shower size.
Both effects ultimately establish the limits in the primary energy range for
this analysis to the region between eV and eV.
The right part of Figure 3 compares the results of the original and the modified NKG function for the lateral shape parameter as a function of the reconstructed shower size. As already mentioned, the absolute value of the shape parameter is related to the choice of the scale radius and the values taken for the exponents and of the modified NKG-function and is therefore shifted to smaller values. Apart from that, the results of the conventional fit function exhibit a rise of the shape parameter for due to the described shortcomings of the original NKG-function and the shrinking of the lateral fit range with growing shower size, when detectors near to the shower core become saturated. This artefact is absent with the new fit function. For shower sizes below the KASCADE threshold the age distributions are effected by the selection procedures.
4.2 Reconstruction of the -component
The analysis of the muon-detector signals follows the same line as
in the case of the e/-detectors. Again, the raw signals
are subject to corrections due to shower inclination and core
position using a corresponding muon LECF, which has a much simpler form than
in the e/-case. Additionally, corrections for
punch through from the e/- and hadron component are applied
before the muon densities for every detector are calculated.
Detectors closer than 40 m to the shower core must be excluded from the
analysis, because in this region punch through dominates the signal.
The total muon number is estimated by fitting a
modified NKG function with exponents and .
For the muon component this gives only a moderate improve over the original
NKG-function, which is known to fit muon lateral distributions
already quite well, provided the scale parameter is chosen appropriately.
Here we take m. Due to the low muon densities,
a 2-parameter fit on a single air shower basis proves unreliable. Therefore
the total muon number
of the shower is estimated with a fixed lateral form parameter
and a 1-parameter fit. The muon lateral shape is
parametrized as a function of shower size from CORSIKA simulations
and the actual value is chosen event by event during the iterative
reconstruction. For the considered data sample varies between
0.81 and 0.75, slowly decreasing with increasing shower size.
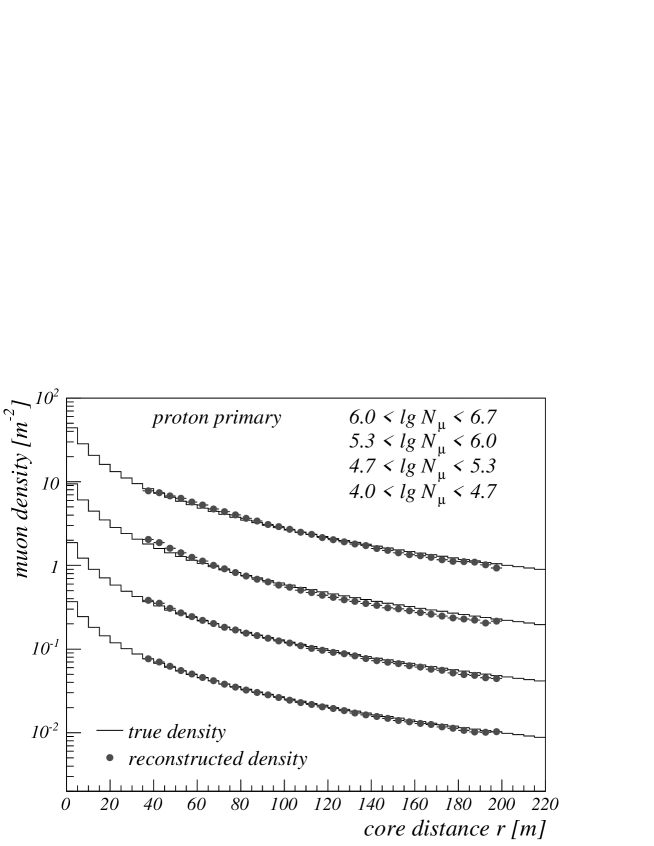
Reconstruction results for muon densities are illustrated in Figure 4, where muon distributions are compared for simulated showers with the corresponding true CORSIKA distributions for several ranges of the reconstructed total muon number . For individual showers, the accuracy of this observable is moderate compared with shower size and is not better than 10 to %. This results from the poor muon statistics in case of small showers and punch through at large shower sizes. The muon size is input to the correction of shower size and shape parameter in the third step of the e/-detector analysis.
5 Comparisons of KASCADE data with Monte Carlo simulations
For the results presented here all measured showers with
have been taken into account. This sample comprises
about 170 000 events measured in a period of nearly 8 years.
Additionally, these data have been enriched with a sample of the many
small showers, which hit the array more frequently due to the steep
energy spectrum of cosmic rays. For this, two KASCADE runs
with in total about 2.5 million recorded shower events were added
to the data set.
All showers, real or simulated, included in this analysis were subject
to the same reconstruction procedure and to the same cuts concerning
trigger condition, core position, inclination angle and shower shape
parameter. Showers are restricted to
core distances less than 90 m from the array center and zenith angles less
than 30 degrees. An additional cut for showers with shape parameter value
, which is close to the upper boundary of the mathematically possible
range, excludes showers which are frequently misreconstructed inside the
array but actually had its core outside, or are just very small showers which
fluctuated in such a way that the reconstruction overestimated their size
by a large amount. Indeed, showers of the second kind are already very
efficiently excluded, by comparing shower sizes as reconstructed
during step one and step two of the analysis, and cutting
on those events, where the difference in the estimated sizes exceeds the
expectations due to the uncertainties in both methods considerably.
Since the energy distribution of the simulated showers represents
a spectral index of while the real data follow an index with
fluctuations to larger values in shower size would be
less pronounced in simulations. Therefore appropriate statistical weights
have been given to the simulated events, as will be explained below.
The analysed KASCADE data set is first compared to the predictions of the QGSJet model, based on a sample of 1.7 Million simulated events. In addition a set of showers with half that statistics but based on the SIBYLL model was analysed (section 5.4).
5.1 Lateral distributions of muons
Figure 5 shows mean lateral distributions from the simulations based on the QGSJet model and compares them with the data. Showers have been sampled in ranges of the reconstructed total muon number per single event. Because of the steeper energy spectrum of the data, fluctuations in muon number would give significantly larger contributions to higher -bins than they would for simulated events. To account for this effect and also to show its result on the form of the lateral distributions, the simulated events have been analysed for a statistical weight representing a spectral index as well as for weights giving an index . The spectral index of the data varies with energy, but will lie somewhere between these values. The small shaded bands in Figure 5 give the simulation results within this bounds. The lower bound of the band always corresponds to the larger absolute index value, i.e. to . The width of the band for an individual primary mass is in the order of the symbol size, only. It is obvious, that the form of the lateral distribution function does only weakly depend on primary energy. Moreover, it can be seen, that the bands of proton and iron nuclei at least partially overlap. The simulations therefore predict, that the form of the muon distribution is not sensitive to the nature of the primary particle. At low energies, proton induced showers show slightly steeper lateral shapes compared to iron primaries, but these differences vanish for higher energies. Even for small showers the differences in the density distributions for showers of either type do not exceed ten percent.
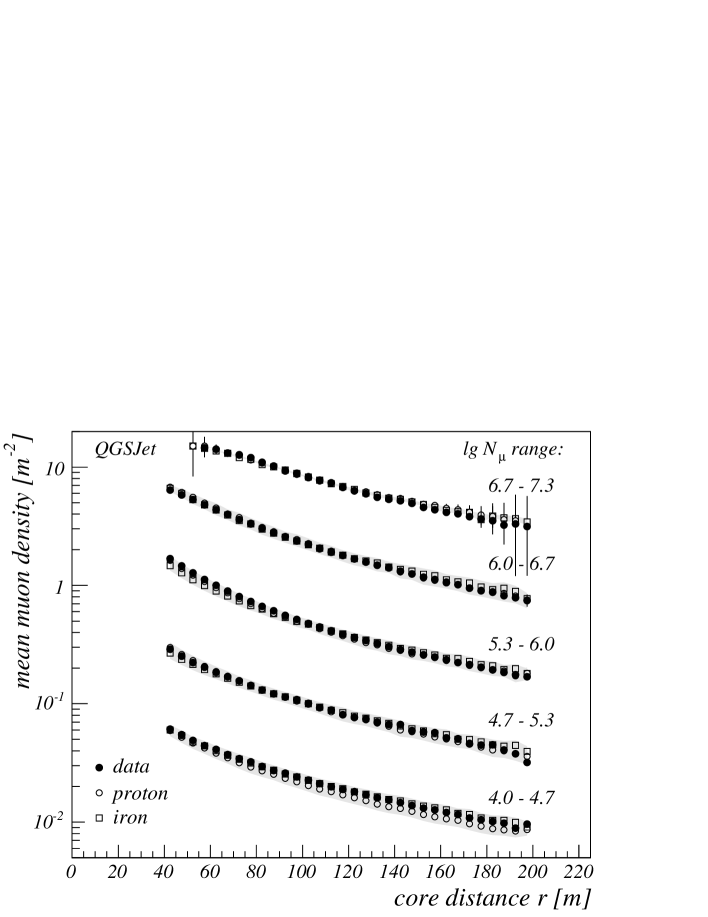
The lateral distributions derived from the data agree quite well with the Monte Carlo predictions. The simulated distributions describe the measurements over the full KASCADE range of core distances and primary energies. The figure thereby shows clearly, why the muon measurements at KASCADE are sensitive to the primary energy, but give no valuable information on the elemental composition of cosmic rays. This is also found by using the SIBYLL model.
5.2 Lateral distributions of charged particles
Figure 6 presents lateral distributions of charged particles as measured by the e/-detectors together with distributions derived from simulations. Though the bulk of particles are electrons, also muons contribute to the e/-detector signals, while contributions of photons are corrected by the LECF, and contaminations by hadrons are negligible. Therefore, the distributions presented here contain besides electrons also muons. All showers have been grouped according to their reconstructed total muon number.
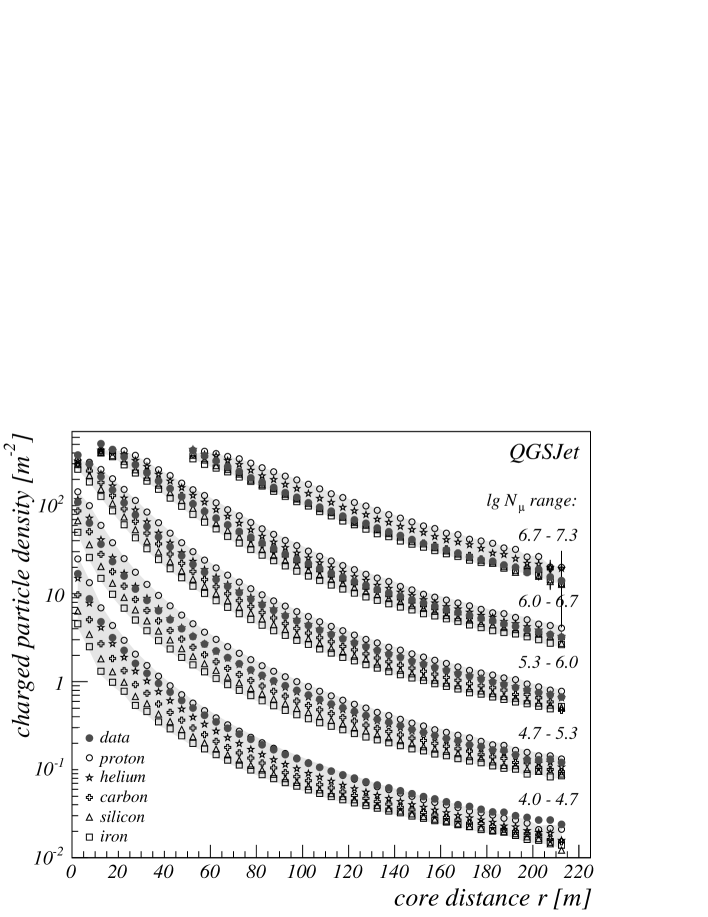
The shaded bands of Figure 6 again indicate the range of
uncertainty, which
results, when the spectral index is varied between
and the primary mass from proton to iron. Again, the lower bounds
corresponds to the larger absolute value , the upper
bounds to . In addition, within each band the lateral
distributions for five different primary masses are shown, assuming a spectral
index of for each. The curve close to the upper bound of each band
now results from the lightest primary, the one close to the lower bound
belongs to iron. This expresses the well known fact [19], that
showers originating from light primaries are more electron rich at sea level
than showers induced by heavy nuclei. The -ratio is
therefore a common starting point for the analysis of
the chemical composition of cosmic rays. Furthermore, the figure
illustrates, that showers induced by light primaries are predicted to
exhibit a slightly steeper electron distribution than showers stemming
from heavy nuclei.
Comparing real data with simulations, one sees that small showers
with fit simulated proton and helium
distributions quite well, while large showers with
are best described by the silicon and iron distributions, i.e. by heavier
primary particles. The figure visualizes the known [6, 20]
variation in the average -ratio with shower size,
which indicates, within the scope of the QGSJet model, a transition of the
primary particle composition from light elements at energies below
to heavy elements at energies above the knee. A detailed analysis of the
electron-muon-number frequency spectrum as measured by KASCADE is subject of
a separate paper, focused on the chemical composition of cosmic rays
[21].
A closer look to Figure 6 also reveals discrepancies between the
data and the QGSJet Monte Carlo predictions. At low energies, i.e. small muon
numbers, the shapes of the measured distributions are slightly flatter
than those of the simulated proton and helium distributions. For
the smallest showers considered here,
the measured particle densities even exceed the expected range of densities
at core distances beyond 120 m. This kind of shortcoming can not be
cured by any assumption on the elemental composition and will be discussed
in more detail in the next chapter.
Looking at the highest energies, where data are best described by heavy
primary showers, simulations seem to show slightly lower densities and a
flatter lateral behaviour at small core distances. In this region however,
data suffer severely from overflows, from which additional uncertainties
result.
It might be worth mentioning, that the shortcomings described here must
originate completely from processes involved in the generation and development
of the -component. The muon component contributes at low shower
energies considerably to the lateral distributions measured with
the -detectors. But the form of the muon lateral distribution is
well described by the Monte Carlo simulations and therefore can not be
drawn to explain the observed deviations.
5.3 The lateral shape parameter
The most obvious differences between the lateral shapes of the
individual elements shown in Figure 6 are simply the
amplitudes of the density functions, and are
related to different -ratios. A more subtle quantity,
which in this kind of representation is difficult to compare, concerns
the functional form or the slope of the lateral distribution.
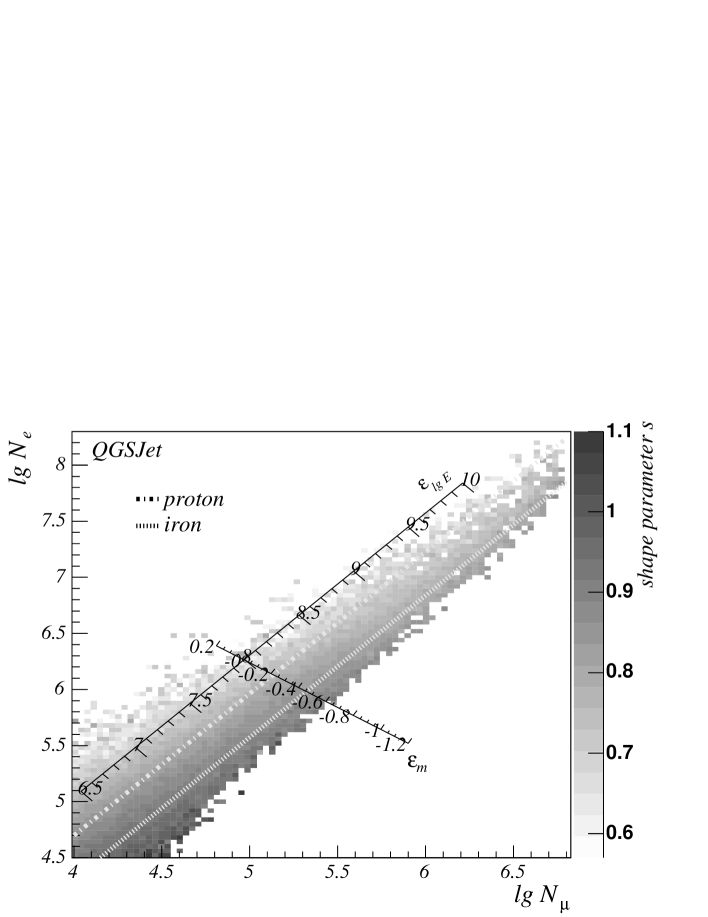
The relations of shower sizes and with the shape
parameter and with the primary mass are illustrated by Figure
7. It shows the mean reconstructed shape parameter value
as a function of the observables and for QGSJet
based simulated showers. The individual events are weighted in energy
to represent an elemental composition according to the results for the
QGS modell as described in [21]. The lines overlaid to the distribution
represent linear approximations to lines of maximum probability for showers
of a single element (here shown only for proton and iron) but
variable energy. It is obvious, that showers from light primaries
are younger in average, i.e. have smaller shape values compared to heavy
primaries, and showers of high energy are younger than low energy ones.
The lines of maximum probability in Figure 7 offer one axis of
a natural, rectangular chosen coordinate system to compare the data with
the simulation results. The new coordinates are related to the
system by a simple rotation around the origin
with an angle of 51,6 degrees, obtained from the simulations.
This coordinate system simply adapts the form of the event distribution in the
plane and will be used in the following
to compare data and Monte Carlo results only on the basis of measured
(or simulated) observables. While the coordinates along the lines of maximum
probability may be associated with an energy estimator ,
the coordinates perpendicular to this direction measure a mass estimator
. These are surely not the best possible estimators for
energy and mass but we do not want to draw quantitative conclusions from them.
Therefore the numerical values of the new coordinates are simply the values
obtained by the rotation from the old values.
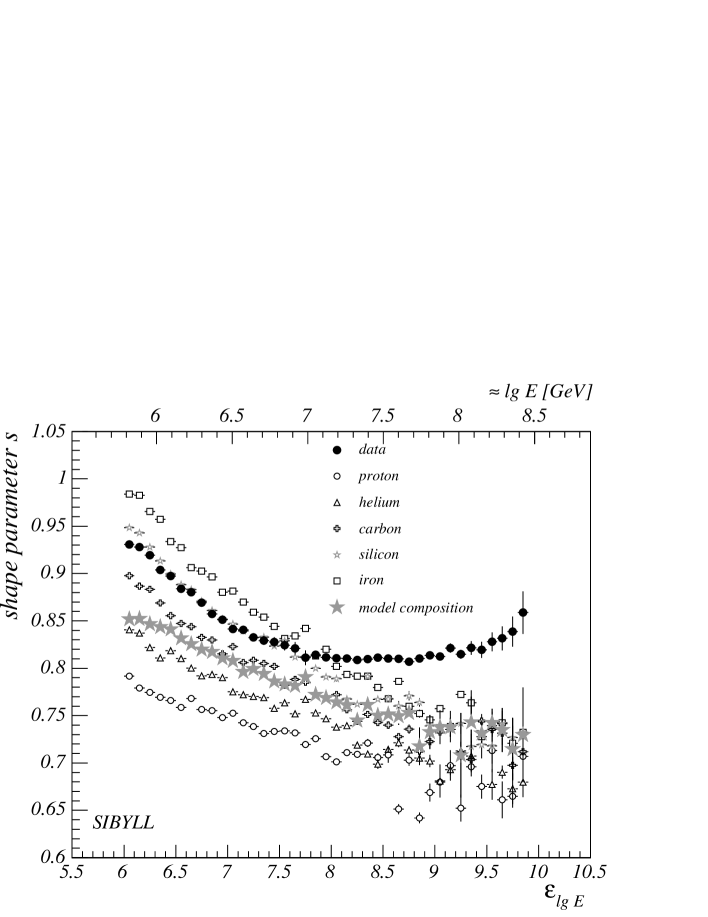
The shape parameter as a function of the energy estimator
is shown in Figure 8 for both, data and Monte Carlo simulations
of all five elements. The Monte Carlo results confirm that showers induced by
heavy primaries are older compared to showers of light primaries. With
increasing energy the shape parameter value decreases for all simulated
elements and reflects the fact, that the height of the shower maximum
decreases with increasing energy.
The data fit into this picture only qualitatively. Up to an energy of about
10 PeV, they follow the line of carbon. For low energies, this suggests
a relatively
heavy composition, which clearly disagrees with the predictions of figure
6. For higher energies, the lateral shape parameter stays almost
constant and crosses the line of iron at an energy of about 30 PeV.
Beyond this crossing point, the absolute values of the measured shape
parameter cannot be explained by any elemental composition within this Monte
Carlo model.

For a more detailed investigation the data distributions are compared
with what would be expected from the simulations,
once a reasonable elemental composition is given. For this, the
simulated shower events of the five elemental masses have been
weighted with individual energy spectra, which have been reconstructed
from an analysis of the measured -spectrum using a
sophisticated unfolding algorithm based on the same model
QGSJet. The resulting model composition favours light elements before
the knee and a significant contribution from heavy elements at energies
above the knee [21]. The effect on the shape parameter as a
function of the energy estimator is also shown in Figure 8. It
is remarkable, that the line of the measured shape parameter values runs
almost parallel to the line representing these adapted Monte Carlo
predictions, but is displaced by a nearly constant amount of
over the whole energy range.
The behaviour shown in Figure 8 may therefore be interpreted in the same way as the form of the lateral shapes in Figure 6. The almost constant value of the shape parameter for energies beyond 10 PeV can be understood as the result of a transition from light to heavy nuclei in the elemental composition of cosmic rays. The offset between the lines of measured and simulated shape simply states, that the simulations in general yield slightly steeper shapes than observed in real showers.
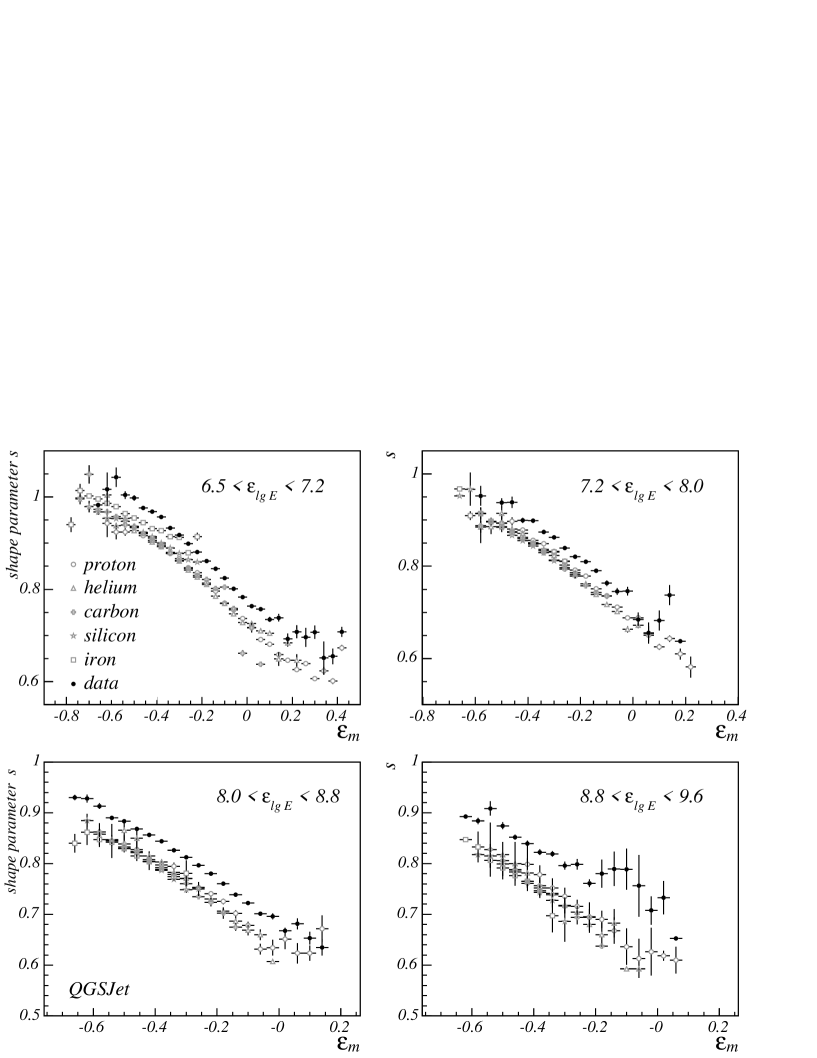
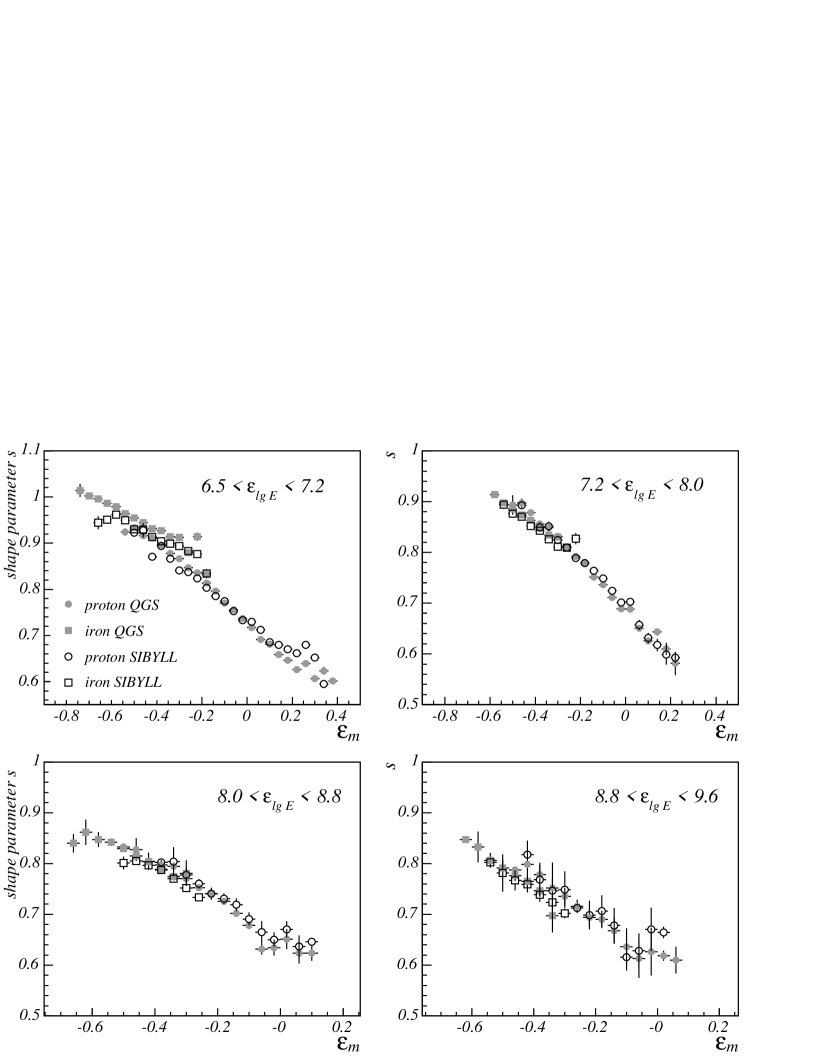
This can be seen even more clearly when looking along the lines of constant values of the mass estimator . This view is given in Figure 9 for several ranges of the energy estimator , i.e. slices of Figure 7 perpendicular to the lines of maximum probability. Here higher mass values correspond to smaller shower size and larger muon content, i.e. to showers which are electron-poorer. Remarkably, all elemental masses can be seen to follow the same (energy dependent) functional dependence between the shape parameter and the mass estimator. On the other hand this may be expected, because showers of heavy primaries develop higher in the atmosphere compared to showers of light nuclei but same energy. However, the total number of electrons present in the shower maximum is, for showers of the same energy, roughly independent of the kind of the primary nucleus. Therefore, a deeply penetrating iron shower may not be distinguishable in shape from a proton shower, which developed very early in the atmosphere. The shape of real showers however does not follow this functional dependence. Measured showers are older in average, with values deviating by an amount from simulated showers, with increasing tendency at the highest energies. This might indicate, that real showers develop at higher altitudes than predicted by the simulations or/and that multiple coulomb scattering plays a distinct and more pronounced role in the development of the real electromagnetic cascade expected from simulations.
5.4 Comparison with the SIBYLL model
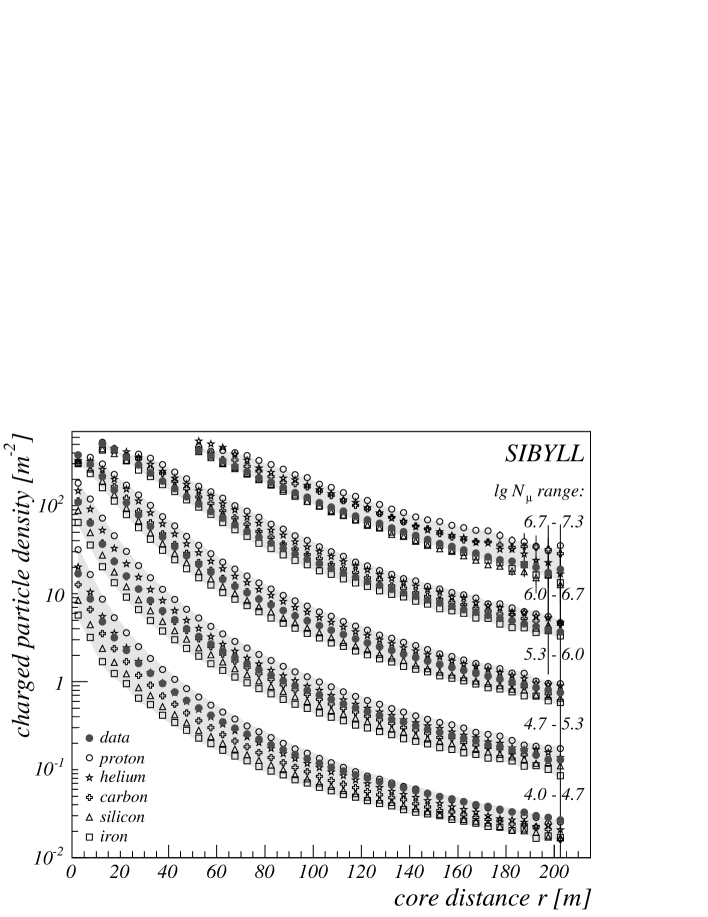
The data have also been compared with simulations based on the
SIBYLL model. While the -ratio for SIBYLL showers is larger
in general, no notable differences to the QGSJet model were found when
comparing the shapes of the lateral distributions of muons for equal
total muon numbers. The lateral shapes of the electron component show
only small differences compared to the QGSJet model, as can be seen
from Figures 10 and 6. The SIBYLL calculated shapes
predict a more heavy composition, as a result of small differences in the
-ratios. In addition, the mean lateral electron distributions
appear a bit younger.
Investigating the dependence of the lateral form parameter on the energy estimator as done in section 5.3, one can see in Figure 11 that SIBYLL describes the data worse compared to QGSJet. The SIBYLL iron curve crosses the data already at an energy of about 10 PeV, so there is no explanation for the measured shape values within this model for larger energies. Comparing with Figure 8 one finds that the mean shape of SIBYLL showers in general is smaller by compared to QGSJet.
It may appear surprising then, that individual SIBYLL showers follow
the same functional dependence on the mass and energy estimators
(and therefore also on and ) than QGSJet showers
do, as can be seen from Figure 12. This shows that the
longitudinal development of the electromagnetic component must be very
similar in both models. The difference in the mean lateral shape parameter
is therefore simply due to a different distribution of SIBYLL events in
the plane (see also [21]). SIBYLL showers are
more electron rich and produce less muons. The abundancy maximum for a
given primary energy is therefore shifted to lighter mass values,
enhancing the weight of younger showers when averaging on the shape
parameter.
6 Summary and conclusions
Lateral electron and muon density distributions of air showers as measured
with the KASCADE array have been
compared to the results of Monte Carlo simulations based on the CORSIKA
program using EGS4 and the two hadronic interaction models QGSJet and SIBYLL.
Muon lateral distributions measured with the KASCADE array muon
detectors were found to be well described by the Monte Carlo
simulations and no significant differences were observed between the
two hadronic interaction models QGSJet and SIBYLL. Moreover, muon lateral
distributions appear very similar in shape, independent of the nature of
the primary particle, so that details of the chemical composition can
not show up in the comparison of data and simulations.
Deviations from the Monte Carlo predictions are found for the lateral
distributions of charged particles, which were reconstructed from the
measurements of the KASCADE e/-detector array.
Common to both models is that they suggest a transition from light to heavy
nuclei in the chemical composition of cosmic rays in the energy range of
1 PeV to 100 PeV. This is consistent with the results of an independent study
[21] based on a detailed analysis of the
frequency spectrum of KASCADE events.
Investigating in detail the shape of the lateral distributions,
the absolute values of the measured shape parameter however
were found to disagree
with the predictions of either of the two hadronic interaction models.
While both models yield the same dependence of the average
shower shape on and , the absolute values
appear smaller than the measured shape values for the whole
considered range in and .
Looking at the mean shape parameter as a function of primary energy,
SIBYLL yields smaller values compared to QGSJet. The reason for
this difference between the two models
is a kind of ”lighter” distribution of events in the
plane in case of SIBYLL: showers of same
primary type and energy contain on average less muons but more electrons
and therefore make up a smaller average value for the shape parameter
compared to QGSJet. However, also the QGSJet predictions still
underestimate the results from measurements by an almost constant
amount of .
Summarizing, both models are not able to describe the measured lateral distribution of the -component correctly. The details of the form of the lateral distribution depend on the hadronic interaction mechanism as well as on electromagnetic cascading processes. Thus, a variant of the QGSJet model that predicts a larger -ratio, would give better consistency with data. However, the discrepancies might also be burried in the electromagnetic cascading algorithm EGS4 and its treatment of the multiple coulomb scattering process. Further improvements in the simulation models may be necessary, to understand and remove the discrepancies between data and simulations. Meanwhile, these results hopefully may help to stimulate this process and provide some additional hints.
References
- [1] Haungs, A., Rebel, H., Roth, M., Rep. Prog. Phys. 55 (2003) 1145
- [2] Drescher, H.J., et al., Astroparticle Physics 21 (2004) 87
- [3] Nishimura, J., in Prog. Cosmic ray Physics vol III, ed. J.G.Wilson (North Holland, Amsterdam, 1956)
- [4] Kamata, K., Nishimura, J., in Prog. Theor. Phys. Suppl. 6 (1958) 93
- [5] Greisen, K., in Prog. Cosmic ray Physics vol III, ed. J.G.Wilson (North Holland, Amsterdam, 1956)
- [6] Antoni, T. et al. - KASCADE Collaboration, Nucl. Instr Meth. A 513 (2003) 490
- [7] Antoni, T. et al. - KASCADE-Collaboration, Astropart. Phys. 14 (2001) 245
- [8] Kalmykov, N.N. and Ostapchenko, S.S., Phys. Atom. Nucl. 56 (1993) 346
- [9] Engel, R. et al., Proc. Int. Cosmic Ray Conf. Salt Lake City (USA) 1 (1999) 415
- [10] Heck, D. et al., Report FZKA 6019, Forschungszentrum Karlsruhe (1998)
- [11] Fassò, A. et al., FLUKA: Status and Prospective for Hadronic Applications, Proc. Monte Carlo 2000 Conf., Lisbon, Oct. 23-26, 2000, A. Kling et al. eds., Springer (Berlin) 955 (2001); www.fluka.org
- [12] Nelson, W.R., Hirayama, H., and Rogers, D.W.O., Report SLAC 265, Stanford Linear Accelerator Center (1985)
- [13] GEANT - Detector Description and Simulation Tool, CERN Program Library Long Writeup W5013, CERN (1993)
- [14] Mayer, H.J., Nucl. Instr. Meth. A 311 (1992) 327
- [15] Yoshida, S. et al., Phys. G: Nucl. Part. Phys. 20 (1994) 651
- [16] Glushkov, A.V. et al., Proc. 25th ICRC vol 6 (1997) p. 233
- [17] Coy, R.N. et al., Astropart. Phys. 6 (1997) 263
- [18] Capdevielle, J.N., Cohen, J., J. Physics G: Nucl. Part. Phys. 31 (2005) 507
- [19] Antoni, T. et al. - KASCADE-Collaboration, Astropart. Phys. 16 (2002) 373
- [20] Weber, J.H. et al., Proc. Int. Cosmic Ray Conf. Salt Lake City (USA) 1 (1999) 415
- [21] Antoni, T. et al. - KASCADE-Collaboration, Astropart. Phys. (2005) in press, preprint astro-ph/0505413