Sequence structure emission in The Red Rectangle Bands
Abstract
We report high resolution (R37,000) integral field spectroscopy of the central region (r14 arcsec) of the Red Rectangle (catalog red rectangle) nebula surrounding HD 44179 (catalog HD44179). The observations focus on the 5800Å emission feature, the bluest of the yellow/red emission bands in the Red Rectangle. We propose that the emission feature, widely believed to be a molecular emission band, is not a molecular rotation contour, but a vibrational contour caused by overlapping sequence bands from a molecule with an extended chromophore. We model the feature as arising in a Polycyclic Aromatic Hydrocarbon (PAH) with 45-100 carbon atoms.
Subject headings:
planetary nebulae: individual(Red Rectangle), ISM: molecules, ISM: lines and bands1. Introduction
The Diffuse Interstellar Bands (DIBs), first identified as interstellar absorption features by Merrill and coworkers (Merrill, 1934, 1936; Merrill & Wilson, 1938), represent one of the longest outstanding mysteries in astronomical spectroscopy.
The DIBs are widely believed to represent the origin bands of molecular transitions. Ultra-high resolution spectroscopy of a selection of the stronger DIBs confirms their molecular origin (Sarre et al., 1995a; Kerr et al., 1998), while the lack of strong correlations between known bands precludes the identification of any transitions to higher vibronic states.
Identification of the carriers of the DIBs will ultimately require accurate measurement of the gas phase spectrum of a range of extraterrestrial molecules to allow direct comparison with astronomical observations (for a review of current work see Schmidt & Sharp (2005); Fulara & Krelowski (2000); Herbig (1995)). However, the parameter space occupied by the range of candidate carriers is prohibitively large for full investigation with the often complex techniques required to record the gas phase spectra.
In order to restrict the parameter space one can turn to studies of alternate environments to the diffuse clouds within which most DIBs are observed. These alternate environments may represent the Rosetta stone for DIB spectroscopy111We thank A. Witt for suggesting this elegant metaphor, private communication, offering the possibility of presenting additional features of the molecular species, providing the much needed additional constraints to the properties of the carrier molecules.
In this paper we present a high spatial, and spectral, resolution study of one of the emission features seen in the Red Rectangle (catalog red rectangle) nebula. At a distance of only 330pc (but see Men’shchikov et al. (2002) for details of a revised distance estimate of 710pc222Hipparchus satellite measurements give a value of 2.622.37mas/yr corresponding to the range 200-4000pc.) the nebula represents an excellent candidate for the study of the injection of material into the interstellar medium by a dying star.
2. The Red Rectangle
The bi-conical Red Rectangle (catalog red rectangle) (RR) nebula (Cohen et al., 1975, 2004) surrounding the evolved, mass-losing star HD 44179 (catalog HD44179) is one of the strongest sources in the sky when observed in the mid-IR (IRAS 06176-1036), where a set of emission features commonly attributed to polycyclic aromatic hydrocarbons (PAHs, Allamandola et al. (1985)) dominate the spectrum. PAH molecules provide an elegant solution to a number of astronomical issues ( UV exctinction curve - (Donn, Hodge & Mentall, 1968); DIBs carriers - (van der Zwet & Allamandola, 1985; Léger & Dhendecourt, 1985); UIB carriers(Geballe, Tielens, Allamandola et al., 1989)). With the coming of age of the new generation of mid IR instrumentation, PAH emission may prove to be a valuable tracer of extragalactic star formation (Peeters et al., 2004). However, at this time, not a single PAH has been unambiguously identified in the ISM (but see Allamandola et al. (1999) for details of composite spectra of the unidentified Infra-red Bands (UIBs) in the mid-IR). At the heart of the problem is the simple fact that while the 3.3, 6.2, 7.7, 8.6 & 11.3m emission features (Peeters et al. (2004)) most likely represent excellent tracers of PAH emission, their origins in the C-H and C-C stretches, abundant in PAH molecules, mean they present little or no diagnostic power. If one is to use PAH emission as a key diagnostic on interstellar processes, within and outside of our Galaxy, it would seem prudent to understand the phenomenon.
Spatially extended optical emission bands near 5800Å were first reported by Schmidt et al. (1980) but currently remain unidentified. A number of detailed descriptions of the form of the Red Rectangle (catalog red rectangle) Bands (RRB) are available in the literature. We refer the reader to Van Winckel et al. (2002), rather than repeat a detailed description. Following Van Winckel et al. (2002) we adopt the standard molecular terminology Red Degraded (RD) to refer to RRBs which show a sharp edge in the blue but an extended tail to the red. The 5800Å band is a typical RD RRB. Several authors have noted the close correspondence of many of the RRBs with prominent DIBs (Scarrott et al., 1992; Sarre et al., 1995b; Van Winckel et al., 2002). While initial observations found strong support for convergence of the RRBs to DIBs, the early works were hampered by low resolution and low signal-to-noise observations. Later works (Glinski & Anderson, 2002) indicate that the blue-ward shifts of the RRBs, with increasing nebular radius, do not appear to asymptotically approach the DIB wavelengths. We concur that the 5800Å RRB, in emission does not blue shift to the wavelength of the prominent 5797Å DIB, at least out to a nebular radius in excess of 14.0arcsec. Glinski & Nuth (1997) initially proposed C3 as the carrier of the 5800Å Red Rectangle (catalog red rectangle) bands. However, more recent observations suggest this is not the case (Glinski & Anderson, 2002). Molecular band structures are reported towards the centre of the nebula with Miyata et al. (2004) presenting molecular PAH emission in the inner regions of the Red Rectangle (catalog red rectangle) in the N band at 10m.
The observations of Glinski & Anderson (2002), from the Densepak IFU on the WIYN telescope, show radial evolution of the molecular emission features. However, the low surface brightness333HST PC F622W m17.6mag(Vega) arcsec2 of the Red Rectangle (catalog red rectangle) in the outer regions of the nebula probed by Glinski & Anderson (2002) (10-14arcsec) has hampered previous attempts to identify the molecular spectra.
Recent years have seen considerable progress in laboratory determination of the spectra of complex astrophysically relevant molecules (Thaddeus & McCarthy, 2001; Linnartz et al., 2004; Schmidt et al., 2003; Ding et al., 2003). There has also been progress in the astronomical detection of molecular species in the absorption spectra of diffuse clouds (Maier et al., 2001; Ádámkovics et al., 2003) and in millimetre-wave emission. However, the low surface brightness and complex spatial structure of the Red Rectangle (catalog red rectangle) have prevented the identification of the carrier of its strong molecular emission.
3. Observations and data reduction
We used the flames instrument at one of the Nasmyth foci of Unit Telescope 2 (UT2 - Kueyen) of the European Southern Observatory’s Very Large Telescope (ESO [VLT]vlt) located upon Cerro Paranal in northern Chile. The observations were undertaken in visitor mode during 29th and 30th December 2004 as part of the Australian guaranteed time awarded for the construction of the OzPoz Fibre positioner by the Anglo-Australian Observatory (Gillingham et al., 2003). The flames instrument comprises a robotic fibre positioner which provides a range of fibre optic feeds to the bench mounted giraffe spectrograph. We used the argus Integral Field Unit (IFU) to record spectra of a 2D region of the nebulosity. The argus IFU, a rectangular array of 2214 micro lenses, can provide two spatial sampling scales, 0.52arcsec and 0.3arcsec, yielding fields of view of 11.447.28arcsec and 6.64.2arcsec respectively. We used the 0.52arcsec lens scale for our observations due to the low surface brightness of the nebula in the regions of primary interest.
flames is operated in a series of standard user modes. We use the HR11 mode for our observations, with a central wavelength of 5728Å and covering a wavelength range of 5597-5840Å at a dispersion of 0.06Å/pixel and a resolution element of 2.6pixels (0.156Å, R37,000). The detector was a 2k4k EEV CCD operated in the standard flames readout mode.
Table 1 and Figure 1 detail the observations undertaken. Observations were performed during two nights in classically scheduled time, 29th and 30th December 2004. While classical mode was not ideal for the observations, due to the large range in airmass for the target during the night (zenith distance 60∘-10∘-60∘), classical mode is a requirement for guaranteed time observations.
argus attached flat frames are observed, after standard star spectra, twice per night, in order to provide relative fibre transmission information and fibre position traces.
Wavelength calibration is derived from standard [VLT]vlt flames daytime calibrations. The giraffe spectrograph offers the ability to observe a number of simultaneous calibration arcs from a Th-Ar lamp during the science observations. Unfortunately, a strong line is located close to the primary wavelength region of interest leading to significant contamination of the low light level nebula spectrum during a 600sec exposures and so simultaneous calibration was not used.
After discussion with ESO support staff we used the argus fast acquisition method whereby acquisition relies on accurate coordinates for a guide star and will be accurate to the order of 1-2arcsec. A more accurate, and repeatable acquisition would incur a considerable overhead for repositioning of guide fibre bundles during the night (with each change in PA). The loss of positional accuracy has not degraded the observations presented.
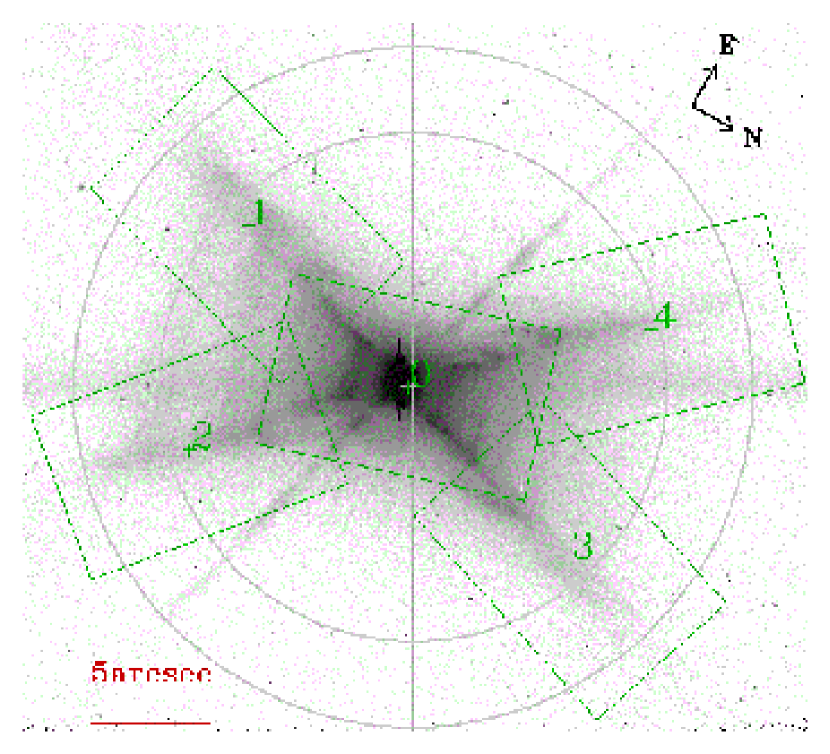
Five base positions were observed within the nebula. One centred on HD 44179 (catalog HD44179), and four aligned along the arms of the nebula, where limb brightening of the bi-conical outflow gives the nebula its highest surface brightness for a given radial distance, and extending out to 14arcsec. Figure 1 illustrates the IFU locations within the nebula. A three point telescope dither was performed at each location to allow removal of IFU lens artifacts and detector defects, of which there are few in the argus/giraffe system.
argus sky fibres were placed, as required by the argus fast acquisition strategy, in a ring centred on the IFU. The ring radius was set to 3arcmins after visual inspection of the DSS image of the region showed that this would avoid the majority of brighter stars in the field regardless of position angle. This avoids the need to reposition the fibres between observations which would introduce a significant overhead.
Simultaneous observations with the UVES fibre system were not possible due to limits on the proximity of UVES fibre placements to the argus IFU.
3.1. Data reduction
During the observing period, pipeline data processing was not available for the HR11 argus setting used. We therefore processed the data using a suite of custom written idl routines and elements of iraf. In most cases, custom idl implementations of common iraf tasks are used to allow accurate propagation of error information.
A 2D bias subtraction was not deemed necessary on inspection of the data and hence the data were overscan corrected only. On preliminary data reduction it was decided a known dark current feature seen on the upper left corner of the giraffe CCD represented a significant contamination to the low light levels recorded in the outer reaches of the nebula and hence subtraction of a dark frame was required. A master dark was constructed from 61200sec dark exposures. This master dark was scaled for the 600sec and 1800sec exposures as no alternate dark frames were available.
Flat fields are combined using variance weighting with outlier rejection. Where three or more science observations are available, at a constant dither position, these frames are also combined in a similar manner.
A fibre trace is generated using the iraf apall task, applied to the flat field frame. The database trace output from the task (a series of 5th order Legendre polynomials) was then used to provide the fibre centres for an optimal extraction algorithm which accounts for fibre cross talk in the spectra. Crosstalk was perceived to be a problem during the initial data reduction due to the high surface brightness contrast between the inner and outer nebula.
The extracted fibre flat frames are applied to the science frames after the spectra are extracted in order to retain the projected relative intensity information between the fibres for the extraction process.
A wavelength solution was derived, using the iraf identify and reidentify tasks (fitting a 6th order Legendre polynomial, with a RMS residual of the order of 0.01Å, for each fibre) using ThAr arc exposures. The spectra are then independently transformed to a common wavelength solution. A single 2D transformation, as might be used for long slit data, is not possible due to discontinuities in the wavelength solution as a function of fibre number at the boundaries between the sub slits which make up the argus slit in the giraffe spectrograph.
On rectification an estimate of the flat field lamp illumination spectrum is created from the rectified flat field and multiplied back into the spectra to remove the lamp signature.
An absolute flux calibration for the data is not required. However, a good relative calibration internal to the spectrum is important for molecular modeling. A response function is derived via repeated observations of the standard star EG-21, a DA white dwarf with few spectral features in the wavelength range of interest and favourably located on the night sky during observations.
Spectra are subsequently corrected to a heliocentric wavelength solution.
3.2. Mosaicing the data
Data from individual cosmic-ray splits (typically 31200sec) are combined using variance weighting and outlier rejection. Three dither positions were observed at each location in the nebula. In order to align the dither data, and to facilitate the ultimate combination of all five telescope pointings into a uniform mosaic, we re-sample the data onto a common regular Cartesian grid after applying the appropriate position angle (PA) rotation to the IFU internal x/y coordinate system, retrieved from the flames header, to account for the five different position angles used during the observations. A number of techniques were subsequently investigated for aligning individual data cubes. Cross-correlation of pseudo-continuum images created from the data cubes proved difficult, due to small image overlaps. Ultimately alignment was performed using an iterative procedure, and the idl implementation of the Amoeba algorithm (Press et al., 1993), as applied to a subsection of each dispersed data cube.
The final analysis of the full data set is ongoing. Data from only a single arm of the nebula (pointing 2 in Figure 1) is used to illustrate our model for the 5800Å emission. Preliminary investigations show that the emission in the remaining three nebula arms are qualitatively similar.
4. Interpreting the 5800Å band.
A number of origins have been proposed for the 5800Å emission. Most interpretations propose the band profile represents a molecular rotation contour (Scarrott et al., 1992; Rouan et al., 1997; Glinski & Nuth, 1997). Glinski & Anderson (2002) demonstrate that the 5800Å cannot be generated via Q, R or P branch rotational emission structures derived from the unknown molecular carrier DIB at 5797Å. Rouan et al. (1997) propose that the RRB has its origins in a supra-thermally rotating PAH molecule, and go on to argue that a PAH of around 40 carbon atoms is implied by the required rotational constants. This model assumes that the DIB carrier at 5797Å is identical to the 5800Å RRB carrier and that angular momentum is accumulated due to a “rocket effect” induced by photo-dissociation events. This effect is required to attain an estimated rotational temperature of 450 K for the 5800Å carriers. Rotational band profiles are always expected of molecular spectra since there exist a large number of energetically accessible rotational states, even when the molecule in question is electronically and vibrationally cold. Thus a single vibronic transition will be derived from a number of individual transitions originating in different rotational states. Energetically accessible vibrational states, potentially pumped by photoexcitation, can produce hot-band features in an electronic spectrum, where the vibronic transitions originate from one of these excited vibrational states. Where the potential energy surfaces (PES), governing the forces on the nuclei in the electronic states, are parallel, the structure of the excitation or emission spectrum will be dominated by sequence bands. This will be the case for a molecule with an extended chromophore since the shape of the underlying molecule will be largely unaltered upon electronic excitation.
4.1. Sequence structure
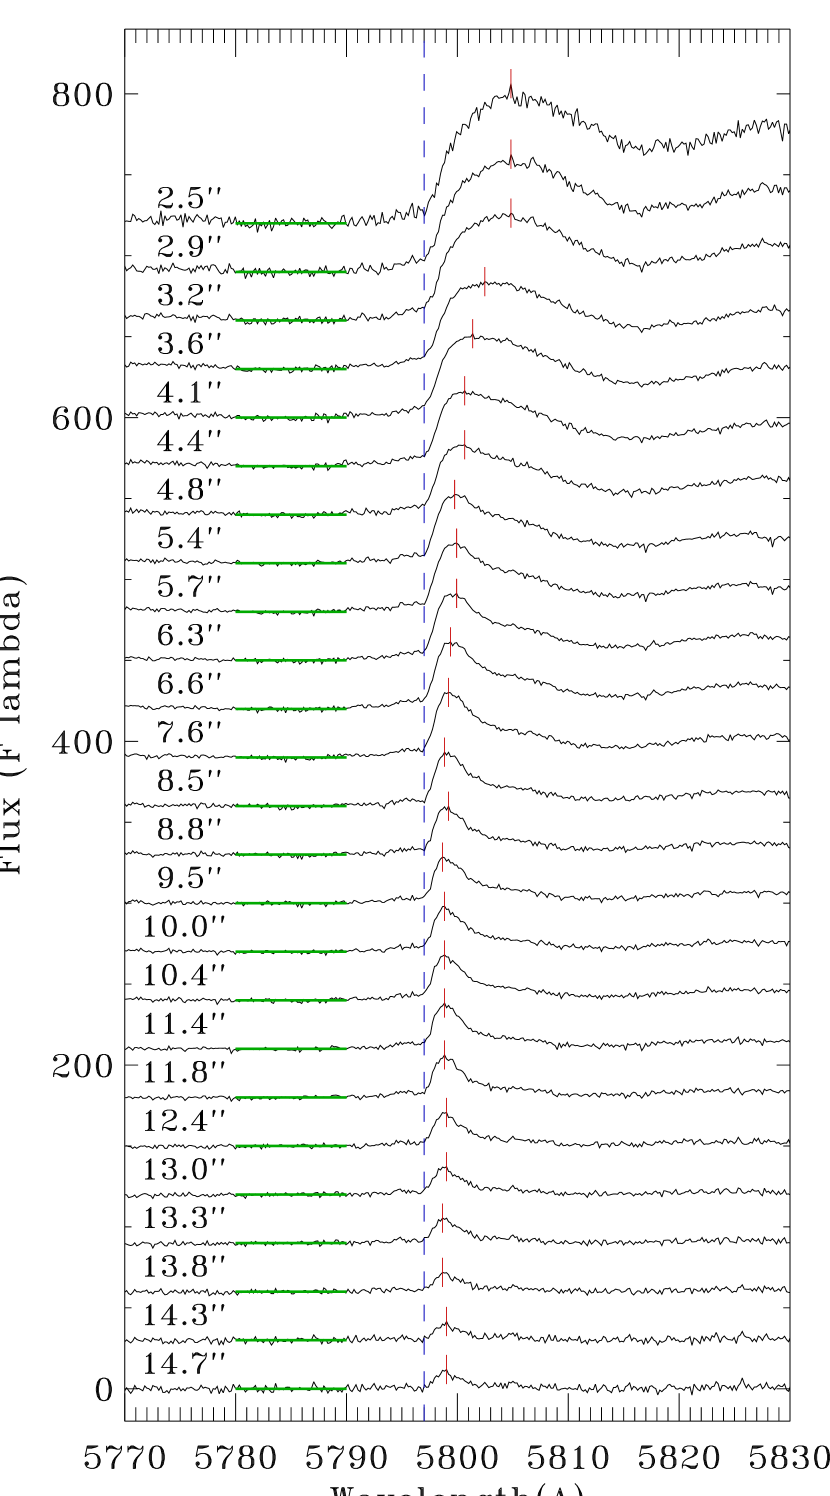
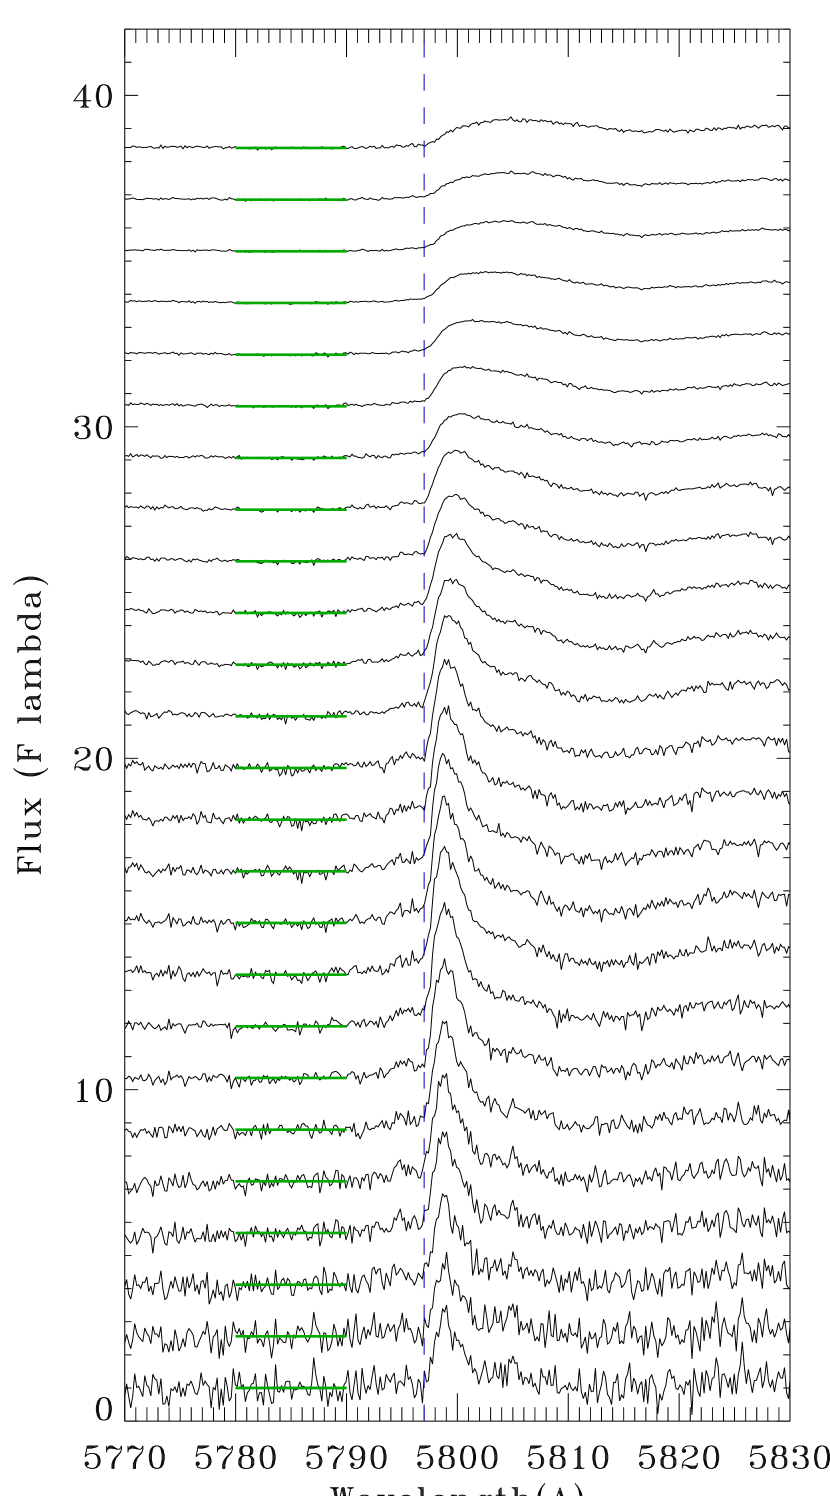
Based on our study of the radial evolution of the emission structure along the arms of the bi-cone (Figures 1 & 2) we propose that the 5800Å feature arises from sequence structure, either associated with the nearby 5797Å DIB carrier, or an alternate molecule. The absence of any perfect correlations between DIBs leads one to conclude that if the DIB carriers are molecular (Thorburn et al., 2003) then the Franck-Condon factors for electronic excitation are dominated by the origin band. For a molecule in its vibrational and electronic ground state, electronic excitation will similarly leave the molecule with zero vibration in the electronic excited state. The dominance of the origin band in electronic excitation is indicative of a transition between states with very similar potential energy surfaces. If the equilibrium geometry or the vibrational frequencies were to change appreciably upon excitation, vibrational progressions would be observed.
If the carrier of the 5800Å feature behaves similarly to the DIBs, then we would expect any emission from a vibrationally excited population of molecules to exhibit sequence structure. Sequence structure arises from electronic transitions where the molecule remains in vibrational states of the same character. If the potential energy surfaces of two electronic states are parallel, then the sequence emission will occur at the same wavelength as the origin band.
In many large molecules, electronic transitions between states of increasing vibrational excitation result in transitions of progressively lower energy due to the tendency for vibrational frequencies to be slightly lower in the excited electronic state. In large molecules where electronic transitions from the ground state are dominated by the origin transition, population of higher vibrational excitation states results in a red-ward broadening of the emission structure.
This sequence structure interpretation requires the molecule responsible for the emission to have an extended chromophore, in order that the electronic transitions do not change the structure of the molecule appreciably (i.e. the PESs are almost parallel).
In deference to the current popularity in astronomy of PAHs we, in the first instance, follow the trend and propose an intermediate size PAH molecule as the emitter. Alternative molecular forms (C60 - Kroto et al. (1985), carbon chains - Douglas (1977)), are not considered at this time.
Using the Ultra-High Resolution Facility (UHRF, R600,000) of the Anglo-Australian telescope (AAT), Sarre et al. (1995a) show that the 5797Å DIB carrier fulfils the requirements to generate sequence structure. The slightly red-degraded shape of the UHRF spectrum shows that the molecule is slightly larger in the excited state, indicating a weakening of bonds and thus a probable slight decrease in the vibrational frequencies of the molecule. It is thus suggested that if a vibrationally excited population of the carrier of the 5797Å DIB were to fluoresce (or phosphoresce) it would exhibit sequence structure as manifested by red-ward broadening of the DIB band shape. However, as the 5800Å feature does not asymptotically approach the 5797Å DIB position, the simplest assumption to be made is that they arise from a different carrier. For the bands to arise from the same carrier we require that the coldest emission be completely self-absorbed by the nebula.
4.2. PAH Model
In order to explore the sequence band hypothesis, we performed normal mode analyses on PAH cations of various sizes in ground and electronically excited states. Cations, rather than neutrals, were chosen for these quantum calculations so that they exhibited strong transitions in the visible region (Brechignac & Pino, 1999). Ground state geometries and normal mode frequencies of the naphthalene, pyrene, tetracene, perylene and coronene cations were obtained with the B3LYP density functional and 6-31G basis set using the gaussian 03 (Frisch et al., 2003) suite of programs. Time-dependent Density Functional Theory (DFT) calculations were performed on the optimised ground state structures to yield excited states. The electronic transition in the visible region with the largest oscillator strength was chosen. In order to replicate this excited state, the ground state orbital occupancy was altered to resemble the leading configuration of the selected excited state. Geometry optimisations and normal mode analyses were performed on these excited states for naphthalene, pyrene, tetracene and perylene.
The vibrational frequencies in the ground and excited states were used to generate transition energies with the origin transition (arbitrarily) centred at 5800Å, in order that we be able to compare the band shape with the new RRB observations. At the time of writing, only indicative origin positions may be calculated by quantum theory for molecules of the size being invoked here. By way of benchmarking, pentacene is seen to absorb at 5362Å (Heinecke, 1998) but is calculated by TD-DFT to absorb at 6190Å (Reilly & Schmidt, private communication). Sequence band profiles were calculated in the manner laid out in appendix A.
For an example of an observed molecular sequence structure see Figure 2 of Linnartz et al. (2004).
4.3. DFT Modeled emission spectra
It must be emphasised that the modelling of emission spectra is, in essence, an exploration of the parameter space available to the molecules responsible for the 5800Å emission. As such, by invoking naphthalene, pyrene, tetracene and perylene cations we are exploring the expected vibrational sequence structure of a molecule of that size and shape, with an extended chromophore, rather than the species itself.
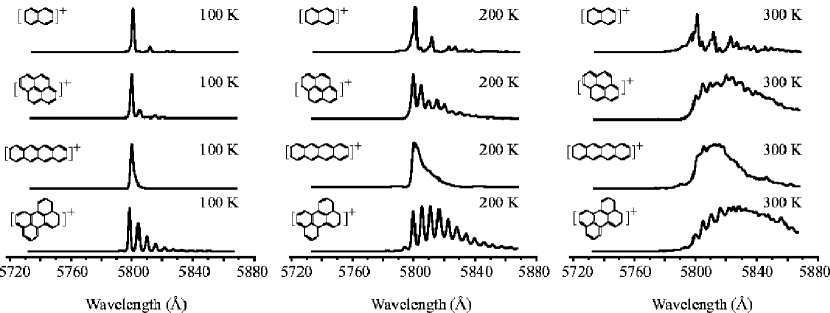
Notwithstanding the fact that naphthalene cation is likely photodestroyed in harsh circumstellar environments, it serves as a starting point for the exploration of our parameter space. As can be seen in figure 3, the modeled naphthalene spectra are far too structured and cover too large a wavelength region to be responsible for the RRBs. What’s more, the density of states does not increase fast enough with energy to bring about a shift in the maximum of the emission spectrum.
On moving to pyrene, we see that the spectra become less resolved due to an increased number of emissive states. At first glance it would appear that pyrene behaves in a very similar manner to the new RR spectra. However, the shift in the emission peak for pyrene is too large to be considered a serious candidate for the RR emission carrier (cf. Figures 2 & 3).
Tetracene is calculated to have small vibrational frequency shifts as compared to naphthalene and pyrene. As such it yields narrow sequence structure features which are broadly in keeping with the behaviour observed in the RR.
Perylene behaves in a similar way to pyrene yet its sequence structure is calculated to be somewhat dominated by a small frequency mode with a relatively large shift upon excitation. The greater number of Boltzmann accessible vibrational states accessed in the electronic excited state brings about a shift in the maximum of the emission spectrum to longer wavelengths. However, even for perylene the magnitude of the red-shift of the calculated sequence structure is far greater than that observed in the RRBs. In order that the RRBs be explained by sequence structure, we require a larger molecule with a much larger density of states.
The size of the molecule required is such that the modeling of its sequence structure explicitly using DFT becomes intractable. While it may be possible to obtain ground state electronic structures and vibrational frequencies of very large molecules, the excited state electronic structures become increasingly complicated, being brought about by mixing several excitations out of the ground state. As such, representation of an excited state with an altered orbital occupancy is unreliable. Optimizing excited states by using TD-DFT is beyond the scope of contemporary computer codes for the size of molecules being employed here (vide infra).
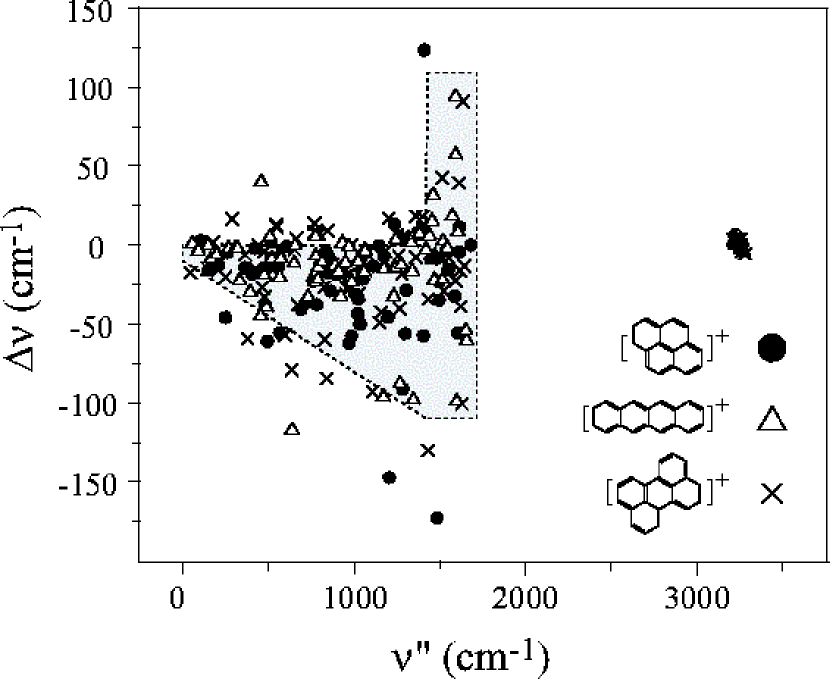
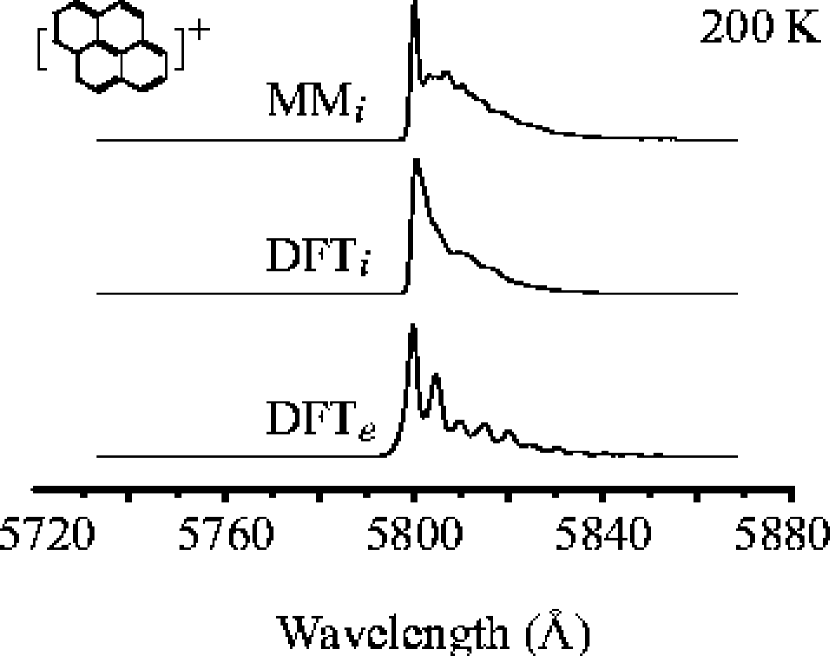
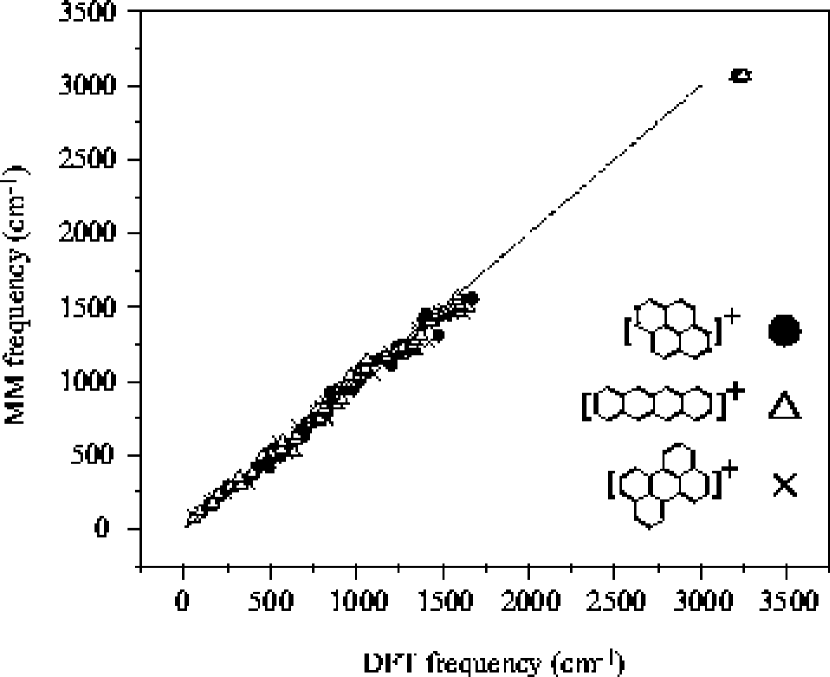
For molecules the size of coronene and larger, excited state frequencies were chosen guided by the behaviour of the smaller systems at the DFT level of theory. Figure 4 demonstrates that most frequency shifts upon excitation fall within an envelope (shaded). Randomly selecting shifts from this envelope changes the nature of the sequence structure very little, as shown in figure 5 for pyrene. Similarly, calculating the ground state frequencies using molecular mechanics (MM) produces rather similar results. The correlation between MM and DFT calculated frequencies is tight, as shown in Figure 6. To investigate systems larger than coronene we have invoked a purely molecular mechanical model, and assumed that these structures behave in the same manner observed by DFT for the smaller PAH cations. Coronene frequencies were calculated with both DFT and MM, with both results presented.
5. Molecular mechanical model
Using parameters taken from the CHARMM force-field (Brooks et al., 1983), vibrational frequencies for electronic ground states of large PAHs were generated by diagonalization of the mass-weighted Hessian matrix. Excited state vibrational frequencies were chosen from the envelope of DFT shifts as outlined above. Sequence structure was then simulated in an identical manner to the implicit DFT results.
5.1. Molecular Mechanical model results
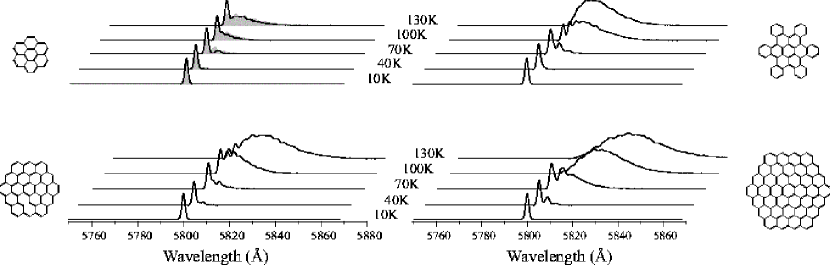
Using a molecular mechanical (MM) model, we explore a range of larger PAH molecules, including pyrene, coronene, hexabenzocoronene, circumcoronene and dicircumcoronene.
Figure 5 compares the modeled emission spectra of pyrene at 200 K from the DFT model and the MM model. The effect of increasing the size of the molecule in the MM model is that the density of states increases very rapidly with energy and thus the sequence structure is shifted to the red. Spectra for the coronene, hexabenzocoronene, circumcoronene and dicircumcoronene at a range of temperatures are shown in Figure 7.
Given the similarity of the sequence structure predicted by the MM model it is thus difficult to pin-down the exact size of the 5800Å carrier.
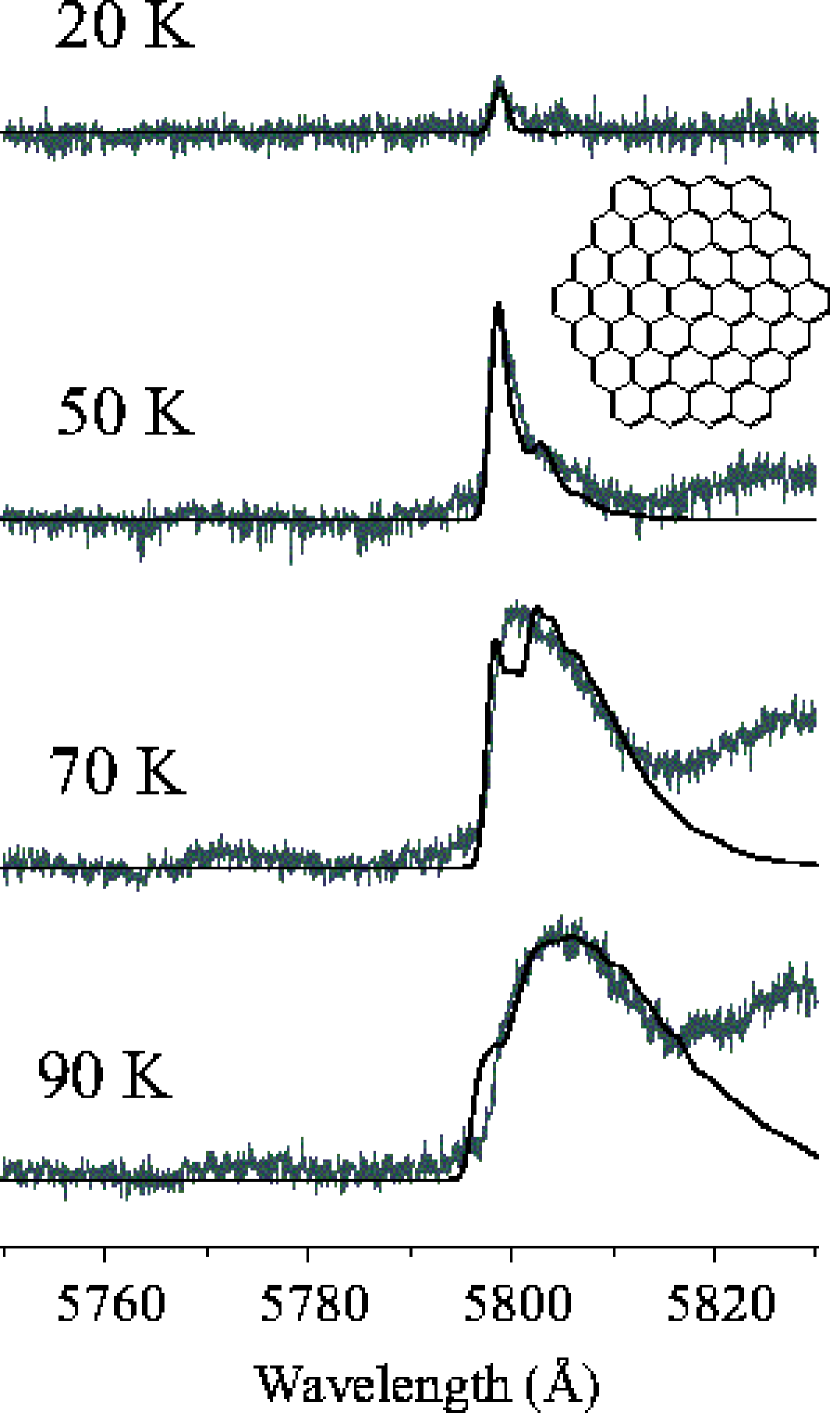
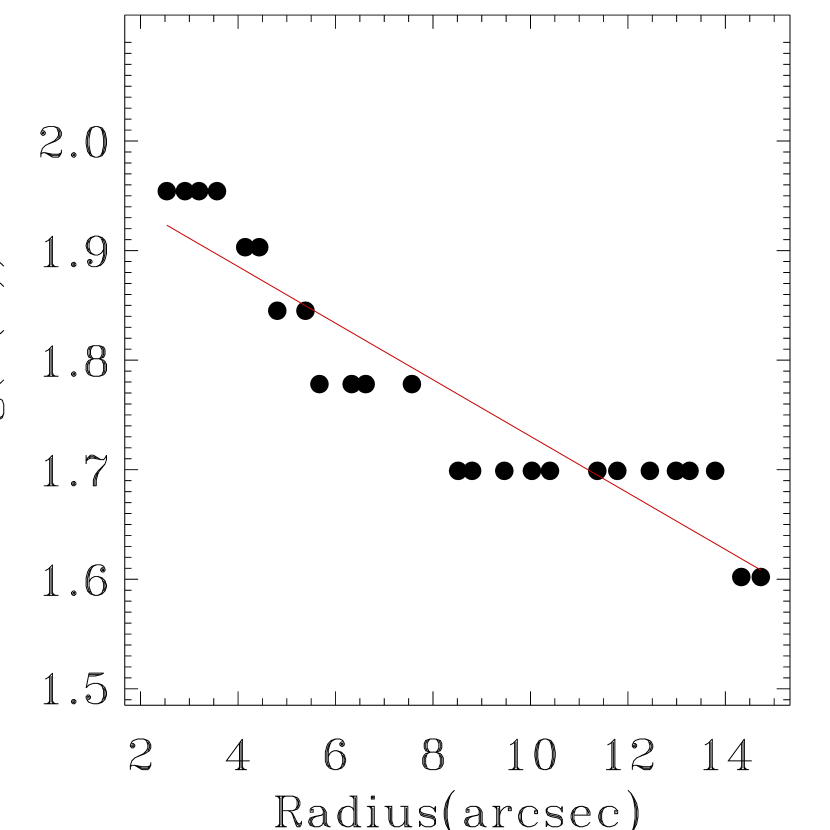
Despite the molecules invoked here displaying similar red-shifted emission spectra, the red-shift of the emission maximum was found to be very temperature sensitive. As such the MM modeled temperature of the Red Rectangle (catalog red rectangle) due to sequence emission is relatively insensitive to carrier(!). We found that the broadest emission spectra observed in the Red Rectangle (catalog red rectangle) could be explained in terms of molecules at vibrational temperatures of 90 K. Modeled MM spectra for our fiducial molecule, dicircumcoronene, are superimposed on 5800Å RRB in Figure 8. An initial estimate of the radial vibrational temperature of the 5800Å band carrier is given in Figure 9.
5.2. Deficiencies of the MM model
While the redward shifts in the maxima of emission are reproduced with little trouble, our model may necessarily over-estimate the size of the PAH required for the observed (putative) sequence structure. This is because we select the range of frequency shifts from DFT calculations necessarily performed on small molecules. One may expect that larger molecules will exhibit smaller shifts upon excitation as a consequence of the electronic transition being more delocalized. The effect of this will be to pull the sequence band contour into the origin band position, reducing the amount of red shifting. As such, the observed structure in the RR may be due to a smaller molecule than dicircumcoronene, at a higher temperature.
Additionally, our model only contains a single temperature population at this time. The effect of a compound population along the line of sight, with a restricted range temperature, would be to smear out the emission peaks somewhat.
5.3. Should sequence structure be observed?
Sarre et al. (1995b) note that one might expect sequence structure to be a feature of molecular emission bands. If one accepts that large PAH molecules exist in appreciable quantities in the Red Rectangle, and that they will be undergoing collisions and photoexcitation, then one concludes that they will exhibit a significant vibrational temperature. While many vibrational modes can radiate energy (indeed, the 3.3m and 7.6m UIB emission is proposed to originate from PAH C-H and C-C stretches) there will be many modes which cannot couple to electromagnetic radiation. As such, vibrational energy can be “stored” in the PAH for an appreciable time. This phenomenon and the high photon flux in the nebula will bring about a vibrational temperature. This temperature may exceed 100 K, and electronically excited molecules will radiate to vibrational wavefunctions with nearly identical character to that in the excited state. We conclude that a large PAH molecule in an environment such as the RR will inevitably exhibit sequence structure in its emission.
5.4. De-hydrogenation
Kokkin & Schmidt (in prep.) demonstrate that the effect of de-hydrogenation on the in-plane electronic transitions in large PAH molecules is primarily to shift the band a small amount (of the order of a few 10Å) although bond-length alteration induced by dehydrogenation may be important in systems as large as decacyl. Since in-plane transitions are the strongest and only involve molecular orbitals of -symmetry (), dehydrogenation has little effect on the position of the excitation. Out-of-plane transitions of PAH radicals are expected to be significantly shifted from the strong in-plane transitions of the neutral close-shell parent, and such spectra will also exhibit a degree of vibrational structure due to the localization of the lone-pair chromophore.
If the 5800Å band should indeed be attributed to emission from a 45-100 carbon atom PAH (such as dicircumcoronene) then one may postulate a second band, at longer wavelengths, derived from the de-hydrogenated molecule. Such bands would almost certainly be observed in vibrationally hotter states since one expects these bands to be more prominent closer to the central star, an energy source capable of removing the hydrogen atom from the PAH. They would not be observed as sharp bands such as the RD emission feature. Such bands would better resemble the Van Winckel et al. (2002) Symmetric (S) bands. The Red Rectangle (catalog red rectangle) spectrum is replete with such features. Thus we tentatively propose the second feature, at 5826.5 (Van Winckel et al., 2002), the extreme red limit of our argus spectra, as sequence emission from a dehydrogenated PAH responsible for the 5800Å band.
5.5. Other Red Degraded (RD) bands.
If one accepts a sequence structure explanation for the 5800Å RRB, it is tempting to propose similar explanations for the remaining RD bands in the Red Rectangle (catalog red rectangle). A number of RD bands, each of which can plausibly be assigned an associated S band derived from the dehydrogenated molecule, are listed by Van Winckel et al. (2002). Such bands would not arise in a common carrier but would instead arise in similar 45-100 carbon atom PAH molecules. Where a PAH has more than one symmetry unique dehydrogenation site, a single RD band could have associated with it more than one S band.
5.6. Symmetry and candidate selection
When suggesting candidate carriers for the RRBs, one is naturally tempted to choose highly symmetric molecules in order to avoid the plurality associated with arbitrary choices. However, there are other good reasons to suggest a highly symmetric carrier. The Born-Oppenheimer breakdown which prevents many large molecules from fluorescing is facilitated by a large background of vibronic states of the same symmetry. By invoking a more symmetric candidate, the number of background states of the same symmetry naturally falls, as there are more irreducible representations of the molecular point group. As such, it is more likely that a highly symmetric molecule will fluoresce than a less symmetric one.
6. Conclusions
We have demonstrated that the radial variation of the profile of the 5800Å Red Rectangle (catalog red rectangle) band is well modeled as molecular sequence structure arising in a PAH molecule with 45-100 carbon atoms. Our model has the attractive properties of :
-
•
Not requiring an exotic molecule, once one accepts the presence of PAHs in the ISM.
-
•
Not requiring high nebular temperatures.
-
•
Not requiring an exotic emission mechanism. While sequence structure does not appear prominently in the astronomical literature, it is a simple molecular emission phenomenon.
If sequence structure is the origin of the 5800Å RRB then it is natural to extend the hypothesis to the other Red Degraded RRBs, invoking sequence structure for additional molecules.
Appendix A DFT calculations of band profiles
Assuming no change in vibrational state, the photon energy for sequence transition , , is simply
| (A1) |
where is the energy of the origin transition, is the number of atoms in the PAH cation and is the number of quanta of vibrational energy in mode . Simulated emission spectra were produced by convolving the predicted transitions energies with a Gaussian profile simulating the rotational structure of each sequence band.
The vibrational population in the excited electronic state was assumed to have an exponential dependence on vibrational energy of the ground vibrational state
| (A2) |
where
| (A3) |
The simulated emission spectrum is thus a sum over sets of quanta (vibrational states)
| (A4) |
where controls the FWHM of the gaussian (rotational) profile.
In cases where the number of states needed to converge the shape of the calculated sequence emission profile was prohibitively large, a Monte Carlo sampling technique was employed. Here, states, , were chosen as a Monte Carlo Markov Chain and added to the simulation one at a time (starting at the ground vibrational level). The probability of accepting a step, in the space of the number of quanta in each vibrational mode, was given by the Metropolis technique, whereby all steps down in vibrational energy were chosen with unit probability and those up in energy were accepted with probability . Since the probability of state being occupied is naturally taken into the selection algorithm, the emission spectrum was taken as a simple sum over the sampled states.
| (A5) |
Typically, 10000 states were enough to converge the shape of the emission band profile.
References
- Ádámkovics et al. (2003) Ádámkovics, M., Blake, G.A., McCall, B.J. 2003, ApJ, 595, 235
- Allamandola et al. (1985) Allamandola, L.J., Tielens, A.G.G.M., Barker, J.R. 1985, ApJ, 290 ,L25
- Allamandola et al. (1999) Allamandola, L.J., Hudgins, D.M., & Sandford, S.A. 1999, ApJ, 511, L115
- Brechignac & Pino (1999) Brechignac, P., Pino, T. 1999, A&A, 343, L49
- Brooks et al. (1983) Brooks, B.R., Bruccoleri, R.E., Olafson, B.D., et al. 1983, J. Comp. Chem., 4, 187
- Cohen et al. (1975) Cohen, M., Anderson, C.M., Cowley, M., et al. 1975, ApJ, 196, 179
- Cohen et al. (2004) Cohen, M., Winckel, H.V., Bond, W.E., & Gull, T.R., 2004, AJ, 127, 2362
- Ding et al. (2003) Ding, H., Schmidt, T.W., Pino, T., Boguslavskiy, A.E., Gathe, F., & Maier, J.P., 2003, J. Chem. Phys., 119, 814
- Donn, Hodge & Mentall (1968) Donn, B., Hodge, R.C. & Mentall ,J.E. 1968, ApJ, 154, 135
- Douglas (1977) Douglas, A.E., 1977, Nature, 269, 130
- Fulara & Krelowski (2000) Fulara, J., & Krelowski, J., 2000, NewAR, 44, 581
- Frisch et al. (2003) Frisch, M.J., Trucks, G.W., Schlegel, H.B., Scuseria, G.E., Robb, M.A., Cheeseman, J.R., Montgomery, J.A. Jr., Vreven, T., et al. 2003 gaussian 03, Revision B.05 Gaussian, Inc., Pittsburgh PA
- Geballe, Tielens, Allamandola et al. (1989) Geballe, T.R., Tielens, A.G.G.M., Allamandola, L.J., Moorhouse, A. & Brand, P.W.J.L., 1989, ApJ, 341, 278
- Glinski & Anderson (2002) Glinski, R.J., & Anderson, C.M. 2002, MNRAS, 332, 17
- Glinski & Nuth (1997) Glinski, R.J., & Nuth, J.A. iii 1997, Ap&SS, 249, 143
- Gillingham et al. (2003) Gillingham, P.R., Popovic, D., Farrell, T.J., Waller, L.G. 2003, SPIE, 4841, 1170
- Heinecke (1998) Heinecke, E., Hartmann, D., Muller, R., & Hese, A. 1998, J. Chem. Phys., 109, 906
- Herbig (1995) Herbig, G.H. 1995, ARA&A, 33, 1
- Kerr et al. (1998) Kerr, T.H., Hibbins, R.E., Fossey, S.J., Miles, J.R., Sarre, P.J. 1998, ApJ, 495, 941
- Kroto et al. (1985) Kroto, H.W., Heath, J.R., O’Brien, S.Co, Curl, R.F., & Smalley, R.E. 1985, Nature, 318, 14
- Léger & Dhendecourt (1985) Léger, A. & Dhendecourt, L. 1985, A&A, 146, 81L
- Linnartz et al. (2004) Linnartz, H., Araki, M., Ding, H., Boguslavskiy, A.E., Kolek, P., Schmidt, T.W., Motylewski, T., Cias, P. et al. 2004, ApJ, 616, 1301
- Maier et al. (2001) Maier, J.P., Lakin, N.M., Walker, G.A.H., Bohlender, D.A. 2001, ApJ, 553, 267
- Men’shchikov et al. (2002) Men’shchikov, A.B, Schertl, D. Tuthill, P.G., Weigelt, G., & Yungelson, L.R. 2002, A&A, 393, 867
- Merrill (1934) Merrill, P.W. 1934, Publ. Astron.Soc Pac., 46, 206
- Merrill (1936) Merrill, P.W. 1936, Publ. Astron.Soc Pac., 48, 179
- Merrill & Wilson (1938) Merrill, P.W., & Wilson O.C. 1938, ApJ, 87, 9
- Miyata et al. (2004) Miyata, T., Kataza, H., Okamoto, Y.K. et al. 2004, A&A, 415, 179
- Peeters et al. (2004) Peeters, E., Spoon, H.W.W., & Tielens, A.G.G.M. 2004, ApJ, 613, 986
- Press et al. (1993) Press, W.H., et al. 1993, Numerical Recipes in C : The Art of Scientific Computing (2nd ed.; Cambridge University Press)
- Rouan et al. (1997) Rouan, D., Léger, A., & Le Coupanec, P. 1997, A&A ,324, 661
- Sarre et al. (1995a) Sarre, P.J., Miles, J.R., Kerr, T.H., Hibbins, R.E., Fossey, S.J., & Somerville, W.B. 1995, MNRAS, 277, L41
- Sarre et al. (1995b) Sarre, P.J., Miles, J.R., Scarrott, S.M. 1995, Sci, 269, 674
- Scarrott et al. (1992) Scarrott, S.M., Watkin, S., Miles, J.R. & Sarre, P.J. 1992, MNRAS, 255, 11
- Schmidt et al. (2003) Schmidt, T.W., Boguslavskiy, A.E., Ding, H., et al. 2003, International Journal of Mass Spectrometry, 228, 647
- Schmidt et al. (1980) Schmidt, G.D., Cohen, M., & Margon, B. 1980, ApJ, 239, L133
- Schmidt & Sharp (2005) Schmidt, T.W., & Sharp, R.G. 2005, Aust. J. Chem., 58N2, 69 (arXiv:astro-ph/0501180)
- Thaddeus & McCarthy (2001) Thaddeus, P., & McCarthy, M.C. 2001, Spectrochimica, 57, 757
- Thorburn et al. (2003) Thorburn, J.A., Hobbs, L.M., McCall, B.J., Oka, T., Welty, D.E., Friedman, S.D., Snow, T.P., Sonnentrucker, P., & York, D.G. 2003, ApJ, 584, 339
- Van Winckel et al. (2002) Van Winckel, H., Cohen, M., & Gull, T.R. 2002, A&A, 390, 147
- van der Zwet & Allamandola (1985) van der Zwet, G.P., & Allamandola, L.J., 1985, A&A, 146, 76
| Pointing | RA/Dec (J2000) | Pos. Ang. | Exp. time | Date |
|---|---|---|---|---|
| P0 | 06:19:58.14 -10:38:14.0 | 12 | 32600sec | 2005-12-29 |
| P1 | 06:19:58.32 -10:38:23.3 | 165 | 321800sec | 2005-12-29 |
| P2 | 06:19:57.68 -10:38:20.7 | 230 | 231200sec | 2005-12-29 |
| ’ ’ | ’ ’ | 131200sec | 2005-12-30 | |
| P3 | 06:19:57.95 -10:38:04.5 | 340 | 331200sec | 2005-12-30 |
| P4 | 06:19:58.63 -10:38:06.4 | 43 | 331200sec | 2005-12-30 |