Optical and X-ray Identification of Faint Radio Sources in the GOODS-S ACS Field
Abstract
We present optical and X-ray identifications for the sixty-four radio sources in the GOODS-S ACS field revealed in the ATCA 1.4 GHz survey of the Chandra Deep Field South. Optical identifications are made using the ACS images and catalogs, while the X-ray view is provided by the Chandra X-ray Observatory 1 Ms observations. Redshifts for the identified sources are drawn from publicly available catalogs of spectroscopic observations and multi-band photometric-based estimates. Using this multiwavelength information we provide a first characterization of the faint radio source population in this region. The sample contains a mixture of star-forming galaxies and active galactic nuclei, as identified by their X-ray properties and optical spectroscopy. A large number of morphologically disturbed galaxies is found, possibly related to the star-formation phenomena. In spite of the very deep optical data available in this field, seven of the sixty-four radio sources have no optical identification to mag. Only one of these is identified in the X-rays.
1 INTRODUCTION
The Great Observatories Origins Deep Survey (GOODS) (Giavalisco et al., 2004) provides deep multi-wavelength observations in the Hubble Deep Field-North (HDF-N) and Chandra Deep Field-South (CDFS). The fields have been imaged by the Hubble Space Telescope (HST), using the Advanced Camera for Surveys (ACS) in four bands (F435W, F606W, F775W and F850LP). At infrared wavelengths, observations by the Spitzer Space Telescope use the IRAC (3.6-8 m) and MIPS (24 m) instruments. The deepest X-ray surveys currently available have been made in the GOODS fields, using the Chandra X-ray Observatory and XMM-Newton. The GOODS fields are also targets of many ground-based studies using 4- and 8-meter class telescopes, providing imaging and spectroscopic data in optical and near-infrared bands. The richness and depth of data implies that GOODS will be a foundation for the study of galaxy formation and evolution over the next few years.
Space and ground-based observations and data acquired up to 2004 are described by Giavalisco et al. (2004). The available spectroscopic redshifts for these fields, combined with the multi-waveband imaging dataset, have been used to calibrate and determine photometric redshifts of many sources to faint magnitudes (e.g. Mobasher et al., 2004; Wolf et al., 2004).
Deep radio observations of GOODS represent an excellent opportunity to explore a number of unresolved questions regarding radio emission from galaxies, since GOODS sources have a plethora of multiwavelength data available for their characterization. Additionally, radio data on GOODS sources can, in some situations, resolve uncertainties and/or provide unique insights about the astrophysical processes at play.
It is believed that the decimetric radio emission from galaxies is dominated by the synchrotron emission from electrons accelerated either by shock waves associated with supernovae (and hence star formation, SF), by processes energized by a massive nuclear object (an active galactic nucleus, AGN), or by a combination of the two (Condon, 1992).
Radio emission associated with AGNs is responsible for the great majority of decimetric sources brighter than about mJy. The optical hosts of these sources include massive elliptical galaxies, QSOs and Seyfert galaxies. Radio selection of sources brighter than a few mJy preferentially selects for “radio-loud” AGNs having relatively high radio-to-optical luminosity ratios. AGNs also exist in the sub-mJy population: some are distant radio-loud sources, and others are intrinsically low-luminosity radio sources hosted by objects similar to those hosting radio-loud AGNs. Observations of the radio emission from AGNs provide information about the existence and properties of central black holes, especially when combined with observations of X-ray power (e.g. Merloni et al., 2003), as well as clues to some properties of the interstellar and intergalactic medium.
Among samples of radio sources selected at ever-fainter sub-mJy flux densities, the proportion of AGNs systematically declines in favor of sources energized by star formation (e.g. Windhorst et al., 1985; Georgakakis et al., 1999; Afonso et al., 2005). The optical hosts of these starforming radio sources include blue galaxies with optical colors revealing a young stellar population, and extremely red galaxies with evidence for a very high degree of dust extinction. High resolution optical imaging often reveals disturbed morphologies indicative of interactions and/or merging activity among the sub-mJy radio population (e.g. Richards et al., 1998).
There is a tight correlation between the decimetric radio luminosity and the far-infrared (FIR) luminosity of starforming galaxies. In such sources the FIR emission is believed to be thermal emission from dust heated by stellar UV and optical emission. When the extinction is so high that almost all of the stellar luminosity is absorbed by dust, the FIR luminosity measures the total UV/optical power and hence (if the initial mass function is known) the rate of star formation (e.g. Yun et al., 2001). The correlation between FIR and radio luminosity allows the use of radio power observations to determine star-formation rates for galaxies that are too faint to be detected as FIR sources. Importantly, decimetric radio emission is free of extinction.
Deep decimetric observations of GOODS fields thus offer astrophysically useful data on black hole properties, star-formation processes, properties of the interstellar and intergalactic medium, and the relative densities and evolution of some major galaxy populations. Accordingly, this paper commences the investigation of radio sources in the GOODS CDFS field, in particular the HST-ACS region which has homogeneous optical, radio and X-ray coverage. To assist building a resource for the entire community, optical and X-ray identifications of the sources revealed in the recent ATCA 1.4 GHz radio observations (Koekemoer et al. 2006, in preparation) are reported promptly. Throughout this paper, and unless otherwise noted, we adopt km s-1 Mpc-1, , and .
2 Multiwavelength observations
2.1 Radio observations
The CDFS was observed at radio (1.4 GHz) wavelengths using the Australia Telescope Compact Array (ATCA). A total of 120 hours of observations were obtained, resulting in a 1.2 square degree area field covering the CDFS to a limiting (1 ) sensitivity of Jy and a beam size of . Source detection provided a catalog of 683 sources, with integrated flux densities between 61 Jy and 170 mJy. Koekemoer et al. (2006, in preparation) present the observations, data reduction methods and the approach used to construct the radio source catalog.
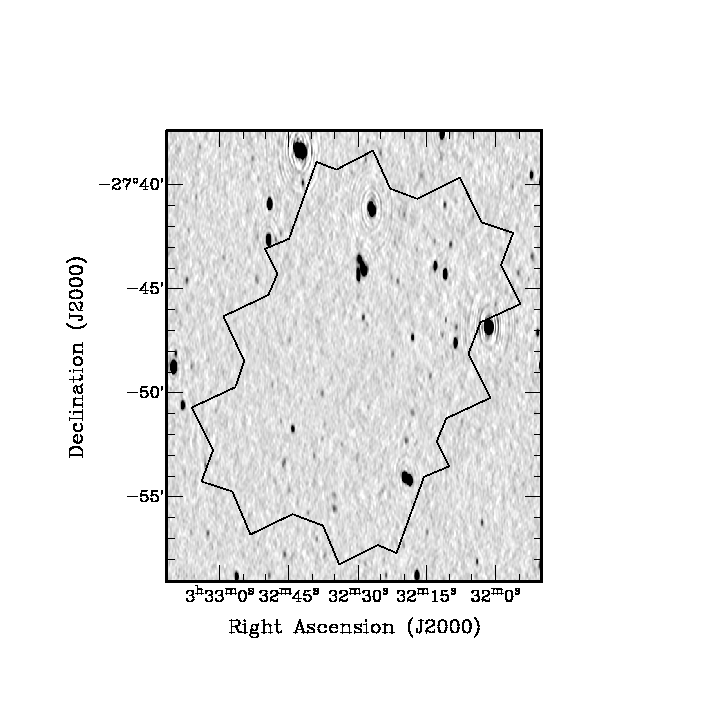
Within the GOODS ACS CDFS region, a total of 64 radio sources are found, with 1.4 GHz flux densities between 63 Jy and 20 mJy. Figure 1 shows the radio view of the this field. This sample and its optical and X-ray properties are presented in the present paper.
2.2 Optical observations
The HST-ACS observations of the CDFS taken as part of the GOODS project (Giavalisco et al., 2004) were used. The data release v1.0 includes (), (), () and () reduced, calibrated, stacked and mosaiced images and corresponding catalogs, providing photometry of sources detected in the -band. Combined images were made, in order to search for faint optical counterparts of radio sources not detected in the single band.
2.3 X-ray observations
The deep Chandra X-ray Observatory observations of the CDFS (Giacconi et al., 2002) were used. The integration time amounts to 1 Ms, being one of the deepest X-ray observations ever taken.
Initially, the X-ray point-source catalogs from Alexander et al. (2003) were searched for counterparts of radio sources. The sensitivity limits in the arcmin2 region at the aim point are erg cm-2 s-1 and erg cm-2 s-1 in the 0.5–2.0 keV and 2.0–8.0 keV bands, respectively (Alexander et al., 2003).
The catalogs presented in Giacconi et al. (2002) were also inspected for X-ray detections not reported in Alexander et al. (2003): the different data reduction and source detection methods result in a few faint sources being detected in only one of these works, which is nevertheless still relevant for the current study. However, this imposes some non-uniformity for the reported X-ray characteristics. While the catalogs produced by Alexander et al. (2003) provide counts and fluxes in various bands covering the 0.5–8.0 keV interval, and effective photon index111As described in (Alexander et al., 2003), the effective photon index is calculated for a power-law model with the Galactic column density, taking into account the ACIS quantum efficiency degradation. (), those by Giacconi et al. (2002) provide only counts and fluxes in the 0.5–2.0 keV and in the 2.0–10.0 keV bands.
In order to provide comparable quantities for sources detected in these different catalogs, we estimate the X-ray flux in the 2–8 keV band for three sources detected only in the Giacconi et al. (2002) catalogs, using the reported 2.0–10.0 keV flux and assuming a power-law photon index of 1.4, the average value for the remaining X-ray detected sources, as mentioned below. Still, the different reduction techniques and assumptions (considering or not the ACIS degradation, for example) between these X-ray catalogs should be noted.
3 Source Identification
Optical counterparts of radio sources in the GOODS ACS field were identified using the likelihood ratio method of Sutherland & Saunders (1992). For each radio source, the optical identification with the highest reliability (), if above 20%, was taken as the real optical counterpart - if several optical identifications have similar values for , the various possibilities are considered. Identifications were inspected visually to check for special situations where the likelihood ratio method would not apply, as in the case of non-independent sources (either in the radio or in the optical).
The identification of the X-ray counterparts was performed by searching the 3 radio position error region. Visual inspection was used to associate the optical and X-ray identifications.
A few sources require special mention. Source #13 (ATCDFS_J033213.28) coincides with two optical sources in the ACS image, although the GOODS catalog shows a single identification. SExtractor was used to deblend the two objects and obtain positions and optical magnitudes for both. Source #19 (ATCDFS_J033218.62) and source #21 (ATCDFS_J033219.62) are 12″ apart and display similar radio fluxes (4.8 mJy and 5.9 mJy, respectively). They are regarded as being the two radio lobes of the same radio galaxy, optically identified with a cD-type galaxy located roughly halfway between the two. Source #55 (ATCDFS_J033244.16) is identified with an extended interacting pair of galaxies, their optical positions lying just outside and beside the radio position error ellipse. This system is considered as the optical counterpart of the radio emission.
Table 1 presents the final source identifications. The columns display:
(1) Source number;
(2) Radio source name;
(3) 1.4 GHz flux density and associated error;
(4) ACS identification;
(5) reliability () of the ACS identification;
(6) distance in arcsec between the radio and the ACS positions;
(7) ACS (AB) magnitude;
(8) Chandra X-ray Observatory identification;
(9) distance in arcsec between the radio and the CXO positions;
(10) X-ray flux in the 0.5 - 2 keV band;
(11) X-ray flux in the 2 - 8 keV band;
Radio sources with no optical counterpart show the 3 upper limit, estimated from the pixel rms (0.0008-0.0015 counts s-1 pixel-1), integrated over a aperture ( ACS pixel box). The reliability calculation for optical identifications assumes each optical detection individually. Whenever a merger or interacting pair of galaxies is identified as the optical counterpart, and one of the sources clearly dominates , we present in Table 1 only the highest value of , noting that this will be a lower limit for the true reliability of the optical system. Sources with an X-ray identification from Giacconi et al. (2002) are identified by their reported source number in that work.
Of the 64 radio sources in the GOODS ACS CDFS region, two are considered to be radio lobes of the same radio galaxy. For most of the sample, a reliable unique optical counterpart is found, but eight of the radio sources have several possible optical counterparts: five of these (sources #13, #47, #48, #51 and #55) arise from likely interacting pairs, for which we present in Table 1 data for both members, while the remaining three (sources #41, #52 and #60) are ambiguous identifications, each with two seemingly independent likely optical counterparts. The X-ray detection for sources #41 and #52 suggests which optical counterpart is the real one. Seven (11%) radio sources have no optical counterpart. One of these, source #42 (ATCDFS_J033233.44), is associated with faint X-ray emission reported in the Giacconi et al. (2002) catalog.
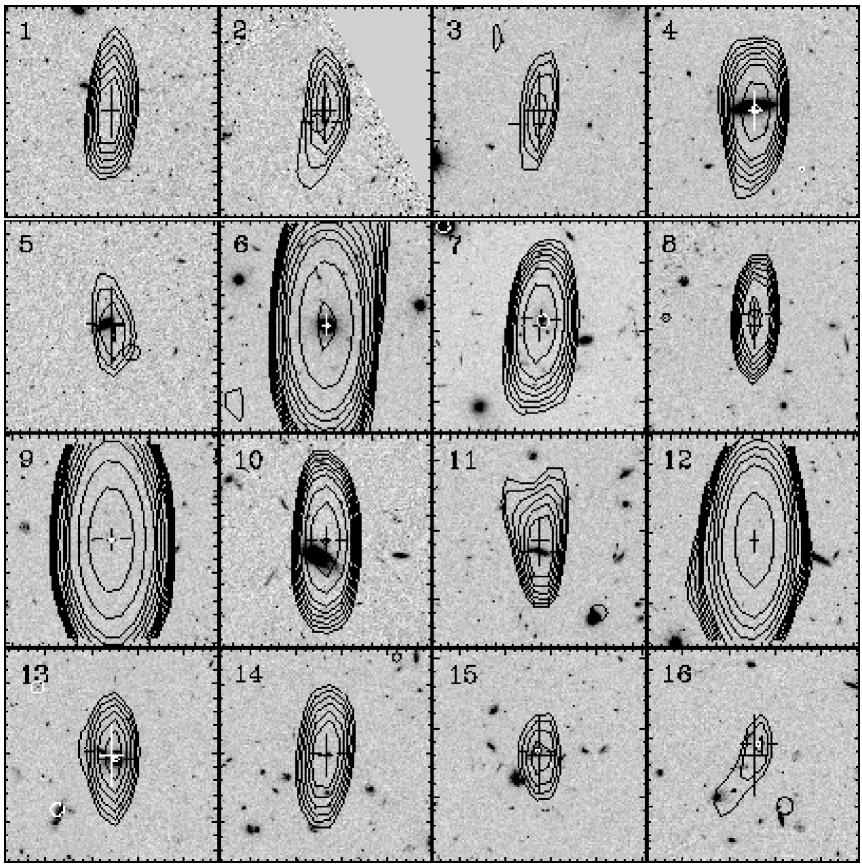
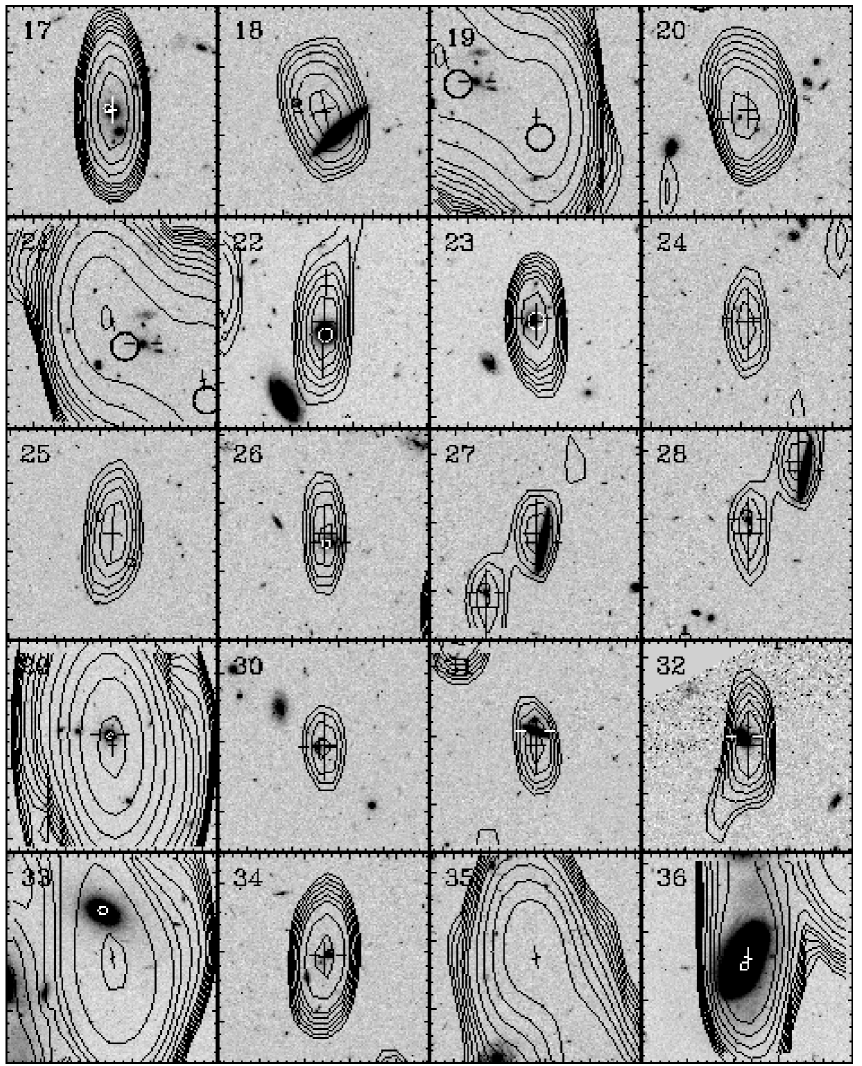
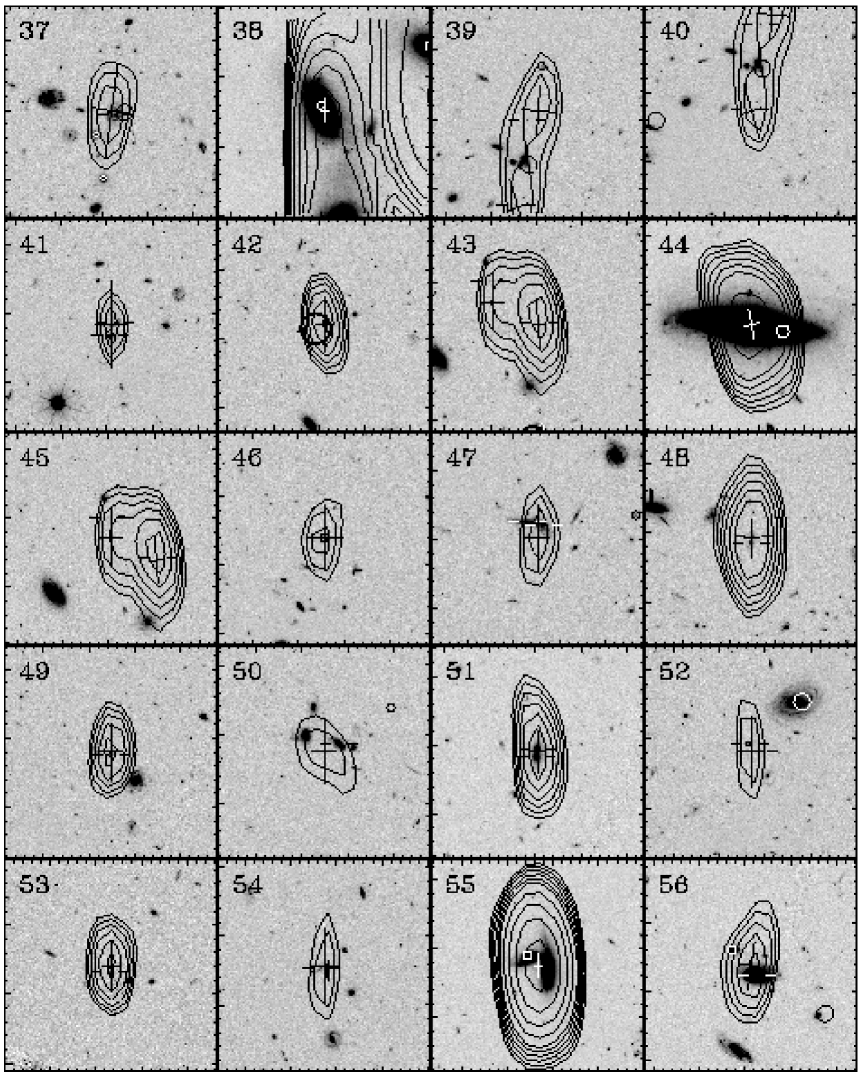
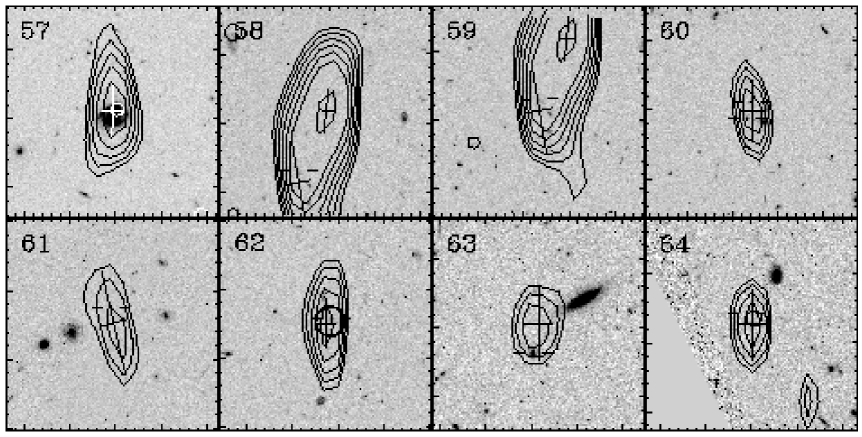
Figure 2 shows gray-scale images in , with radio contours and X-ray detections overlayed.
4 Source characterization
Using the deep multiwavelength data available, we provide a first characterization of the radio source population in the GOODS-S ACS field. Several indicators were employed, as described below.
4.1 X-ray-to-optical flux ratios
The X-ray-to-optical flux ratio can provide a first indication of the nature of a galaxy (e.g., Maccacaro et al., 1988; Stocke et al., 1991; Hornschemeier et al., 2003). Here, we estimate the X-ray-to-optical flux ratio from the relation
| (1) |
where the X-ray flux is measured in erg cm-2 s-1 in the 0.5-2 keV band. This expression results from the X-ray-to-optical flux ratio definition of Stocke et al. (1991), that involved 0.3-3.5 keV flux and -band optical magnitude. These quantities were converted to 0.5-2 keV flux and magnitude assuming a power-law X-ray spectral energy distribution with and a color of 1.2 mag, which are the averages for galaxies in the current sample with detections in these bands. Assuming this expression, AGNs will typically display X-ray-to-optical flux ratios above , while star-forming galaxies tend to display lower values (e.g. Stocke et al., 1991; Schmidt et al., 1998; Shapley et al., 2001; Hornschemeier et al., 2001; Alexander et al., 2002).
4.2 Radio-to-optical flux ratios
We also define a radio-to-optical flux ratio as
| (2) |
where we use the measured radio flux density at 1.4 GHz in mJy. Although this is not an AGN/star-formation discriminator, since high radio-to-optical fluxes can be seen in both radio-powerful AGN or dust-rich galaxies, it is still useful to identify extreme sources in the sample.
4.3 Spectroscopic Redshifts
The CDFS is being intensively studied by several groups. In particular, spectroscopic observations of the optical counterparts of many X-ray sources have been made. The counterparts of the faint radio sources in the GOODS ACS CDFS field presented here were thus searched for the availability of spectroscopic redshifts from Szokoly et al. (2004), Le Fèvre et al. (2004), Vanzella et al. (2004) and Mignoli et al. (2005). The first reports spectroscopic observations of possible optical counterparts of X-ray sources in the CDFS, down to mag, using the VLT with the FORS1/FORS2 spectrographs. Le Fèvre et al. (2004) describe the results of the VIMOS VLT Deep Survey around the CDFS, which includes 784 redshifts in the ACS area, down to mag. Vanzella et al. (2004) present the VLT-FORS2 spectroscopic observations of sources in the GOODS-S ACS region. Source selection in that investigation was optimized to detect high redshift objects, in order to take advantage of the characteristics of FORS2 (high throughput and spectral resolution, and reduced fringing at red wavelengths), mostly down to mag. Finally, Mignoli et al. (2005) deals with the VLT-FORS1/FORS2 spectroscopic observations of -selected galaxies from the K20 survey, which includes a 32.2 arcmin2 field within the CDFS.
4.4 Photometric Redshifts
Several investigations for photometric redshifts in the CDFS region have been made in the past. Particularly relevant is the study by the COMBO-17 project, which has observed this region with the Wide Field Imager (WFI) at the ESO 2.2-m telescope with a 17-band filter set covering the nm wavelength range. As explained by Wolf et al. (2004), this “very-low resolution spectra” allows accurate photometric redshifts to be obtained down to mag. Seeing-adaptive, weighted aperture photometry is used, to measure the same fraction of an object in every band independently of seeing effects - for most objects this is similar to a flux measurement in an aperture of 1.5″ diameter in 1.5″ seeing (Wolf et al., 2004). The spectral energy distribution templates used include star, galaxy (with and without extinction) and QSO types. Mean redshift and variance (1 ) as well as the classification from the best fit procedure were extracted from the catalog (Wolf et al., 2004) and presented here.
For optically fainter sources, eventually at higher redshifts, the near-infrared bands not covered by the COMBO-17 dataset assume a more important role. To get a photometric redshift estimate for these objects, we have also searched the catalog of Mobasher et al. (2004), which uses ground-based optical (-bands) and near-infrared () data from ESO facilities (WFI at the 2.2-m telescope, FORS1 and ISAAC at the VLT, SOFI at the NTT) as well as space observations from /ACS (), resulting in as many as 18 independent photometric measurements for each source. While useful for fainter sources, the spectral libraries used do not include QSO templates, which results in lack of accuracy for some sources, as can be seen in this paper. Also, the photometry measurements in Mobasher et al. (2004) were made through matched 3″ diameter apertures in all bands. In the case of some optical sources with very-close neighbors, often only identified in the ACS images, this can bias the photometric redshift estimate: we note such cases when commenting on the individual sources.
4.5 X-ray and Radio Luminosities
Luminosities were estimated whenever a redshift determination exists. In order of reliability, we have considered the spectroscopic redshift or, in its absence, the photometric redshift from the COMBO-17 work. For faint sources with no other redshift information, the estimate from Mobasher et al. (2004) was used.
The rest-frame X-ray luminosity was calculated as
| (3) |
where is the luminosity distance (cm), is the X-ray flux in the 0.5-8 keV band (), and is the photon index, taken from Alexander et al. (2003). For sources detected only in the Giacconi et al. (2002) catalogs, the 0.5-8 keV X-ray flux is taken as the sum of the 0.5-2 keV and the 2-8 keV fluxes, where the latter is derived from the quoted 2-10 keV flux assuming , as explained above.
The rest-frame radio luminosity density was calculated as
| (4) |
where is the luminosity distance (cm), S is the 1.4 GHz flux density (mJy), and is the radio spectral index (). In determining the radio luminosity density we have assumed = 0.8, the characteristic radio spectral index of synchrotron radiation.
Of the 65 optical sources considered in Table 1, 34 have a spectroscopic redshift, while a further 24 have a photometric redshift estimate.
4.6 Classification
We adopt a classification based primarily on the observed X-ray properties and hardness ratio (). is derived from the 0.5–8 keV fluxes and spectroscopic or photometric redshifts, while is calculated as , with and being, respectively, the count rates in the hard (2–8 keV) and soft (0.5–2 keV) bands taken from Alexander et al. (2003). For sources detected in X-rays only in the Giacconi et al. (2002) catalogs, we assume the quoted hardness ratio derived from the 0.5–2 keV and 2–10 keV band counts, neglecting the (small) discrepancy arising from the different hard band used. Our classification rests on the criteria adopted by Szokoly et al. (2004), namely:
galaxy: erg s-1 and ;
AGN-2: erg s-1 and ;
AGN-1: erg s-1 and ;
QSO-2: erg s-1 and ;
QSO-1: erg s-1 and .
In view of the different X-ray catalog employed here, the different bands used to calculate (0.5–8 keV instead of 0.5–10 keV) and the different K-corrections employed in the calculation of we note that there are some (expected) differences between the X-ray classification presented in Szokoly et al. (2004) and the one herein for some galaxies that appear in both works.
Among sources with insufficient X-ray information (or no X-ray detection), an AGN identification was assigned whenever erg s-1 (source classified as AGNX) or W Hz-1 (source classified as AGNR), as derived from the spectroscopic redshift or the most likely photometric redshift estimate. The adopted radio luminosity limit is derived from the radio luminosity distribution for star-forming galaxies and AGNs observed in the Phoenix Deep Survey (Afonso et al., 2005).
Also the optical spectroscopic information, where available, was used. Since most sources with a spectrum were observed by Szokoly et al. (2004), we adopt their optical classification: BLAGN, whenever the emission lines are broad (full width half maximum 2000 km s-1), HEX for galaxies displaying narrow emission lines some of which are not found in HII regions (e.g., [NeV]3425, HeII1640), LEX for objects with HII region-type spectrum and ABS for galaxies with an absorption line spectrum. Spectra from Le Fèvre et al. (2004), Vanzella et al. (2004) and Mignoli et al. (2005) were visually inspected and classified accordingly. Finally, diagnostic emission line ratios were used to separate Seyfert 2’s from starforming galaxies, whenever suitable emission lines of significant S/N were present, providing an extra degree of information from the optical spectra.
The final characterization of the radio sample is presented in Table 2, which contains the following information:
(1) source number;
(2) spectroscopic redshift and its origin;
(3) spectroscopic quality flag - given the different sources for spectroscopic information, we have converted quality flags from the other works to a scale more similar to the one in Szokoly et al. (2004), namely: denotes a reliable redshift determination, indicates that some spectroscopic feature exists but cannot be securely identified, and flags sources for which there is only a hint of a spectral feature;
(4) photometric redshift from the COMBO-17 work (Wolf et al., 2004);
(5) classification from the COMBO-17 work (Wolf et al., 2004);
(6) results from the photometric redshift work of Mobasher et al. (2004). The photometric redshift and associated 95% confidence interval, the best-fit spectral galaxy type (E=1, Sbc=2, Scd=3, IM=4, Starburst=5,6) and number of bands in which the object is detected are presented;
(7) of 1.4 GHz luminosity in W Hz-1;
(8) of X-ray (0.5-8 keV) luminosity in erg s-1;
(9) radio-to-optical flux ratio;
(10) X-ray-to-optical flux ratio;
(11) HR, derived from the 0.5–2 and 2–8 keV band counts. For sources detected only in the Giacconi et al. (2002) catalogs, we report the quoted hardness ratio, derived from the 0.5–2 keV and 2–10 keV band counts, clearly marking such cases;
(12) effective photon index , as given by Alexander et al. (2003);
(13) classification obtained from the X-ray characteristics ( and/or ) or, if possible for sources with insufficient X-ray information, from the radio power;
(14) classification obtained from the optical spectrum, as in Szokoly et al. (2004), or after estimating any possible line-emission diagnostic ratios (Sey2 or SF).
5 Comments on individual sources
1: ATCDFS_J033159.86-274541.3: Unidentified at optical ( mag and undetected in the stacked image) and X-ray wavelengths.
2: ATCDFS_J033204.81-274125.8: The optical counterpart matches the position of the X-ray identification. It presents a complex optical morphology, with several peaks of brightness within a 0.50.5″2 region. The spectroscopic redshift (), based on a single emission line considered to be MgII, is supported by the photometric redshift estimate. The high X-ray luminosity and hard X-ray spectrum indicate a type 2 AGN.
3: ATCDFS_J033205.07-274535.5: A faint, extended optical object is observed 2.6″ away from the radio position, at the border of the 3 radio position error region. The estimated photometric redshift is highly uncertain owing to the small number of optical bands where the object is detected. No X-ray emission is observed.
4: ATCDFS_J033208.51-274648.8: A bright ( mag) disk galaxy at , also detected at X-rays. Optical spectroscopic line ratios indicate the presence of an AGN, confirmed by the X-ray emission properties ( and ), despite the low X-ray-to-optical flux ratio (source undetected in the soft 0.5-2 keV X-ray band).
5: ATCDFS_J033208.60-274043.0: An optically bright ( mag) disk galaxy at . An optically unidentified X-ray detection exists just outside the radio 3 error region, but it seems unrelated to the radio emission.
6: ATCDFS_J033208.67-274734.3: An optical point-like source at , showing indications of underlying low-level extended optical emission. The implied high X-ray luminosity and hard X-ray spectrum classifies this as a type-1 QSO. Broad emission lines are detected in the optical spectrum.
7: ATCDFS_J033209.72-274249.0: A spheroidal galaxy also detected in X-rays, at . The X-ray emission is characteristic of a type-1 AGN. Two nearby (within 20″) galaxies show similar redshifts, at and . This is one of the members of the structure found at in the CDFS (Gilli et al., 2003; Szokoly et al., 2004; Adami et al., 2005).
8: ATCDFS_J033210.80-274629.2: A compact optical source also detected in X-rays. The redshift () implies high X-ray and radio luminosities characteristic of an AGN, as does the X-ray-to-optical flux ratio.
9: ATCDFS_J033210.91-274415.1: A broad emission line type-1 QSO at as revealed by the optical spectroscopy and X-ray properties. Extended emission from the host galaxy is visible in the ACS images.
10: ATCDFS_J033211.00-274053.6: A compact optical source, also displaying X-ray emission, close (3.5″ away) to a bright spiral galaxy. The absence of a spectroscopic or a photometric redshift prevents classification of this object, although the X-ray-to-optical flux ratio is indicative of an AGN. The observed properties of this source are similar to those of the type-1 QSO identified for source #9, perhaps at a higher redshift.
11: ATCDFS_J033211.51-274711.5: A galaxy with a highly irregular optical morphology at . No X-ray emission is detected.
12: ATCDFS_J033213.08-274351.0: Despite being a relatively bright radio source in this sample (S mJy), there is no likely optical ( mag and undetected in the stacked image) or X-ray counterpart. The radio-to-optical flux ratio (4.86) is one of the largest in this sample.
13: ATCDFS_J033213.28-274240.3: A complex system apparently involving a bright ( mag) galaxy (source #13a) with faint spiral structure surrounded by several knots of optical emission, and a possible edge-on galaxy (source #13b). This possible merger system is identified as a single object in the public ACS GOODS catalog: SExtractor was used to deblend the two major components. The brightest source (#13a) is an X-ray detection at a redshift of , with X-ray properties characteristic of a type-2 AGN.
14: ATCDFS_J033214.17-274910.2: A faint ( mag), extended object with a redshift of , and no X-ray detection.
15: ATCDFS_J033217.11-274303.9: A spheroidal galaxy at , with optical spectroscopy indicating a broad emission line AGN, and the X-ray emission classifying it as a type-1 AGN.
16: ATCDFS_J033217.22-275222.4: The likely optical counterpart is a disk galaxy at with X-ray emission indicative of a type-2 AGN. The radio emission extends to the southeast, towards a brighter source with similar spectroscopic redshift of . The spectroscopic observations available in a 1′1′ region centered in this source reveal eight redshifts between 1.05 and 1.10. This indicates the existence of a high-redshift complex likely including also radio source #20. In fact, a massive group has recently been detected in the CDFS at this very redshift (Adami et al., 2005).
17: ATCDFS_J033218.01-274718.4: A galaxy at , also detected at X-rays. Both optical spectroscopy and X-ray properties indicate a star-forming galaxy, although at high X-ray and radio luminosities. The ACS image actually resolves this source into a brighter spheroidal component and a much fainter companion 0.5″ away, likely revealing a merging event. Five nearby (within 30″) sources have similar spectroscopic redshifts (). These are members of the structure known to exist in the CDFS at this redshift (Gilli et al., 2003; Szokoly et al., 2004; Adami et al., 2005).
18: ATCDFS_J033218.03-275056.2: A faint optical source with a complex morphology lies inside the radio position error region. The photometric redshift (), essentially from ground-based photometry, is likely to be biased by a slightly brighter source 0.4″ to the south, whose relation to the assumed optical ID is unclear. A nearby bright disk galaxy and the X-ray detection east of the radio coordinates are too distant to be considered related to the radio emission.
19: ATCDFS_J033218.83-275410.3: No optical identification exists within the 3 radio position error region. Instead, this radio source is thought to form, with source #21, the double radio lobe structure related to a cD-type galaxy 10.2″ away (bright galaxy indicated by the horizontal lines), at a photometric redshift of . A weak X-ray detection from the Giacconi et al. (2002) catalog is associated to the optical galaxy, indicating the presence of a type-2 AGN. From the available redshift surveys in this field, there are four nearby galaxies at similar redshifts (), which indicates the presence of a group. It is unclear the association with another weak X-ray detection, 3″ south from the radio position (see Figure 2), again detected only in the Giacconi et al. (2002) catalog (identified as source 527 in that catalog).
20: ATCDFS_J033219.41-275216.5: An irregular galaxy showing indications for a tidal tale towards the southeast, which suggests a merger event. The photometric redshift is comparable to the spectroscopic redshift of 1.096 for the slightly fainter galaxy 3″ to the southwest, a possible merger companion. The redshifts suggest membership of the structure discussed for source #16.
21: ATCDFS_J033219.57-275403.2: This source is thought to be the second radio lobe associated to a cD-type galaxy 5.5″ away (the bright galaxy indicated by the horizontal lines). See the discussion for source #19, the other proposed radio lobe.
22: ATCDFS_J033219.82-274121.2: A galaxy at , also detected at X-rays. The X-ray emission does not provide a definite classification of this source, although the optical line ratio points to a Seyfert 2 type galaxy. The X-ray-to-optical flux ratio, however, is more indicative of star-formation.
23: ATCDFS_J033221.24-274436.1: The optical identification seems to be part of a merging pair, the second galaxy just outside the radio position error region. The optical spectrum, revealing a redshift of , likely includes light from both sources, 0.9″ apart. This is also a weak X-ray detection in the 0.5-1 keV band (source S12 of Alexander et al., 2003). The low X-ray-to-optical flux ratio is indicative of star-formation.
24: ATCDFS_J033221.92-274243.8: A weak extended optical source. The photometric redshift of may be biased by a brighter source 1″ to the north, whose relation to the assumed optical ID is unclear.
25: ATCDFS_J033222.36-274807.3: Unidentified at optical ( mag and undetected in the stacked image) and X-ray wavelengths. The nearby X-ray detections seem unrelated to the radio emission.
26: ATCDFS_J033222.64-274424.5: A spiral galaxy at , displaying weak X-ray emission detected only in the 0.5-8 keV band (source 148 of Alexander et al., 2003). The optical spectroscopy, although of low S/N, is indicative of star-formation, as is the low X-ray-to-optical flux ratio. This is another likely member of the structure detected at this redshift in the CDFS (Gilli et al., 2003; Szokoly et al., 2004; Adami et al., 2005).
27: ATCDFS_J033224.59-275441.6: A disk galaxy at , with no X-ray emission. The available optical spectroscopy does not provide enough lines to apply line ratio diagnostics.
28: ATCDFS_J033225.15-275452.2: A ellipsoidal galaxy with a spectroscopic redshift of , also detected at X-rays. The X-ray emission classifies it as a type-2 AGN, while the optical spectroscopy reveals an absorption-line spectrum. This is a likely member of the structure recently found at in the CDFS (Adami et al., 2005).
29: ATCDFS_J033226.98-274106.5: This is the brightest radio source in the ACS area, with S mJy. The optical identification is a point-like source which shows the brightest X-ray flux in this sample. At , this is a type-1 QSO, with optical spectroscopy revealing a broad-line AGN. At least three other galaxies lie at the same redshift in the surrounding 1′1′ region, again tracing the structure detected at this redshift in the CDFS (Gilli et al., 2003; Szokoly et al., 2004; Adami et al., 2005).
30: ATCDFS_J033227.64-275040.5: A galaxy at , also detected in X-rays. The optical image reveals a very irregular, knotty morphology, possibly indicative of a merging event and related star-formation. The X-ray emission does not elucidate on the processes behind its luminosity, although the X-ray-to-optical flux ratio is typical of star-forming galaxies. The optical spectroscopy presents some lines which are more common on AGNs (e.g., [NeV]). However, this line may also be generated in shocks in interacting galaxies. This radio source is another likely member of the massive group recently detected in the CDFS at (Adami et al., 2005).
31: ATCDFS_J033227.98-274641.5: A bright ( mag) disk galaxy at . This source was observed spectroscopically by Croom, Warren, & Glazebrook (2001), revealing a spectra dominated by absorption features, although it presents emission in H and [NII]. A fainter optical source, which could be a companion galaxy, is seen 1.5″ to the north
32: ATCDFS_J033228.31-273842.9: A galaxy at presenting irregular structure with a nearby (1.7″ away), possibly related, companion.
33: ATCDFS_J033228.71-274402.3: Unidentified at optical ( mag and undetected in the stacked image) and X-ray wavelengths.
34: ATCDFS_J033228.78-274620.8: An ellipsoidal galaxy at a redshift of , also detected in X-rays. Several nearby fainter optical sources exist and low-level optical emission bridges to at least one neighbor, which suggests interaction. The galaxy is classified as a type-1 AGN from its X-ray properties. Again, this is a likely member of the structure that exists in the CDFS (Gilli et al., 2003; Szokoly et al., 2004; Adami et al., 2005).
35: ATCDFS_J033229.59-274332.5: Unidentified at optical ( mag and undetected in the stacked image) and X-ray wavelengths.
36: ATCDFS_J033229.83-274423.7: A flocculent galaxy, with X-ray emission coincident with its nuclear region. At the galaxy is part of a larger structure - low-level optical emission connects this galaxy to the optical identification of source #38, indicating an interacting pair (as previously noted by Giacconi et al., 2001), and a smaller galaxy at the same redshift is located roughly 20″ west. The X-ray characteristics indicate a star-forming galaxy.
37: ATCDFS_J033229.89-274520.0: A spiral/flocculent galaxy at . X-ray emission detected towards the west side of the galaxy could be related to an area of brighter optical emission in the western spiral arm. The X-ray and radio characteristics do not reveal AGN activity. Two other galaxies in the immediate vicinity (within 9″) lie at similar redshifts, indicating the presence of a larger structure.
38: ATCDFS_J033229.96-274404.8: Another flocculent galaxy at , connected by low-level optical emission to source #36. X-ray emission is detected north of the nuclear region, with characteristics indicative of star formation.
39: ATCDFS_J033229.98-275258.7: An extended faint optical source (), is identified as the possible optical counterpart. However, this is a complex region, both in the optical and in the radio: a couple of faint optical sources appear near the radio position in the combined image, and the radio emission partly overlaps source #40. In fact, an X-ray source associated with an optically complex multiple system is observed halfway between sources #39 and #40: a possible interpretation would be that these two radio sources are somehow associated with the X-ray source (source S22 of Alexander et al., 2003), although the X-ray characteristics and optical spectroscopy do not indicate any AGN activity.
40: ATCDFS_J033230.20-275312.7: The most likely optical counterpart is a very faint ( mag) galaxy revealed in the combined image as a pair of sources. It should be noted that this is a complex region in both the optical and the radio, with some overlapping between the radio emission of sources #39 and #40, which could even be related; see the discussion for source #39.
41: ATCDFS_J033231.44-274621.5: The radio source has two candidate optical IDs with similar values of . The most likely (source #41a) is an X-ray source with a spectroscopic redshift , which agrees with the photometric redshift estimate. This source has a high X-ray luminosity indicating an AGN (see also Szokoly et al., 2004), although Daddi et al. (2004) argues that it may be a vigorous star-forming galaxy. Recently, van Dokkum et al. (2005) performed Gemini near-infrared spectroscopy of this source, and found a surprising lack of AGN spectral features. Instead, the observed Seyfert-like line ratios could be explained by shock ionization due to a strong galactic wind in a starburst galaxy. A second possible identification (source #41b) has no detectable X-ray emission and a photometric redshift estimate of . The optical image shows an extended galaxy, hinting at the existence of tidal tail disruption.
42: ATCDFS_J033233.44-275228.0: Unidentified at optical ( mag and undetected in the stacked image) wavelengths. A weak X-ray detection exists in the Giacconi et al. (2002) catalog.
43: ATCDFS_J033234.97-275456.1: A faint object is just perceptible in the image, although it is not present in the public ACS GOODS catalogs. In the stacked image, two faint objects are visible. Inspection of the individual optical bands reveal one of these sources appearing only in the bluer bands ( and ), while the other appears mainly in the and band, being just hinted in the redder band at (value from aperture photometry).
44: ATCDFS_J033235.07-275532.8: A disk galaxy at with X-ray emission originating from the disk. As discussed by Szokoly et al. (2004), the X-ray luminosity, hardness ratio and the location of the X-ray emission indicate a ultraluminous X-ray source (ULX) hosted by a normal galaxy. The low radio luminosity is consistent with this interpretation.
45: ATCDFS_J033235.46-275452.8: A faint optical source ( mag) is identified as the possible counterpart, although the stacked image hints at the presence of fainter sources in the region. The optical counterpart candidate displays a faint elongated morphology. No X-ray emission is present in this region.
46: ATCDFS_J033235.71-274916.0: A compact optical source with a close neighbor only visible in the ACS images (0.3″ away) is the probable identification, at . X-ray emission is also present. The radio and X-ray properties classify this as a type-2 AGN.
47: ATCDFS_J033237.22-275129.7: A pair of interacting galaxies at a photometric redshift, which includes light from both sources, of . The western galaxy is a face-on spiral (source #47a) while the eastern source is disk galaxy (source #47b). No X-ray emission is detected.
48: ATCDFS_J033237.75-275000.7: A complex optical system at , with this photometric redshift estimate including light from the entire region. Two optical sources separated by around 1″ are identified as likely counterparts. Careful inspection of the stacked image reveals four patches of optical emission surrounded by elongated structures of low surface brightness, perhaps indicating a merger event. No X-ray emission is detected.
49: ATCDFS_J033237.75-275211.9: A compact optical source also detected in the X-rays with . The X-ray properties (luminosity and hardness ratio) indicate a type-1 QSO.
50: ATCDFS_J033238.75-274632.5: The possible optical identification for this weak radio source is a bright ( mag) galaxy at . However, we note that this optical identification is of low reliability (), and the slightly extended east-west radio contours rise the possibility of complex radio emission originating in more than one of the galaxies seen in this region.
51: ATCDFS_J033239.46-275300.9: Two ellipsoidal galaxies separated by 1.2″ in a likely merging event (as indicated by the low surface brightness extended emission). The photometric redshift is , identical for both sources, but resulting from separate analysis in the Wolf et al. (2004) work.
52: ATCDFS_J033239.64-274851.8: Two unrelated optical sources are possible counterparts. The most likely counterpart (source #52a) is an X-ray source with , classified as a type-2 AGN from its X-ray properties. The other possible counterpart (source #52b) has no X-ray emission and a photometric redshift of .
53: ATCDFS_J033240.82-275545.8: A faint optical source ( mag) with X-ray emission. A spectrum with a “hint of some spectral feature” was obtained for this source by Szokoly et al. (2004), suggesting a redshift of . The photometric estimate results in a higher value of . Considering even the smallest (spectroscopic) value, the X-ray characteristics indicate a type-2 AGN consistent with the X-ray-to-optical flux ratio.
54: ATCDFS_J033243.12-275514.2: A pair of galaxies separated by 0.6″ with disturbed morphology associated with traces of low surface brightness tails, indicating a merging system. The photometric redshift, based on the light from both sources, is . No X-ray emission is detected.
55: ATCDFS_J033244.16-275142.4: A spectroscopically confirmed pair of galaxies at . The western companion (source #55a) is orientated edge-on and has clear signs of dust obscuration, displaying an optical spectrum dominated by absorption features. The eastern galaxy (source #55b) displays an emission-line optical spectrum with inconclusive line ratios. This latter galaxy is an X-ray source, with X-ray characteristics indicative of star-formation. However, the optical spectroscopy reveals line ratios suggesting a Seyfert 2 type galaxy.
56: ATCDFS_J033244.93-274726.2: A spiral galaxy at , with no X-ray emission and narrow emission-line optical spectrum.
57: ATCDFS_J033245.03-275438.8: A face-on spiral galaxy with , showing knots of star formation. Faint X-ray emission is detected, possibly off-centered towards the north arm of the galaxy. The X-ray characteristics are consistent with star formation.
58: ATCDFS_J033246.03-275318.2: No reliable optical counterpart is detected for this radio source, even in the stacked image. No X-ray emission is observed either. One should note that this is a complex region in the radio, since the radio emission overlaps with that of source #59.
59: ATCDFS_J033246.33-275328.6: The likely optical counterpart exhibits a complex morphology and an estimated photometric redshift of . No X-ray emission is detected.
60: ATCDFS_J033246.78-275120.1: Two galaxies without X-ray emission are possible optical counterparts, with similar values for . Photometry indicates for the southern object (source #60a), while the northern galaxy (source #60b) has no reliable redshift determination.
61: ATCDFS_J033248.02-275414.7: A faint optical source ( mag) lies close to the radio position and is the possible optical counterpart. The faint magnitude prevents any photometric redshift estimate.
62: ATCDFS_J033248.62-274934.9: An extended object at a spectroscopic redshift of which, despite based on a low S/N spectrum, is supported by the photometric redshift estimates. A second optical source lies less than 1″ to the southeast, just outside the 3 radio position error region. Traces of low surface brightness emission connect both sources, which suggests an interacting system. This is also a weak X-ray detection in the Giacconi et al. (2002) catalog.
63: ATCDFS_J033300.91-275049.4: A bright ( mag) optical source is identified as the possible optical counterpart, although at a relativelly low value of . No X-ray emission is detected from this region.
64: ATCDFS_J033302.99-275147.3: An X-ray counterpart exists with a weak optical source ( mag) lying just outside the position error box of the X-ray detection. The photometric redshift of the optical source is , as estimated by Mobasher et al. (2004). However, for this same optical source, Zheng et al. (2004) finds , using other photometric redshift codes. If the optical and X-ray emission are from the same source, the X-ray characteristics indicate, at the lowest redshift mentioned above, a type-1 AGN. If the higher redshift is the correct one, then this will be classified as a type-1 QSO.
6 Discussion
There are 64 sources in the radio catalog. Likely ACS counterparts have been identified for 50 of these (78% - where we include unique optical counterparts with , likely merger systems and sources #19 and #21 as the radio lobes of the same radio galaxy). Optical identifications with lower reliability () exist for 7 radio sources, including three cases where seemingly independent optical identifications are equally reliable at the level (sources #41, #52 and # 60). For 7 radio sources (11%) no optical identification was possible.
The redshifts for the optically identified radio sources range from below 0.1 to above 3, although most are found up to . This is in agreement with previous work on the Hubble Deep Field North (HDF-N) and the Small Selected Area (SSA) 13 fields, which reach similar depths for the spectroscopic observations (Chapman et al., 2003). Several radio sources are identified at and . These are likely members of the structures already found in the CDFS region (Gilli et al., 2003; Szokoly et al., 2004; Adami et al., 2005).
A total of 34 radio sources (53%) have an X-ray counterpart - in all but three cases, the X-ray identifications are unambiguously associated with reliable optical counterparts of the radio sources. For sources #41 and #52, where two optical sources appear as possible counterparts, the X-ray detection suggests which optical counterpart is the real one. Source #42 has no optical counterpart despite the X-ray detection.
The 7 radio sources without ACS counterparts (hereinafter “optically faint radio sources”) are of particular interest. In a pioneering study of optically faint sub-milliJansky radio sources, Richards et al. (1999) reported that approximately 60% of the radio sources detected in very deep 1.4 GHz surveys of the Hubble Deep Field (North) and the Small Selected Area 13 fields, have relatively bright ( mag) disk galaxy counterparts, 20% have low-luminosity AGN counterparts, and the remaining 20% have no counterpart brighter than . Deep -band imaging of this population revealed that several are very red objects, with (Richards et al., 1999), suggesting that these objects form an inhomogeneous population, including high-redshift dusty starbursts, extreme redshift radio-loud AGNs, moderate redshift AGNs with optical hosts having a relatively low optical power, or one-sided radio jets. With the deep ACS imaging reported here, we find 16 sources (25%) with mag, with the fraction of optically unidentified ( mag) radio sources being 11% (7 sources). However, the radio flux density of 3 out of these 7 optically unidentified sources is brighter than 1 mJy, significantly brighter than the sources studied by Richards et al. (1999). These sources are either extremely reddened, or are extremely ”radio loud”. They invite follow-up infrared imaging to elucidate their character.
Altogether, there are 23 radio sources (counting sources #19 and #21 as a single one) for which a classification is possible based on the X-ray emission alone. Of these, 15 (65%) have an AGN designation, 4 (17%) are QSOs, and 4 are classified as normal galaxies. Thus, based on the properties of X-ray counterparts, 19 (30%) of the radio sources have evidence of an AGN. Considering only the sub-mJy radio sources in the sample, then 15 out of 55 sources (27%) show signs of AGN activity based on their detected X-ray emission alone. The proportion of faint radio sources associated with AGN X-ray sources is thus significantly higher that the proportion (20%) of radio sources with evidence of AGN activity reported by Richards et al. (1999) on the basis of classification by radio spectral index and optical morphology.
It is claimed that very deep radio images will provide a population of radio-selected objects that are of great astrophysical interest, since they will be selected without the intervention of dust obscuration. The present survey lends weight to this claim. The optical and X-ray counterparts of the faint radio sources, as well as the blank fields, invite further study at infrared wavelengths since many will be galaxies exhibiting evidence of violent star formation and AGN activity at intermediate and high redshifts.
7 Conclusions
We present the cross-correlation between a deep radio survey of the GOODS-S ACS field and the available optical and X-ray data. Out of the 64 radio sources in this region, 58 have an optical and/or X-ray identification. Spectroscopic or photometric redshifts are available for the majority of these sources, which allows a classification to be established.
The superb ACS imaging quality reveals the morphological characteristics of the radio sample which can now be used, in particular, to analyze in more detail the morphology of radio-selected star-forming galaxies.
In spite of the very deep optical observations available, seven radio sources remain optically unidentified, all but one revealing no indications of X-ray emission. Infrared observations, in particular those being done by the Spitzer Space Telescope, will probably reveal some of these sources, likely to be very dusty star-forming galaxies or very high redshift AGN. Further radio observations will also be needed to elucidate on the physical mechanisms present in these sources.
References
- Afonso et al. (2005) Afonso, J., Georgakakis, A., Almeida, C., Hopkins, A., Cram, L., Mobasher, B., & Sullivan, M. 2005, ApJ, 624, 135
- Adami et al. (2005) Adami, C., et al. 2005, A&A, in press (astro-ph/0507690)
- Alexander et al. (2003) Alexander, D. M., et al. 2003, AJ, 126, 539
- Alexander et al. (2002) Alexander, D. M., Aussel, H., Bauer, F. E., Brandt, W. N., Hornschemeier, A. E., Vignali, C., Garmire, G. P., & Schneider, D. P. 2002, ApJ, 568, L85
- Chapman et al. (2003) Chapman, S. C., et al. 2003, ApJ, 585, 57
- Condon (1992) Condon, J. J. 1992, ARA&A, 30, 575
- Croom, Warren, & Glazebrook (2001) Croom, S. M., Warren, S. J., & Glazebrook, K. 2001, MNRAS, 328, 150
- Daddi et al. (2004) Daddi, E., et al. 2004, ApJ, 600, L127
- Georgakakis et al. (1999) Georgakakis, A., Mobasher, B., Cram, L., Hopkins, A., Lidman, C., & Rowan-Robinson, M. 1999, MNRAS, 306, 708
- Giacconi et al. (2001) Giacconi, R., et al. 2001, ApJ, 551, 624
- Giacconi et al. (2002) Giacconi, R., et al. 2002, ApJS, 139, 369
- Giavalisco et al. (2004) Giavalisco, M., et al. 2004, ApJ, 600, L93
- Gilli et al. (2003) Gilli, R., et al. 2003, ApJ, 592, 721
- Hornschemeier et al. (2003) Hornschemeier, A. E., et al. 2003, AJ, 126, 575
- Hornschemeier et al. (2001) Hornschemeier, A. E., et al. 2001, ApJ, 554, 742
- Le Fèvre et al. (2004) Le Fèvre, O., et al. 2004, A&A, 428, 1043
- Maccacaro et al. (1988) Maccacaro, T., Gioia, I., Wolter, A., Zamorani, G., & Stocke, J. 1988, ApJ, 326, 680
- Merloni et al. (2003) Merloni, A., Heinz, S., & di Matteo, T. 2003, MNRAS, 345, 1057
- Mignoli et al. (2005) Mignoli, M., et al. 2005, A&A, 437, 883
- Mobasher et al. (2004) Mobasher, B., et al. 2004, ApJ, 600, L167
- Peacock (2002) Peacock, J. 2002, Tenerife Winter School, Dark matter and dark energy in the universe , astro-ph/0309240
- Richards et al. (1998) Richards, E. A., Kellermann, K. I., Fomalont, E. B., Windhorst, R. A., & Partridge, R. B. 1998, AJ, 116, 1039
- Richards et al. (1999) Richards, E. A., Fomalont, E. B., Kellermann, K. I., Windhorst, R. A., Partridge, R. B., Cowie, L. L., & Barger, A. J. 1999, ApJ, 526, L73
- Sanders & Mirabel (1996) Sanders, D. B., & Mirabel, I. F. 1996, ARA&A, 34, 749
- Schmidt et al. (1998) Schmidt, M., et al. 1998, A&A, 329, 495
- Shapley et al. (2001) Shapley, A., Fabbiano, G., & Eskridge, P. B. 2001, ApJS, 137, 139
- Stocke et al. (1991) Stocke, J. T., Morris, S. L., Gioia, I. M., Maccacaro, T., Schild, R., Wolter, A., Fleming, T. A., & Henry, J. P. 1991, ApJS, 76, 813
- Sutherland & Saunders (1992) Sutherland, W., & Saunders, W. 1992, MNRAS, 259, 413
- Szokoly et al. (2004) Szokoly, G. P., et al. 2004, ApJS, 155, 271
- van Dokkum et al. (2005) van Dokkum, P. G., Kriek, M., Rodgers, B., Franx, M., & Puxley. P. 2005, ApJ, in press, astro-ph/0502082
- Vanzella et al. (2004) Vanzella, E., et al. 2004, A&A, submitted
- Windhorst et al. (1985) Windhorst, R.A., Miley, G.K., Owen, F.N., Kron, R.G., & Koo, D.C. 1985, ApJ, 289, 494
- Wolf et al. (2004) Wolf, C., et al. 2004, A&A, 421, 913
- Yun et al. (2001) Yun, M. S., Reddy, N. A., & Condon, J. J. 2001, ApJ, 554, 803
- Zheng et al. (2004) Zheng, W., et al. 2004, ApJS, 155, 73
| No | Radio source | ACS | dist | CXO | dist | |||||
|---|---|---|---|---|---|---|---|---|---|---|
| (mJy) | ″ | ″ | ( W m-2) | |||||||
| 1 | ATCDFS_J033159.86-274541.3 | 0.137 0.042 | 27.7 | |||||||
| 2 | ATCDFS_J033204.81-274125.8 | 0.095 0.038 | J033204.84-274127.4 | 0.86 | 1.6 | 23.545 | J033204.89-274127.6 | 2.0 | 0.23 | 5.66 |
| 3 | ATCDFS_J033205.07-274535.5 | 0.087 0.042 | J033205.21-274537.3 | 0.38 | 2.6 | 25.300 | ||||
| 4 | ATCDFS_J033208.51-274648.8 | 0.193 0.040 | J033208.53-274648.3 | 1.00 | 0.6 | 18.565 | J033208.50-274648.6 | 0.3 | 0.09 | 1.14 |
| 5 | ATCDFS_J033208.60-274043.0 | 0.077 0.038 | J033208.67-274042.9 | 0.98 | 0.8 | 20.048 | ||||
| 6 | ATCDFS_J033208.67-274734.3 | 1.958 0.046 | J033208.66-274734.4 | 1.00 | 0.2 | 18.483 | J033208.66-274734.4 | 0.2 | 44.61 | 67.71 |
| 7 | ATCDFS_J033209.72-274249.0 | 0.229 0.039 | J033209.71-274248.1 | 0.99 | 0.9 | 20.479 | J033209.69-274248.4 | 0.7 | 0.42 | 0.62 |
| 8 | ATCDFS_J033210.80-274629.2 | 0.157 0.042 | J033210.79-274627.8 | 0.98 | 1.5 | 22.911 | J033210.80-274627.6 | 1.7 | 0.09 | 0.38 |
| 9 | ATCDFS_J033210.91-274415.1 | 3.057 0.052 | J033210.91-274414.9 | 1.00 | 0.2 | 22.371 | J033210.91-274415.1 | 0.1 | 6.14 | 9.81 |
| 10 | ATCDFS_J033211.00-274053.6 | 0.286 0.038 | J033210.99-274053.7 | 0.99 | 0.2 | 23.577 | J033211.00-274053.7 | 0.1 | 1.88 | 3.94 |
| 11 | ATCDFS_J033211.51-274711.5 | 0.137 0.040 | J033211.50-274713.1 | 0.99 | 1.5 | 21.086 | ||||
| 12 | ATCDFS_J033213.08-274351.0 | 1.366 0.038 | 28.2 | |||||||
| 13a | ATCDFS_J033213.28-274240.3 | 0.127 0.048 | J033213.23-274241.0aaOptical sources deblended using SExtractor | 0.91 | 0.9 | 19.698 | J033213.24-274240.9 | 0.8 | 2.48 | 18.73 |
| 13b | J033213.37-274239.9aaOptical sources deblended using SExtractor | 1.3 | 21.919 | |||||||
| 14 | ATCDFS_J033214.17-274910.2 | 0.141 0.034 | J033214.13-274910.1 | 0.97 | 0.6 | 24.105 | ||||
| 15 | ATCDFS_J033217.11-274303.9 | 0.079 0.040 | J033217.14-274303.3 | 0.98 | 0.7 | 20.566 | J033217.14-274303.3 | 0.7 | 4.50 | 6.39 |
| 16 | ATCDFS_J033217.22-275222.4 | 0.063 0.032 | J033217.17-275220.8 | 0.70 | 1.8 | 21.766 | J033217.18-275220.9 | 1.7 | 0.55 | 20.15 |
| 17 | ATCDFS_J033218.01-274718.4 | 0.404 0.034 | J033218.01-274718.5 | 1.00 | 0.1 | 19.405 | J033218.07-274718.2 | 0.7 | 0.28 | 0.32 |
| 18 | ATCDFS_J033218.03-275056.2 | 0.203 0.048 | J033218.17-275056.6 | 0.43 | 1.8 | 26.263 | ||||
| 19 | ATCDFS_J033218.62-275411.4 | 4.779 0.071 | J033219.29-275406.1 | 10.2 | 20.279 | (G249)ccX-ray sources from Giacconi et al. (2002); the source is denoted by its number in the catalogue therein, while the flux in the 2-8 keV band is an estimate based on the reported flux in the 2-10 keV band and assuming a power-law photon index of 1.4. | 12.4 | 0.15 | 0.61 | |
| 20 | ATCDFS_J033219.41-275216.5 | 0.201 0.032 | J033219.52-275217.7 | 0.55 | 1.8 | 21.871 | ||||
| 21 | ATCDFS_J033219.62-275402.9 | 5.861 0.083 | J033219.29-275406.1 | 5.5 | 20.279 | (G249)ccX-ray sources from Giacconi et al. (2002); the source is denoted by its number in the catalogue therein, while the flux in the 2-8 keV band is an estimate based on the reported flux in the 2-10 keV band and assuming a power-law photon index of 1.4. | 4.0 | 0.15 | 0.61 | |
| 22 | ATCDFS_J033219.82-274121.2 | 0.228 0.085 | J033219.81-274122.7 | 0.98 | 1.5 | 18.736 | J033219.81-274123.1 | 1.9 | 0.22 | 0.94 |
| 23 | ATCDFS_J033221.24-274436.1 | 0.178 0.034 | J033221.28-274435.6 | 0.97 | 0.7 | 19.625 | J033221.24-274435.9 | 0.2 | 0.08 | 0.31 |
| 24 | ATCDFS_J033221.92-274243.8 | 0.089 0.040 | J033222.01-274243.3 | 0.80 | 1.2 | 24.099 | ||||
| 25 | ATCDFS_J033222.36-274807.3 | 0.144 0.042 | 28.4 | |||||||
| 26 | ATCDFS_J033222.64-274424.5 | 0.097 0.034 | J033222.58-274425.8 | 0.97 | 1.5 | 20.279 | J033222.63-274426.0 | 1.5 | 0.07 | 0.43 |
| 27 | ATCDFS_J033224.59-275441.6 | 0.086 0.038 | J033224.53-275443.0 | 0.96 | 1.6 | 18.907 | ||||
| 28 | ATCDFS_J033225.15-275452.2 | 0.079 0.038 | J033225.16-275450.1 | 0.97 | 2.1 | 21.208 | J033225.17-275449.6 | 2.7 | 0.08 | 3.91 |
| 29 | ATCDFS_J033226.98-274106.5 | 20.011 0.208 | J033227.01-274105.0 | 0.73 | 1.6 | 19.004 | J033227.00-274105.1 | 1.5 | 49.41 | 68.58 |
| 30 | ATCDFS_J033227.64-275040.5 | 0.076 0.032 | J033227.72-275040.8 | 0.92 | 1.0 | 21.420 | J033227.67-275040.7 | 0.3 | 0.03 | 0.27 |
| 31 | ATCDFS_J033227.98-274641.5 | 0.094 0.030 | J033227.99-274639.2 | 0.96 | 2.3 | 19.364 | ||||
| 32 | ATCDFS_J033228.31-273842.9 | 0.142 0.060 | J033228.35-273841.7 | 0.99 | 1.4 | 19.246 | ||||
| 33 | ATCDFS_J033228.71-274402.3 | 4.061 0.083 | 28.1 | |||||||
| 34 | ATCDFS_J033228.78-274620.8 | 0.237 0.036 | J033228.74-274620.4 | 0.98 | 0.7 | 21.017 | J033228.73-274620.2 | 0.9 | 0.25 | 0.20 |
| 35 | ATCDFS_J033229.59-274332.5 | 1.429 0.076 | 28.1 | |||||||
| 36 | ATCDFS_J033229.83-274423.7 | 1.088 0.044 | J033229.88-274424.4 | 0.97 | 0.8 | 16.451 | J033229.88-274425.0 | 1.3 | 0.81 | 0.34 |
| 37 | ATCDFS_J033229.89-274520.0 | 0.115 0.054 | J033229.85-274520.5 | 0.91 | 0.7 | 21.009 | J033229.75-274520.3 | 1.9 | 0.07 | 0.13 |
| 38 | ATCDFS_J033229.96-274404.8 | 0.449 0.036 | J033229.99-274404.8 | 1.00 | 0.3 | 16.840 | J033230.01-274404.0 | 1.0 | 0.57 | 0.71 |
| 39 | ATCDFS_J033229.98-275258.7 | 0.082 0.025 | J033230.10-275300.1 | 0.40 | 2.0 | 26.190 | ||||
| 40 | ATCDFS_J033230.20-275312.7 | 0.063 0.024 | J033230.23-275312.4 | 0.62 | 0.5 | 26.759 | ||||
| 41a | ATCDFS_J033231.44-274621.5 | 0.063 0.036 | J033231.46-274623.2 | 0.49 | 1.6 | 22.877 | J033231.47-274623.0 | 1.4 | 0.06 | 0.33 |
| 41b | J033231.40-274621.4 | 0.48 | 0.6 | 23.046 | ||||||
| 42 | ATCDFS_J033233.44-275228.0 | 0.097 0.032 | 28.1 | (G632)ccX-ray sources from Giacconi et al. (2002); the source is denoted by its number in the catalogue therein, while the flux in the 2-8 keV band is an estimate based on the reported flux in the 2-10 keV band and assuming a power-law photon index of 1.4. | 1.5 | 0.06 | 0.46 | |||
| 43 | ATCDFS_J033234.97-275456.1 | 0.127 0.030 | J033234.96-275455.8bbOptical source not in the released ACS catalogue. The magnitude results from aperture photometry. | 0.98 | 0.4 | 27.482 | ||||
| 44 | ATCDFS_J033235.07-275532.8 | 0.310 0.048 | J033235.08-275533.0 | 1.00 | 0.2 | 15.698 | J033234.73-275533.8 | 4.6 | 0.13 | 1.66 |
| 45 | ATCDFS_J033235.46-275452.8 | 0.078 0.028 | J033235.51-275449.9 | 0.56 | 3.0 | 26.166 | ||||
| 46 | ATCDFS_J033235.71-274916.0 | 0.072 0.030 | J033235.71-274916.0 | 0.97 | 0.1 | 24.660 | J033235.72-274916.0 | 0.1 | 0.05 | 0.70 |
| 47a | ATCDFS_J033237.22-275129.7 | 0.077 0.032 | J033237.17-275127.9 | 0.90 | 1.9 | 21.352 | ||||
| 47b | J033237.34-275127.4 | 2.8 | 21.028 | |||||||
| 48a | ATCDFS_J033237.75-275000.7 | 0.181 0.038 | J033237.74-275000.4 | 0.51 | 0.4 | 23.353 | ||||
| 48b | J033237.76-275001.4 | 0.48 | 0.6 | 23.310 | ||||||
| 49 | ATCDFS_J033237.75-275211.9 | 0.091 0.032 | J033237.76-275212.3 | 0.98 | 0.3 | 23.540 | J033237.77-275212.4 | 0.5 | 5.97 | 8.78 |
| 50 | ATCDFS_J033238.75-274632.5 | 0.072 0.030 | J033238.60-274631.4 | 0.23 | 2.4 | 21.533 | ||||
| 51a | ATCDFS_J033239.46-275300.9 | 0.127 0.032 | J033239.47-275300.5 | 0.57 | 0.5 | 20.540 | ||||
| 51b | J033239.49-275301.6 | 0.43 | 0.7 | 20.400 | ||||||
| 52a | ATCDFS_J033239.64-274851.8 | 0.066 0.030 | J033239.67-274850.6 | 0.49 | 1.3 | 24.547 | J033239.68-274850.7 | 1.2 | 0.75 | 7.06 |
| 52b | J033239.56-274851.7 | 0.47 | 1.2 | 22.552 | ||||||
| 53 | ATCDFS_J033240.82-275545.8 | 0.102 0.032 | J033240.84-275546.7 | 0.97 | 0.9 | 25.183 | J033240.84-275546.6 | 0.8 | 0.54 | 9.34 |
| 54 | ATCDFS_J033243.12-275514.2 | 0.070 0.034 | J033243.17-275514.7 | 0.79 | 0.7 | 23.991 | ||||
| 55a | ATCDFS_J033244.16-275142.4 | 0.511 0.030 | J033244.05-275143.3 | 1.7 | 18.491 | |||||
| 55b | J033244.27-275141.1 | 1.9 | 19.166 | J033244.28-275141.0 | 2.1 | 0.51 | 0.33 | |||
| 56 | ATCDFS_J033244.93-274726.2 | 0.107 0.033 | J033244.86-274727.6 | 0.93 | 1.6 | 18.456 | ||||
| 57 | ATCDFS_J033245.03-275438.8 | 0.122 0.038 | J033245.02-275439.6 | 0.99 | 0.7 | 18.987 | J033244.98-275438.7 | 0.7 | 0.14 | 0.60 |
| 58 | ATCDFS_J033246.03-275318.2 | 0.219 0.046 | 28.2 | |||||||
| 59 | ATCDFS_J033246.33-275328.6 | 0.080 0.038 | J033246.33-275327.0 | 0.76 | 1.7 | 23.639 | ||||
| 60a | ATCDFS_J033246.78-275120.1 | 0.079 0.030 | J033246.84-275121.2 | 0.51 | 1.3 | 23.562 | ||||
| 60b | J033246.79-275118.8 | 0.45 | 1.4 | 24.769 | ||||||
| 61 | ATCDFS_J033248.02-275414.7 | 0.103 0.047 | J033248.05-275412.4 | 0.59 | 2.4 | 26.566 | ||||
| 62 | ATCDFS_J033248.62-274934.9 | 0.097 0.030 | J033248.57-274934.3 | 0.92 | 1.0 | 23.425 | (G578)ccX-ray sources from Giacconi et al. (2002); the source is denoted by its number in the catalogue therein, while the flux in the 2-8 keV band is an estimate based on the reported flux in the 2-10 keV band and assuming a power-law photon index of 1.4. | 0.5 | 0.09 | 0.36 |
| 63 | ATCDFS_J033300.91-275049.4 | 0.078 0.036 | J033300.98-275053.7 | 0.60 | 4.3 | 21.675 | ||||
| 64 | ATCDFS_J033302.99-275147.3 | 0.080 0.036 | J033303.05-275145.8 | 0.89 | 1.7 | 25.134 | J033302.97-275146.4 | 1.0 | 0.69 | 0.93 |
| No | type | / type / number of bands | class | class | |||||||||
|---|---|---|---|---|---|---|---|---|---|---|---|---|---|
| (COMBO-17) | (Mobasher et al. 2004) | (W Hz-1) | (erg s-1) | (X-rays or radio) | (optical) | ||||||||
| 1 | 3.66 | ||||||||||||
| 2 | 0.720ssSpectra from Szokoly et al. (2004) | 1.0 | 0.6860.080 | Galaxy | 1.29 / 2.67 / 13 | 23.30 | 42.49 | 1.84 | -0.10 | 0.51 | -0.27 | AGN2 | LEX |
| 3 | 0.43 / 2.00 / 5 | 22.73 | 2.50 | ||||||||||
| 4 | 0.310ssSpectra from Szokoly et al. (2004) | 2.0 | 0.3280.004 | Galaxy | 0.31 / 1.00 / 15 | 22.76 | 41.34 | 0.15 | -2.50 | 0.29 | 0.21 | AGN2 | LEX/Sey2 |
| 5 | 0.3470.026 | Galaxy | 0.44 / 2.00 / 13 | 22.47 | 0.35 | ||||||||
| 6 | 0.543ssSpectra from Szokoly et al. (2004) | 2.0 | 0.5820.017 | QSO | 0.26 / 3.67 / 15 | 24.32 | 44.08 | 1.13 | 0.16 | -0.50 | 1.73 | QSO1 | BLAGN |
| 7 | 0.733ssSpectra from Szokoly et al. (2004) | 2.0 | 0.7620.007 | Galaxy | 0.71 / 1.00 / 13 | 23.70 | 42.28 | 0.99 | -1.07 | -0.52 | 1.75 | AGN1 | LEX |
| 8 | 1.610mmSpectra from Mignoli et al. (2005) | 2.0 | 1.0130.212 | Galaxy | 1.32 / 1.00 / 14 | 24.34 | 42.47 | 1.80 | -0.76 | -0.05 | 1.40aaGeneric photon index due to low number of counts | AGNX | LEX |
| 9 | 1.615ssSpectra from Szokoly et al. (2004) | 2.0 | 1.5950.010 | QSO | 0.76 / 3.67 / 18 | 25.63 | 44.32 | 2.87 | 0.86 | -0.49 | 1.69 | QSO1 | BLAGN |
| 10 | 2.33 | 0.82 | -0.40 | 1.50 | UNCL | ||||||||
| 11 | 0.576mmSpectra from Mignoli et al. (2005) | 2.0 | 0.5940.019 | Galaxy | 0.94 / 2.00 / 18 | 23.23 | 1.01 | LEX | |||||
| 12 | 4.86 | ||||||||||||
| 13a | 0.605ssSpectra from Szokoly et al. (2004) | 2.0 | 0.6090.008 | Galaxy | 0.63 / 2.33 / 14 | 23.24 | 43.21 | 0.42 | -0.61 | 0.09 | 0.58 | AGN2 | HEX |
| 13b | 1.31 | ||||||||||||
| 14 | 1.66 / 4.00 / 15 | 24.33 | 2.23 | ||||||||||
| 15 | 0.569ssSpectra from Szokoly et al. (2004) | 2.0 | 0.5830.018 | Galaxy | 0.59 / 2.00 / 15 | 22.98 | 43.12 | 0.56 | 0.00 | -0.52 | 1.77 | AGN1 | BLAGN |
| 16 | 1.097ssSpectra from Szokoly et al. (2004) | 2.0 | 0.8430.047 | Galaxy | 1.09 / 1.67 / 14 | 23.55 | 43.28 | 0.95 | -0.43 | 0.63 | -0.58 | AGN2 | LEX |
| 17 | 0.734ssSpectra from Szokoly et al. (2004) | 2.0 | 0.7590.012 | Galaxy | 0.77 / 1.00 / 17 | 23.95 | 41.96 | 0.81 | -1.67 | -0.58 | 1.92 | GALA | LEX |
| 18 | 1.04 / 3.67 / 17 | 24.01 | 3.25 | ||||||||||
| 19 | 0.9650.014 | Galaxy | 0.92 / 1.00 / 14 | 25.30 | 42.38 | 2.23 | -1.59 | (-0.12) bbHardness Ratio as given in Giacconi et al. (2002), calculated using the 0.5-2 and 2-10 keV bands | AGN2 | ||||
| 20 | 1.0490.150 | Galaxy | 1.07 / 1.33 / 13 | 24.01 | 1.49 | ||||||||
| 21 | 0.9650.014 | Galaxy | 0.92 / 1.00 / 14 | 25.39 | 42.38 | 2.32 | -1.59 | (-0.12) bbHardness Ratio as given in Giacconi et al. (2002), calculated using the 0.5-2 and 2-10 keV bands | AGN2 | ||||
| 22 | 0.229ssSpectra from Szokoly et al. (2004) | 2.0 | 0.2260.013 | Galaxy | 0.24 / 1.33 / 14 | 22.53 | 41.21 | 0.29 | -2.04 | -0.15 | 1.00 | UNCL | LEX/Sey2 |
| 23 | 0.524mmSpectra from Mignoli et al. (2005) | 2.0 | 0.4600.018 | Galaxy | 0.54 / 1.00 / 18 | 23.25 | 41.13 | 0.54 | -2.13 | UNCL | LEX | ||
| 24 | 1.54 / 2.00 / 12 | 24.05 | 2.03 | ||||||||||
| 25 | 3.96 | ||||||||||||
| 26 | 0.737ssSpectra from Szokoly et al. (2004) | 2.0 | 0.7360.015 | Galaxy | 0.74 / 2.00 / 18 | 23.33 | 41.72 | 0.54 | -1.92 | 1.40aaGeneric photon index due to low number of counts | UNCL | LEX/SF | |
| 27 | 0.123llSpectra from Le Fèvre et al. (2004) | 2.0 | 0.1200.010 | Galaxy | 0.18 / 2.00 / 15 | 21.52 | -0.06 | LEX | |||||
| 28 | 1.090ssSpectra from Szokoly et al. (2004) | 2.0 | 1.1430.065 | Galaxy | 1.01 / 1.33 / 14 | 23.64 | 42.46 | 0.82 | -1.49 | 0.69 | -0.76 | AGN2 | ABS |
| 29 | 0.734ssSpectra from Szokoly et al. (2004) | 2.0 | 0.7540.155 | QSO | 0.07 / 6.00 / 14 | 25.64 | 44.42 | 2.34 | 0.42 | -0.53 | 1.79 | QSO1 | BLAGN |
| 30 | 1.097vvSpectra from Vanzella et al. (2004) | 2.0 | 1.1190.039 | Galaxy | 1.06 / 2.00 / 18 | 23.63 | 41.58 | 0.89 | -1.83 | 0.33 | UNCL | HEX | |
| 31 | 0.247ccSpectra from Croom, Warren, & Glazebrook (2001) | 2.0 | 0.2400.030 | Galaxy | 0.47 / 1.33 / 18 | 22.22 | 0.16 | LEX | |||||
| 32 | 0.3910.012 | Galaxy | 0.45 / 1.33 / 9 | 22.85 | 0.29 | ||||||||
| 33 | 5.29 | ||||||||||||
| 34 | 0.738ssSpectra from Szokoly et al. (2004) | 2.0 | 0.7100.030 | Galaxy | 0.76 / 1.33 / 17 | 23.72 | 42.08 | 1.22 | -1.08 | -0.67 | 2.18 | AGN1 | LEX |
| 35 | 4.84 | ||||||||||||
| 36 | 0.076ssSpectra from Szokoly et al. (2004) | 2.0 | 0.0750.010 | Uncl. | 0.16 / 2.33 / 18 | 22.18 | 40.20 | 0.06 | -2.39 | -0.79 | 2.65 | GALA | LEX |
| 37 | 0.953vvSpectra from Vanzella et al. (2004) | 2.0 | 0.8110.022 | Galaxy | 1.01 / 2.33 / 18 | 23.67 | 41.72 | 0.90 | -1.63 | -0.40 | UNCL | LEX | |
| 38 | 0.076ssSpectra from Szokoly et al. (2004) | 2.0 | 0.0860.012 | Galaxy | 0.11 / 2.00 / 18 | 21.80 | 40.23 | -0.17 | -2.39 | -0.56 | 1.87 | GALA | LEX |
| 39 | 2.83 | ||||||||||||
| 40 | 2.94 | ||||||||||||
| 41a | 2.223ssSpectra from Szokoly et al. (2004) | 2.0 | 2.21 / 2.67 / 18 | 24.27 | 42.67 | 1.39 | -0.95 | 0.02 | 1.40aaGeneric photon index due to low number of counts | AGNX | HEX | ||
| 41b | 0.8410.055 | Galaxy | 0.78 / 5.33 / 17 | 23.28 | 1.46 | ||||||||
| 42 | 3.67 | UNCL | |||||||||||
| 43 | 3.54 | ||||||||||||
| 44 | 0.038ssSpectra from Szokoly et al. (2004) | 2.0 | 0.0580.006 | Galaxy | 0.28 / 1.33 / 15 | 21.01 | 39.72 | -0.79 | -3.49 | 0.31 | 0.17 | ULX | LEX |
| 45 | 2.80 | ||||||||||||
| 46 | 2.578ssSpectra from Szokoly et al. (2004) | 2.0 | 2.51 / 2.00 / 14 | 24.48 | 42.62 | 2.16 | -0.32 | 0.30 | 0.19 | AGN2 | HEX | ||
| 47a | 0.5280.031 | Galaxy | 0.67 / 2.00 / 15 | 22.89 | 0.87 | ||||||||
| 47b | 0.5280.031 | Galaxy | 0.67 / 2.00 / 15 | 22.89 | 0.74 | ||||||||
| 48a | 1.36 / 2.33 / 17 | 24.23 | 2.04 | ||||||||||
| 48b | 1.36 / 2.33 / 17 | 24.23 | 2.02 | ||||||||||
| 49 | 1.603ssSpectra from Szokoly et al. (2004) | 2.0 | 1.0150.127 | Galaxy | 1.76 / 1.67 / 14 | 24.10 | 44.30 | 1.82 | 1.31 | -0.51 | 1.75 | QSO1 | HEX |
| 50 | 0.5670.032 | Galaxy | 0.58 / 2.67 / 18 | 22.93 | 0.91 | ||||||||
| 51a | 0.6520.012 | Galaxy | 0.61 / 1.00 / 15 | 23.32 | 0.76 | ||||||||
| 51b | 0.6500.014 | Galaxy | 0.61 / 1.00 / 15 | 23.32 | 0.70 | ||||||||
| 52a | 3.064ssSpectra from Szokoly et al. (2004) | 2.0 | 1.17 / 2.33 / 13 | 24.61 | 43.83 | 2.08 | 0.81 | 0.18 | 0.42 | AGN2 | HEX | ||
| 52b | 1.4000.076 | Galaxy | 0.85 / 1.33 / 14 | 23.82 | 1.28 | ||||||||
| 53 | 0.625ssSpectra from Szokoly et al. (2004) | 0.5 | 1.81 / 2.00 / 11 | 23.18 | 42.76 | 2.52 | 0.93 | 0.40 | -0.02 | AGN2 | ABS | ||
| 54 | 1.63 / 2.67 / 14 | 24.00 | 1.88 | ||||||||||
| 55a | 0.279ssSpectra from Szokoly et al. (2004) | 1.0 | 0.2640.022 | Galaxy | 0.46 / 1.33 / 15 | 23.07 | 0.54 | ABS | |||||
| 55b | 0.279ssSpectra from Szokoly et al. (2004) | 2.0 | 0.2620.049 | Galaxy | 0.28 / 1.33 / 15 | 23.07 | 41.33 | 0.82 | -1.51 | -0.72 | 2.35 | GALA | HEX/Sey2 |
| 56 | 0.214ssSpectra from Szokoly et al. (2004) | 2.0 | 0.1870.031 | Galaxy | 0.37 / 2.33 / 16 | 22.14 | -0.15 | LEX | |||||
| 57 | 0.458ssSpectra from Szokoly et al. (2004) | 2.0 | 0.4670.008 | Galaxy | 0.45 / 2.33 / 15 | 22.94 | 41.38 | 0.12 | -2.14 | -0.09 | 1.40aaGeneric photon index due to low number of counts | UNCL | LEX |
| 58 | 4.06 | ||||||||||||
| 59 | 0.8330.054 | Galaxy | 1.40 / 1.67 / 11 | 23.37 | 1.80 | ||||||||
| 60a | 1.0650.106 | Galaxy | 1.25 / 3.67 / 15 | 23.62 | 1.76 | ||||||||
| 60b | 0.17 / 3.67 / 13 | 21.79 | 2.25 | ||||||||||
| 61 | 3.08 | ||||||||||||
| 62 | 1.117llSpectra from Le Fèvre et al. (2004) | 0.5 | 0.9870.105 | Galaxy | 1.06 / 1.00 / 9 | 23.76 | 1.80 | -0.56 | UNCL | ||||
| 63 | 0.8160.059 | Galaxy | 0.87 / 2.00 / 13 | 23.34 | 1.00 | ||||||||
| 64 | 0.45 / 2.00 / 10 | 22.74 | 42.05 | 2.40 | 1.01 | -0.55 | 1.81 | AGN1 | |||||