VIMOS-VLT and Spitzer observations of a radio galaxy at 2.5††thanks: Based on observations carried out at the European Southern Observatory, Chile (programs 073.B-0189, 065.P-0579 and 075.B-0729). and with the Spitzer Space Telescope.
Abstract
We present: 1) a kinematic and morphological study of the giant Ly nebula associated with the radio galaxy MRC 2104242 () based on integral field spectroscopic VIMOS data from VLT ; 2) a photometric study of the host (proto?) galaxy based on Spitzer Space Telescope data.
The galaxy appears to be embedded in a giant ( kpc) gas reservoir that surrounds it completely. The kinematic properties of the nebula suggest that it is a rotating structure, which would imply a lower limit to the dynamical mass of . An alternate scenario is that the gas is infalling. Such a process would be able to initiate and sustain significant central starburst activity, although it is likely to contribute with less than 10% of the total stellar mass of the galaxy.
The near- to mid-IR spectral energy distribution of the radio galaxy suggests the existence of a reddened, , evolved stellar population of age Gyr and mass . The implied formation redshift is . This stellar mass is similar to the stellar masses found for massive early-type galaxies at 2 in deep, near-infrared surveys.
keywords:
galaxies: active; galaxies: individual: MRC 2104242; galaxies: evolution1 Introduction
In a study based on long-slit, medium resolution (R700) Keck II/VLT spectroscopy of a sample of 10 ultra steep spectrum, high redshift () radio galaxies (HzRGs), we found that these objects are embedded in giant (often 100 kpc), low surface brightness halos of metal rich, ionized gas with quiescent kinematics (Villar-Martín et al. 2003 [VM03]). By quiescent we mean that the kinematics do not appear to be perturbed by interactions between the radio and optical structures. The halos usually extend well beyond the brighter, perturbed regions and sometimes beyond the radio structures. We proposed that the quiescent halos are the gas reservoirs from which the galaxies started to form and might still be forming. At some point, an active nucleus switches on and the halo becomes observable thanks to strong line emission powered by the ionizing continuum.
Our work was seriously limited by the lack of spatial information in directions other than the radio axis, through which the long slits were aligned. For this reason, we are carrying out a programme of 3D integral field spectroscopy to characterize the morphological, kinematic and ionization properties in two spatial dimensions of the extended ionized gas in a sample of powerful radio galaxies at 2-3.
In this letter, we present the results obtained for the radio galaxy MRC 2104242 at 2.49 (McCarthy et al. 1990). The radio source has an angular extent of 24 (200 kpc). The WFPC2 and NICMOS HST images (Pentericci et al. 2001) show that the host galaxy is very clumpy. A filamentary component more than 2” long is found aligned with the radio axis to within a few degrees. This region is likely to be undergoing a strong interaction between the radio and optical structures (VM03, Humphrey et al. 2005).
The existence of an evolved stellar population in HzRGs has been subject of intensive study for the last two decades. The UV and optical restframe spectroscopic studies have only marginally detected the continuum, which may still contain significant non-stellar contribution (Vernet et al. 2001). To detect the old stellar population we need to observe at rest-frame near-IR wavelengths. This is one of the scientific goals of the Cycle 1 Spitzer survey of 70 high redshift radio galaxies (P.I. Stern, program ID 3329). We present results for MRC 2104242 in this paper.
A 0.73, = 0.27 and = 71 km Mpc-1 cosmology is adopted in this paper.
2 Observations and data reduction
The spectroscopic observations were made on UT 2004 June 17 (ESO programme 073.B-0189(A)) using the VIsible MultiObject Spectrograph (VIMOS, Le Févre et al. 2003), on the Nasmyth focus of the UT3 VLT unit. The instrument is equipped with an integral field unit made of 1600 microlenses coupled to fibres, covering 27″x 27″on the sky with 0.67” diameter fibres for the high spectral resolution mode. The HRblue grating was used, with an effective wavelength range 4150-6200 Å and an instrumental profile 3.00.5 Å. The total integration time was 4.5 hr (91800 sec). The seeing FWHM during the observations was in the range 1.0-1.4.
The data were reduced using a modified version of P3d (Becker 2002), in addition to our own software optimized for VIMOS data (Sánchez & Cardiel 2005). The data were bias subtracted. The expected locations of the spectra were traced on a continuum-lamp exposure obtained before each target exposure. The fibre-to-fibre response at each wavelength was determined from a continuum-lamp exposure. Wavelength calibration was performed using arc lamp spectra and the telluric emission lines in the science data. After these basic reduction steps, a data cube was created for each exposure. The cubes were then recentred spatially by determining the centroid of a nearby star at each wavelength. This recentering corrects for differential atmospheric refraction. The cubes were then combined using IRAF tasks, masking the broken and/or low sensitivity fibres. A 3 clipping algorithm removed cosmic rays. The sky background spectrum was estimated before subtraction by averaging spectra of object free areas of the data cube. The flux calibration was done using the long slit FORS-VLT spectrum discussed in VM03. Cross-talk effects were found to be negligible. These were evaluated using the field star in the VIMOS field of view. The fibre to fibre contamination was found to be 5% for adjacent spectra in the CCD, dropping to less than 0.1% for the 3rd adjacent spectra.
To overlay the radio core position (Carilli et al. 1997) on the Ly image, we used the NICMOS HST image, where the radio core was assumed to coincide with the IR peak. This is probably not the case if the nucleus is heavily reddened. The NICMOS peak position in the Ly image was then calculated using a bright star that is present in both images. The 1 uncertainty in the Ly-radio registration is 0.3”.
Details about the observations and data reduction for the Spitzer data will be presented by Seymour et al. (in prep.). Briefly, for MRC 2104242, we obtained 3.6, 4.5, 5.8 and 8.0 m images on UT 2004 October 27 using the InfraRed Array Camera (Fazio et al. 2004), and a 16 m image in “peak-up only mode” on UT 2004 October 21 with the InfraRed Spectrograph (Houck et al. 2004). The IRAC “basic calibrated data” exposures were mosaiced using the MOPEX software package (http://ssc.spitzer.caltech.edu/postbcd/) with the pixels being resampled by a factor of 2. We used SEXTRACTOR (Bertin & Arnouts 1996) to measure the photometry in a matched 7″ aperture defined by the 3.6 m image. To obtain total magnitudes, we applied aperture corrections from in flight point spread functions (Lacy et al. 2005).
3 Results
A Ly image (Fig. 1) was created by adding all the frames in the spectral direction of the data cube across the Ly emission line spectral profile, covering the 4225-4260 Å spectral range. The large equivalent width of the line in all positions where it is detected ensures that the contamination by continuum emission is negligible everywhere across the image. Fig. 1 shows two spatial components (SW and NE) separated by 6 arcsec as previously described by McCarthy et al. (1990). The radio core is located between the two clumps, where Ly presents a minimum. Similar Ly morphologies have been observed in other HzRGs (e.g. Reuland et al. 2003). The SW component overlaps partially with the filamentary structure described in §1.
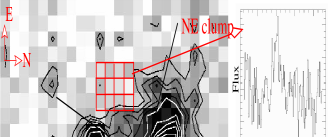
Low surface brightness Ly emission is detected in regions that seem to be outside any plausible ionization cones. Two spectra were extracted from the two intercone regions shown in Fig.1, where we have assumed a typical cone opening angle of 90 and the position of the cone vertex coinciding with the radio core. Ly, although noisy, is clearly detected in the two intercone regions. Any rotation of the axis or reasonable shift of the vertex position leads to some of the high surface brightness emission lying outside the ionization cones. McCarthy et al. (1990) mentioned the detection of a diffuse Ly halo that surrounds the entire object. If the gas is ionized (but see Villar-Martín, Binette & Fosbury 1996), the ionization mechanism is an open question. Hot young stars and cooling radiation are two interesting possibilities.
3.1 Ly kinematics
Our goal is to map the 2D kinematic field of the quiescent gas (i.e. non perturbed by jet-induced shocks) and use it as a source of information about its origin and the formation process of the galaxy. If the gas motions are gravitational, we can constrain the dynamical mass of the system. Because of the high sensitivity of Ly to absorption by HI, it is often an unreliable kinematic tracer. Given the low S/N of the data, we cannot use other reliable tracers, such as the HeII1640 line. Instead, we have compared the integral field results here with our earlier kinematic study (VM03) based on FORS2-VLT moderate resolution (6 Å) long slit spectroscopy, which made use of both Ly and HeII.
We show in Fig. 2 the 1-dimensional VIMOS spectra of the SW and NE clumps using two apertures (see Fig.1) matching as much as possible apertures 4 and 3 of VM03. Ly in the SW clump is split into two components (blue (SWB) and red (SWR)), both of which are well represented by Gaussian profiles. The line FWHM are 47020 and 55020 km s-1 respectively. They are separated by 82020 km s-1. The line in the NE component is well represented by a Gaussian profile of FWHM 63020 km s-1 redshifted by 25010 km s-1 relative to the SWR component. These results are in good agreement with those obtained with the FORS2-VLT data. In particular, the HeII line in the VM03 long-slit spectrum of the SW clump shows the same split as seen in the current VIMOS Ly profile. Since the HeII line is much less susceptible to absorption, this implies that the double structure is due to kinematics rather than absorption.

We argue that the red Ly component from the SW clump (SWR) and the Ly emission from the NE clump are emitted by quiescent gas. The remarkable similarity in the kinematic properties (see below) of these two components strongly suggest that the gas in both regions follows a similar kinematic pattern with the same origin. On the other hand, the sharp and large velocity shift of the SWB component suggests that this is a different, decoupled kinematic component. Although detected almost all over the SW clump, this component is strongest relative to the SWR component in pixels adjacent and coincident with the filamentary structure (§1), where strong evidence for jet-gas interactions exist (Humphrey et al. 2005), suggesting that it is emitted by perturbed gas.
We find that the Ly profile of the quiescent gas is not strongly distorted by absorption. VM03 found that in general, although the kinematic measurements (FWHM and velocity shifts) for Ly and HeII can be rather different for the perturbed gas (usually broad lines), they are are in good agreement within the errors for the quiescent gas. This is also the case for MRC 2104242 (see fig.7, VM03). Therefore, the quiescent Ly emission is less affected by absorption, probably due to the narrowness of the lines.
In summary, the Ly emission from the quiescent gas (components NE and SWR) can be isolated in MRC 2104242 at each spatial location and it can be used as a reliable kinematic tracer.
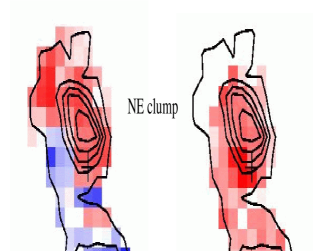
We now analyse the velocity field of the quiescent gas. The Ly profile was fit at each spatial pixel with Gaussian profiles. The results are shown in Fig. 3 (left) with the intensity contours of the quiescent gas overplotted. The errors are 30 km s-1 for most pixels. The velocity dispersion map (corrected for instrumental broadening) is also shown (Fig. 3, right). The error is estimated to be 60 km s-1.
The kinematic pattern is rather symmetric and apparently ordered. The overall velocity field is very suggestive of a rotating structure, for which the half amplitude of the rotation curve is 150 km s-1. The map is quite featureless with 200-280 km s-1 for most spatial positions, with little noticeable difference between the two clumps other than a slight broadening of the line near the radio core. If the active nucleus coincides with the dynamical center of the system, this line broadening further supports rotation.
3.2 Spitzer data
Table 2 presents the Spitzer photometry for MRC 2104242, as well as near-infrared photometry from ground-based (,) ISAAC-VLT (ESO programme 075.B-0729(B)) and HST (F160W) images. We have corrected the near infrared photometry for emission line contamination using archival VLT/ISAAC spectroscopy (ESO programme 65.P-0579(A)). We determine the contributions to be 155%, 765%, and 515% to the total flux in , and , respectively.
Fig. 4 plots the near- to mid-IR spectral energy distribution (SED). The SED shows a clear rise between the and IRAC 3.6 m bands, and again between 8.0 and 16 m. We now argue that the 3.6 to 5.8 m points are dominated by an old stellar population. Figure 4 shows that the upturn in the SED between 8.0 and 16 m (see Table 2) is unlikely to be explained by a stellar population; the 16 m point is most likely dominated by warm dust emission associated with the active nucleus. We assume the 16 m point can be fit with a simple power law of slope (Fig. 4), as determined from a sample of 12 radio galaxies with Spitzer 16 and 24 m data (Seymour et al., in prep.). Scaling this power-law to the 16 m point implies that we can safely ignore any thermal dust emission at m. This is further supported by the 8.0 m upper limit.
Similarly, the points allow us to constrain the combined contributions due to scattered quasar light, nebular continuum and young stellar populations. These contributions all have a blue slope, while we detect a clear rise in the SED between 2.2 and 3.6 m. We can therefore constrain these combined contributions to 5% in the IRAC bands. Note that the excess of the band flux over the model predictions (Fig. 4) and over the band measurement can only be explained by such contributions, since any old stellar population would be fainter in J than in H (especially when we invoke reddening). Hence our strongest constraint comes from the band detection. Based on restframe near-infrared spectroscopy of low-redshift active galaxies (e.g. Sosa-Brito et al. 2001), we expect emission line contributions to the IRAC bands to be 5%.
We now use the thru 8.0 m SED of MRC 2104242 to derive the most probable stellar mass of the host galaxy (see, e.g., Yan et al. 2005 for a detailed discussion on uncertainties). The -band point is omitted as it appears to be contaminated by light associated with either the buried AGN or a young stellar population, and the 16 m point is ignored as its likely non-stellar in origin. We systematically compare the observed SED with a set of templates computed with PÉGASE.2 models (Fioc & Rocca-Volmerange 1997) via a minimization technique. Star formation histories (SFHs), ages, masses and dust extinction are free parameters. We model simple stellar populations of different metallicities using a Salpeter (1955) IMF with a lower mass limit of and an upper mass limit of . We adopt SFHs that have been shown to consistently reproduce observations of passively-evolving, early-type galaxies (Fioc & Rocca-Volmerange 1999). A more detailed description of the fitting method will be presented in Rettura et al. (2005, in prep.).
| FWHM | |||
|---|---|---|---|
| Band | (m) | (m) | (Jy) |
| 1.2 | 0.16 | 4.11.5 | |
| F160W | 1.6 | 0.43 | 1.71.2 |
| 2.2 | 0.27 | 4.81.8 | |
| 3.6m | 3.6 | 0.7 | 273 |
| 4.5m | 4.5 | 0.99 | 293 |
| 5.8m | 5.7 | 0.90 | 327 |
| 8.0m | 8.0 | 2.8 | 35 |
| 16.0m | 16.0 | 6.0 | 7218 |

Results of the best-fit model are shown in Fig. 4. We estimate the errors for the mass by sampling the full probability distribution in the multidimensional parameter space. We find a best-fit stellar mass estimate of and a color excess . This is similar to the stellar masses found for the most massive, early-type galaxies at 2 in deep, infrared surveys (e.g. Daddi et al. 2004, Labbé et al. 2005). The best-fit age is 2.5 Gyr, which is very close to the age of the universe at the source redshift, (2.7 Gyr). The minimum age that still provides a reasonable () fit is 1.8 Gyr, implying a formation redshift . Finally, we note that the SED cannot be fit by any simple or composite stellar population without invoking substantial reddening.
4 Discussion and Conclusions
Let us assume that the giant Ly nebula in MRC 2104242 is supported by rotation. If its morphology maps the true gas distribution and the gas is settled on a disk, we derive an inclination angle relative to the plane of the sky and a dynamical mass within a radius of 7 arcsec ( kpc). This is similar to the stellar mass inferred from the Spitzer data (see §3.2), suggesting a surprisingly small dark matter fraction. However, the derived dynamical mass is likely to be a lower limit, since the gas is expected to be anisotropically illuminated by the hidden quasar. Therefore, the disk inclination and the direction of the major axis cannot be determined (e.g., the gas we see might be close to the minor axis).
If the giant halo in MRC 2104242 is settled on to a well defined disk, then , such that must be km s-1 and . On the other hand, it takes several rotation periods for gas to settle into a disk. If this is the case for the giant nebula in MRC 2104242 and we assume a minimum of three rotation periods () for a well-ordered disk, the 2.7 Gyr age of the universe at requires 400 km s-1 for which . Smaller would imply that the gas has not yet settled into a stable structure.
It is possible that the SW and NE clumps are two different objects rotating around a common center (e.g. De Breuck et al. 2005). However the fact that Ly emission surrounds the object completely suggests that it is a single, rotating structure. If the gas is rotating, this means that giant ( kpc) gaseous, rotating structures (disks?) can exist already at . These could be the progenitors of the giant (several tens of kpc) rotating disks discovered around several low redshift radio galaxies and early-type galaxies (e.g. Morganti et al. 2002). High redshift cooling flow models for galaxy formation (e.g. Haiman, Spaans & Quataert 2000) predict the formation of a giant, rotationally-supported disk as part of the process in less than 1 Gyr. Therefore, the evolved ( Gyr old), stellar population revealed by the Spitzer data probably formed well before the disk.
Alternatively, the general pattern of the velocity field is also suggestive of radial motions. The radio properties can discriminate between inflow and outflow. The NE radio lobe is brighter and more polarized (Pentericci et al. 2000). According to the Laing-Garrington effect (Laing 1988), this lobe is closer to the observer. Since the gas located at this side of the nucleus is the most redshifted, it must be infalling. The collapse of such a giant structure suggests that we are witnessing an early stage in the formation process of the central galaxy (e.g. Haiman, Spaans & Quataert 2000).
Let us assume an infall velocity of km s-1 and a radius kpc, where is the angle between the ionized cone axis and the line of sight. Since this is a narrow-line radio galaxy, is expected to be large, . Therefore, after yr, the 60 kpc halo should collapse and disappear in a very small redshift interval (by ). The existence of giant, quiescent halos in radio galaxies at very different redshifts (van Ojik et al. 1996, Villar-Martín et al. 2005) suggests that they are long-lived structures, unless there are multiple episodes of Ly halos. The implication is that much larger reservoirs of invisible gas must exist and/or some mechanism must deccelerate the infall process at some point (Iono et al. 2004).
As in VM03 and using the geometrical information provided by the VIMOS Ly image, we estimate an ionized gas density cm-3 (see VM03 for uncertainties on this calculation) and a gaseous mass (neutral and ionized) within 60 kpc of . A mass deposition rate in the range yr-1 is inferred. This infall rate might be able to initiate and sustain central starburst activity at several tens of yr-1 (Iono et al. 2004). Since the object contains a Gyr old population as well as the young population triggered by the current inflow, at least two episodes of star formation are inferred for the formation of this massive galaxy. If the halo has 1010 , this is probably the maximum it will contribute to build up the stellar mass of the galaxy, so that the infalling gas will only be 10% of the galaxy mass.
In summary, MRC 2104242 contains an evolved stellar population that formed at . The kinematic properties of the extended gas suggest that it is associated with a giant rotating structure, the remnant of the formation process of the galaxy. Alternatively, the gas might be infalling during an early phase in the galaxy formation process. Extending a similar study to a larger sample of objects will be very useful to understand the demographics and nature of ordered kinematics in the quiescent gas associated with HzRGs.
Acknowledgments
We gratefully acknowledge the SHzRG team who have provided the Spitzer data presented here. The work of MVM has been supported by the Spanish Ministerio de Educación y Ciencia and the Junta de Andalucía through the grants AYA2004-02703 and TIC-114 respectively. The work of DS was carried out at Jet Propulsion Laboratory, California Institute of Technology, under a contract with NASA.
References
- (1) Becker T. 2002, PhD Thesis, Univ. of Potsdam, Germany
- Bertin & Arnouts (1996) Bertin E. & Arnouts S. 1996,A&ASS , 117, 393
- (3) Carilli C., Röttgering H., van Ojik R., Miley G., van Breugel W., 1997, ApJS, 109, 1
- (4) Daddi E., Cimatti A., Renzini A. et al., 2004, ApJL, 600, 127
- (5) De Breuck C., Downes D., Neri R. et al. 2005, A&A,430, 1
- Fazio et al. (2004) Fazio G., Hora J. L., Allen L. E., et al. 2004, ApJS, 154, 10
- (7) Fioc M., Rocca-Volmerange B., 1997, A&A, 351, 869
- (8) Fioc M., Rocca-Volmerange B., 1999, A&A, 326, 950
- (9) Haiman Z., Spaans M., Quataert E., 2000, ApJL, 537, 5
- Houck et al. (2004) Houck J., Roellig T., van Cleve J. et al. 2004, ApJS, 154, 18
- (11) Humphrey A., Villar-Martín M., Fosbury R. et al. 2005, MNRAS, submitted
- (12) Iono D., Yun M., Mihos J., 2004, ApJ, 616, 199
- (13) Lacy M., Wilson G., Masci F. et al., 2005, ApJS, in press (astro-ph/0507143)
- (14) Labbé I., Huang J., Martin F. et al., 2005, ApJL, 624, 81
- (15) Laing R.Añ, 1988, Nature, 331, 149
- (16) Le Févre O., Saisse M., Mancini D. et al., eds., Proc. of the SPIE, 4841, p. 1670
- (17) McCarthy P., Kapahi V., van Breugel W., Subrahmanya C., 1990, AJ, 100, 1014
- (18) Morganti R., Oosterloo S., Tinti S. et al., 2002, A&A, 287, 830
- (19) Pentericci L., McCarthy P., Röttgering H. et al., 2000, ApJS, 135, 63
- (20) Pentericci L., McCarthy P., Röttgering H. et al., 2001, ApJS, 135, 63
- (21) Reuland M., van Breugel W., Röttgering H. et al., 2003, ApJ, 592, 755
- (22) Salpeter, E., 1955, ApJ, 121, 161
- (23) Sánchez S.F., Cardiel N., 2005, Calar Alto Newsletter, n.10
- (24) Sosa-Brito R., Tacconi-Garman L., Lehnert M., Gallimore J., 2001, ApJSS, 136, 61
- (25) Vernet J., Fosbury R., Villar-Martín M. et al. 2001, A&A, 366, 7
- (26) Villar-Martín M., Binette L., Fosbury R.,1996, A&A, 312, 751
- (27) Villar-Martín M., Vernet J., di Serego Alighieri S. et al., 2003, MNRAS, 346, 273 [VM03]
- (28) Villar-Martín M., Tadhunter C., Morganti R., Holt J., 2005, MNRAS Letters, 359, 5
- (29) Yan H., Dickinson M., Stern D., et al., 2005, ApJ, in press (astro-ph/0507673)