A ZZ Ceti white dwarf in SDSS J133941.11+484727.5
Abstract
We present time-resolved spectroscopy and photometry of the cataclysmic variable (CV) SDSS J133941.11+484727.5 (SDSS 1339) which has been discovered in the Sloan Digital Sky Survey Data Release 4. The orbital period determined from radial velocity studies is 82.524(24) min, close to the observed period minimum. The optical spectrum of SDSS 1339 is dominated to 90% by emission from the white dwarf. The spectrum can be successfully reproduced by a three-component model (white dwarf, disc, secondary) with K for a fixed , pc, and a spectral type of the secondary later than M8. The mass transfer rate corresponding to the optical luminosity of the accretion disc is very low, . Optical photometry reveals a coherent variability at 641 s with an amplitude of 0.025 mag, which we interpret as non-radial pulsations of the white dwarf. In addition, a long-period photometric variation with a period of either 320 min or 344 min and an amplitude of 0.025 mag is detected, which bears no apparent relation with the orbital period of the system. Similar long-period photometric signals have been found in the CVs SDSS J123813.73–033933.0, SDSS J204817.85–061044.8, GW Lib and FS Aur, but so far no working model for this behaviour is available.
keywords:
Stars: individual: SDSS J133941.11+484727.5 – novae, cataclysmic variables – stars: oscillations – white dwarfs1 Introduction
A major impact of the Sloan Digital Sky Survey (SDSS) on the study of cataclysmic variables (CVs) has been the discovery of more than 20 systems (by Data Release 4) in which the optical spectrum is dominated by the white dwarf and there is no spectral signature of the donor star (Szkody et al., 2002b, 2003, 2004, 2005). These characteristics strongly suggest that those CVs have very low mass transfer rates, low mass donors, and presumably very short orbital periods. Hence, these systems resemble the old, evolved CVs predicted by population models to exist in vast numbers near the orbital period minimum (Kolb, 1993; Howell et al., 1997). Whether or not their number agrees with the theoretical models remains to be determined as their orbital periods need to be measured, along with estimates of their distances and mass transfer rates.
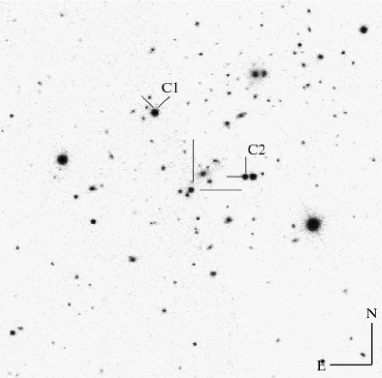
SDSS J133941.11+484727.5 (henceforth SDSS 1339, Fig. 1), a CV discovered in Data Release 4 (Szkody et al., 2005), is characterised by a very strong contribution of the white dwarf in the optical spectrum, and a clear absence of the TiO absorption bands typical of a late-type main-sequence donor star in the red part of the spectrum. Here we report detailed spectroscopic and photometric follow-up observations of SDSS 1339, which confirm a short orbital period, a very low mass transfer rate, and identify a pulsating ZZ Ceti-type white dwarf in this CV.
2 Observations
In 2004, the International Time Programme of the night-time telescopes at the European Northern Observatory has been awarded for the study of CVs identified in the SDSS, with the aim of improving our understanding of compact binary evolution. The observations of SDSS 1339 were carried out as part of this project.
2.1 Spectroscopy
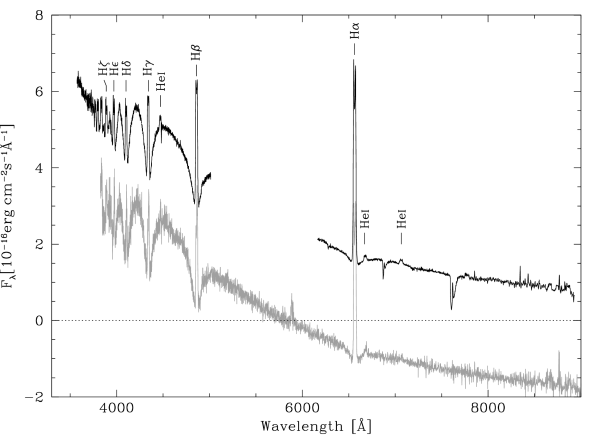
Time-resolved spectroscopy of SDSS 1339 was obtained in January 2005 at the 4 m William Herschel Telescope (WHT) on La Palma (Table 1). The double-arm spectrograph ISIS was used equipped with the R600B grating and a 4k2k pixel EEV detector in the blue arm and the R316R grating and a 4.5k2k pixel Marconi detector in the red arm. A 1.2″slit was used on both arms, providing a spectral resolution of Å covering the ranges Å and Å. The target exposures were interleaved with arc lamp and flat-field exposures to correct the wavelength scale for instrument flexure and to remove CCD fringing in the red arm. Spectra of the spectroscopic standard star Feige 34 were obtained on each night immediately after the observations of SDSS 1339. The standard reduction of the spectra, consisting of de-biasing, flat-fielding, optimal extraction and wavelength and flux calibration, was carried out using Figaro within the STARLINK suite and the Pamela/Molly packages. The average of the blue and red spectra (Fig. 2) is qualitatively similar to the SDSS spectrum (Szkody et al., 2005), clearly dominated by the broad Balmer absorption lines from the white dwarf photosphere. No noticeable signature of the companion star is detected in the red end of the spectrum. The Balmer emission lines are double-peaked, as typically observed in the quiescent spectra of short-period dwarf novae with moderate orbital inclinations. The emission lines of He I are very weak.
| Date | UT | Obs | Filter/Grism | Exp.(s) | Frames |
|---|---|---|---|---|---|
| 2005 Jan 02 | 06:04 – 06:58 | WHT | R600B/R316R | 600 | 6 |
| 2005 Jan 04 | 04:00 – 06:54 | WHT | R600B/R316R | 400 | 25 |
| 2005 Jan 05 | 04:08 – 07:10 | WHT | R600B/R316R | 400 | 26 |
| 2005 Jan 06 | 05:39 – 06:51 | WHT | R600B/R316R | 400 | 6 |
| 2005 Jan 07 | 04:40 – 06:59 | WHT | R600B/R316R | 400 | 20 |
| 2005 Apr 04 | 19:36 – 00:24 | KY | Clear | 70 | 215 |
| 2005 Apr 07 | 21:31 – 03:03 | KY | Clear | 70 | 250 |
| 2005 Apr 29 | 21:45 – 01:43 | TNG | 20 | 432 |
2.2 Photometry
Filterless CCD photometric time-series of SDSS 1339 were obtained in April 2005 at the 1.2 m Kryoneri telescope using a Photometrics SI-502 pixel camera (Table 1). The object images were corrected for bias, dark current and flat field structures within MIDAS. Subsequently, the Sextractor package (Bertin & Arnouts, 1996) was used to perform aperture photometry on the processed images. The differential light curves of SDSS 1339 were computed relative to the comparison star ‘C1’ (), and a second comparison star ‘C2’ () was used to verify that ‘C1’ is not variable and to monitor changes in the observing conditions. The Kryoneri light curves (Fig. 3, top panel) gave some evidence for short-term variability, and power spectra computed from both nights contained a signal near 135 ( min). Prompted by this discovery, we obtained additional -band CCD photometry at the 3.6 m Telescopio Nazionale Galileo (TNG) using DOLORES equipped with a Loral pixel CCD. The CCD was binned and windowed in order to reduce the readout time. The TNG data were reduced in the same manner as described above, and the light curve (Fig. 3, lower panel) clearly confirms the presence of photometric variability at a period of min.

3 System Parameters
3.1 The orbital period
In order to determine the orbital period of SDSS 1339 from a radial velocity study, we applied heliocentric corrections to all spectra and binned them onto a homogeneous wavelength scale. The radial velocity variation of the emission line wings were then measured using the double-Gaussian convolution technique described by Schneider & Young (1980) with a full width at half maximum of the individual Gaussians of 200 and a separation of 1500 . The strongest signal in the Scargle (1982) periodogram computed from the radial velocity data (Fig. 4) is detected at a period of 82.524(24) min, where the error has been determined by fitting a sine wave to the radial velocity data. A fake data set constructed from a sine wave sampled at the same times of the observations, with a period of 82.524 min, and amplitude and error distribution similar to the observed radial velocities results in a nearly identical periodogram, confirming that the relatively complex structure of the periodogram is due to the temporal sampling of our spectroscopic data. We interpret this period as the orbital period of SDSS 1339. Folding the radial velocity measurements over the orbital period produces a quasi-sinusoidal curve. A sine fit gives an amplitude of and a -velocity of (Fig. 5). We determine the orbital ephemeris
| (1) |
from the sine fit to the radial velocity measurements, where is the time of inferior conjunction of the secondary star if the radial velocity variation of the line wings traces the motion of the white dwarf. We caution, however, this interpretation, as the signal in the line wings is likely to be contaminated to some extent by the bright spot where the mass transfer stream from the secondary impacts the accretion disc. The same method was applied to the emission lines of and , and resulted in consistent values for , though with larger errors as a consequence of the lower signal-to-noise ratio and the larger disturbance due to the white dwarf absorption lines in these lines compared to (Fig. 4). Sine-fits to the radial velocities of and give amplitudes of and , respectively and -velocities of and , respectively.
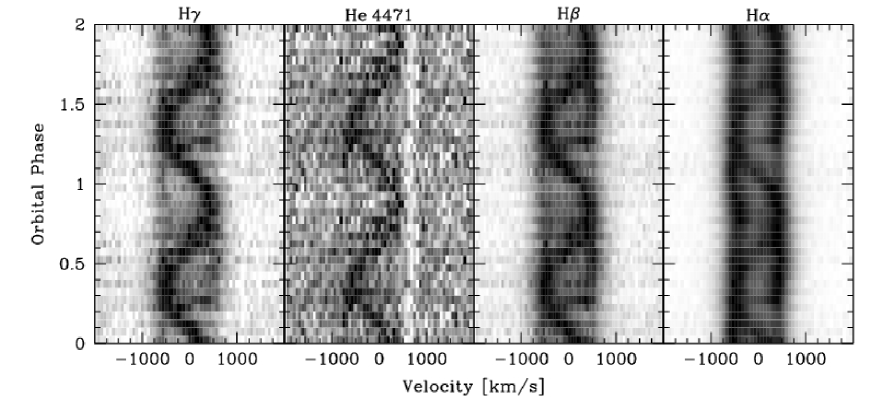
Figure 6 shows trailed spectrograms for , He I 4471, , and folded on 20 phase bins, using our ephemeris. The double-peaked profiles of , and are apparent, with a half-separation of . There is a prominent S-wave whose semi-amplitude is consistent with this value, indicating an origin in the outer edge of the disc, very likely the bright spot. The half-separation of the double-peaked profiles together with the absence of eclipses in the light curves suggest an intermediate inclination. The absence of a photometric modulation that could be ascribed to the bright spot suggests that the bright spot contributes primarily in the Balmer emission lines. From the trailed spectra, it appears that the relative contribution of the bright spot increases for the higher members of the Balmer series, implying a stronger Balmer decrement in the disc compared to the bright spot.


3.2 Additional system parameters
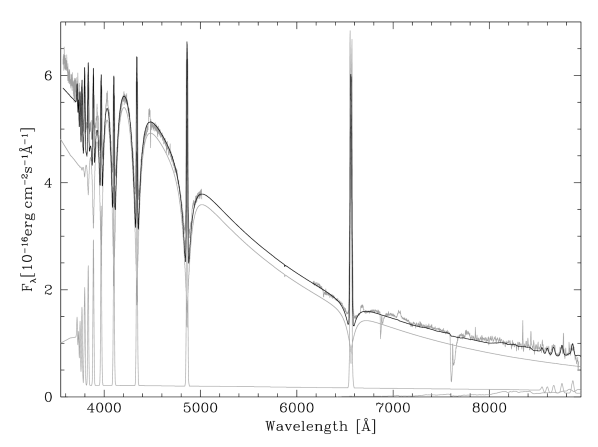
We have modelled the average WHT spectrum of SDSS 1339 as the sum of three individual components: the white dwarf, the accretion disc, and the donor star. The white dwarf is represented by synthetic spectra computed with Hubeny & Lanz (1995)’s TLUSTY/SYNSPEC codes. We generated a grid of pure-hydrogen models covering the range 8000 K–20 000 K with the surface gravity fixed to ( ). For the white dwarf radius, we assume cm following the Hamada & Salpeter (1961) mass-radius relation for zero-temperature carbon-oxygen white dwarfs. The accretion disc is represented by the emission of an isothermal and isobaric hydrogen slab, following the description by Gänsicke et al. (1997, 1999). The secondary star is represented by observed templates covering M0.5 to M9 from Beuermann et al. (1998) and L0 to L8 from Kirkpatrick et al. (1999) and Kirkpatrick et al. (2000). We fix the radius of the secondary star to cm, corresponding to a donor star at the low-mass end of the main sequence (the Roche-lobe radius of the secondary for this choice of at the given orbital period). obviously depends on the choice of (and fairly little on , which was fixed to 0.6 , as stated above), but given that the spectral type-mass relation for CV donors at such low masses is undetermined we consider this a justified simplification.
Our approach is a forward-modelling rather than a fitting, and proceeds as follows. Free parameters are the white dwarf temperature , the distance to SDSS 1339, the temperature and column density of the disc, and the spectral type of the secondary star Sp(2). As a first step, the disc spectrum for a given choice of (, ) is normalised to the observed flux of . The second step consists of choosing and adjusting the flux scaling factor of the model spectrum in a way that the sum of disc plus white dwarf fits the observed flux level in the spectrum from the blue arm. At this stage, the distance is determined by the knowledge of and the flux scaling factor, and the spectrum of a secondary star of spectral type Sp(2) is added to the model, scaled appropriately for and . This procedure is optimised until (a) the white dwarf model adequately reproduces the observed Balmer absorption lines, (b) the disc emission reproduces the observed emission line flux ratios, (c) the flux contribution from the secondary is sufficiently low to be consistent with the non-detection of molecular absorption bands in the red arm spectrum, and (d) the overall slope of the observed continuum is reproduced. The best-matching set of parameters is found to be K, K, , pc, and Sp(2) later than M8. The luminosity of the accretion disc is , less than 10% of the white dwarf luminosity. For an assumed white dwarf mass of 0.6 , this luminosity corresponds to to an accretion rate of . A caveat to white dwarf temperature and distance determination is the unknown mass of the primary. Masses of single white dwarfs (e.g. Koester et al., 1979; Bergeron et al., 1992; Liebert et al., 2005) are predominantly clustered sharply around . The standard method used for single white dwarfs, modelling the Balmer absorption lines, is not available for CV white dwarfs due to contamination by the accretion disc/stream and the secondary star, and white dwarf mass estimates have to be determined from radial velocity studies, eclipse timing, or ultraviolet spectral modelling. Consequently, the number of CVs with undisputed mass measurements is very small. The secular evolution of CV white dwarf masses depends on the ratio of accreted material to material ejected during classical novae eruptions, and the exact details are not very well established (Yaron et al., 2005). In the light of the uncertain mass of the white dwarf in SDSS 1339, we have therefore repeated the above analysis assuming a white dwarf mass higher (lower) by 0.3 and find a white dwarf effective temperature higher (lower) by K and a distance lower (larger) by pc.
If we assume that the disc emission is all what there is in terms of accretion luminosity, the implied accretion rate is very low, in fact, much lower than mass transfer rates predicted from angular momentum loss via gravitational radiation, for a 0.6 white dwarf. Some additional accretion luminosity may be released in X-rays. The ROSAT All Sky Survey (Voges et al., 2000) contains a faint source, 1RXS J133941.9+484844, with , that within its large positional uncertainty (77.4″) coincides with SDSS 1339. A pointed observation of that region led to the detection of 2RXP J133938.5+484722, with . No error on the position and count rate are given in the The Second ROSAT Source Catalog of Pointed Observations. It is possible that both X-ray sources are identical, and that SDSS 1339 is the optical counterpart. If the X-rays detected by ROSAT are indeed associated with SDSS 1339, the observed PSPC count rate corresponds to an unabsorbed bolometric flux of of , assuming a thermal Bremsstrahlung spectrum with keV, as typically observed in short-period CVs, and a neutral hydrogen column density of . For pc, the implied X-ray luminosity would be , very similar to the optical accretion luminosity derived above, and comparable to the X-ray emission of the well-studied minimum period CV WZ Sge (Mukai & Patterson, 2004). A deeper X-ray observations is clearly desirable to test whether SDSS 1339 is the source of the X-rays detected by ROSAT.
In summary, in SDSS 1339 the accretion disc contributes less than 10% of the optical light, which is very low compared to other short-period CVs, and may have an X-ray flux comparable to that of WZ Sge, suggesting a very low accretion rate. A low mass transfer rate from the secondary is also supported by the absence of the signature from a bright spot in the light curve (Fig. 3, see also Fig. 8). The current data suggest that the mass transfer from the secondary is lower than that predicted by gravitational radiation. Following Townsley & Bildsten (2003), the white dwarf temperature can be used as an estimate of the secular mean of the accretion rate, and it appears that the white dwarf in SDSS 1339 is not unusually cold compared to other CVs near the orbital minimum. In fact, its temperature is well in line with the predictions for from gravitational radiation. A possible solution to the discrepancy between the accretion rate estimated from the optical emission of the accretion disc (and the possible X-ray component) is that the system is currently accreting below its secular mean rate.
4 A ZZ Ceti-type white dwarf
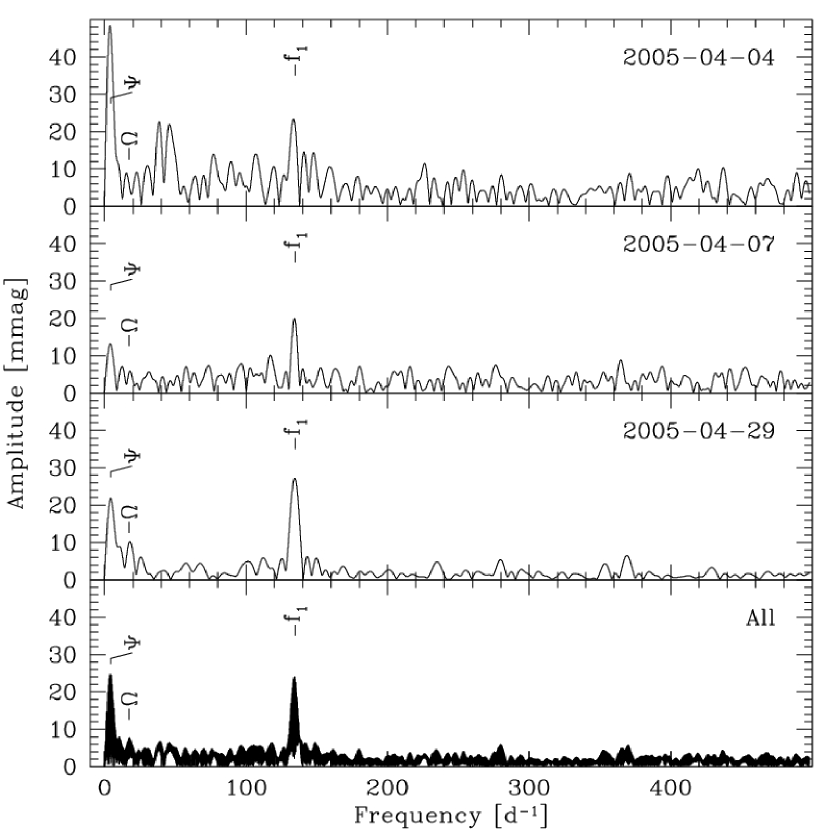
The power spectra computed from the Kryoneri and TNG photometric data consistently contain a strong signal at 134.61 (Fig. 8). Given the estimated temperature of the white dwarf, the most obvious explanation for this signal are non-radial pulsations with a period of s. The amplitude of the pulsation is mag, which is well within the range observed in single ZZ Ceti white dwarfs (Winget, 1998). Figure 9 shows the TNG photometry folded over the pulse period of 641.84 s, after subtracting a long-period photometric modulation with min (see Sect. 5). The detection of pulsations makes SDSS 1339 only the eighth pulsating white dwarf in a CV.
The fact that only one pulsation mode is detected above a 3- threshold raises the question whether other mechanisms than non-radial pulsations could cause the observed variability. In principle, the white dwarf spin could account for a stable clock in photometric data, as seen in intermediate polars. However, in intermediate polars, multiple optical modulations are observed, usually at the white dwarf rotational period, the orbital period and sideband periods. In these systems the spin modulation stems the reprocessing of X-rays in the magnetically confined accretion flow onto the WD while the orbital and the beat periodicities are due to reprocessing in the accretion disc and the bright spot. However, in SDSS 1339 we do not detect a significant signal at the orbital period, nor any beat signal. Furthermore, the optical spectrum of SDSS 1339 in no way resembles that of any confirmed intermediate polar, as it has literally no He II 4686 emission, and not a single intermediate polar is known whose optical emission is dominated by the white dwarf. The non-detection of Zeeman splitting in the Balmer lines, specifically the higher members, limits the possible field strength of the white dwarf to MG. Finally, as discussed above, SDSS 1339 is not a prominent X-ray source.
5 A long non- photometric periodicity
Inspection of the power spectra (Fig. 8) reveals a low-frequency signal of variable amplitude in all three nights. The power spectrum of the combined data contains two signals of nearly identical amplitude at 4.50 and 4.18 , with the latter one being the stronger peak. Removing the photometric data with the 641.84 s pulse signal and fitting them to a sine wave results in two possible periods, 319.95(5) min or 344.32(7) min. Figure 10 shows the pulse-removed photometry folded over 344.32 min. The average amplitude of this modulation is 0.025 mag, but the power spectra indicate that the amplitude is rather variable on a time scale of days. No equivalent long-period variability is detected in the radial velocity variations (Sect. 3.1).
Long-period photometric modulations with periods in the range 7–12 h have been reported for SDSS J123813.73–033933.0 and SDSS J204817.85–061044.8 (Zharikov et al., 2005; Woudt et al., 2005), which are both short-period CVs with white-dwarf dominated optical spectra. A similar phenomenon is also well-documented in GW Lib, where a 125.4 min photometric modulation has been detected with an amplitude of mag on several occasions (Woudt & Warner, 2002). In FS Aur, a 205.5 min photometric modulation with a 0.24 mag amplitude was detected by Tovmassian et al. (2003). In both systems, the photometric modulations occur on periods substantially longer than the orbital periods (76.9 min and 85.7 min, respectively). Tovmassian et al. (2003) invoke the precession of a rapidly rotating white dwarf as a possible explanation for the long-period signal found in FS Aur. To date, this hypothesis could not be confirmed, and no other plausible model has been suggested.
The puzzle of long-period signals in short-period CVs is exacerbated by the case of HS 2331+3905, where a spectroscopic (i.e. radial velocity) periodicity of h is found that is in no way associated with the 81.1 min orbital period of the system, and that does not have any photometric equivalent (Araujo-Betancor et al., 2005). Whereas there is mounting evidence that variability on periods much longer than the orbital period is fairly common among CVs near the minimum period, the origin of this phenomenon is unclear.


| System | [min] | Mag | periods [s] | Outbursts | [K] / | Ref |
|---|---|---|---|---|---|---|
| PQ And | 80.7/78.5p | 1263, 634 | 1938, 1967, 1988 | 12 000/7.7a | 1,2,3 | |
| GW Lib | 76.8s | 650, 370, 230 | 1983 | 11 000/8.0c 14 700/8.0d | 4,5,6,7,8 | |
| HS 2331+3905 | 81.1pe | 310, 336, 419e | - | 10 500/8.0f | 9 | |
| RE J1255+266 | 119.4p | 668, 1236, 1344 | 1994 | 36 480/9.0g 11 000–15 000h | 10,11,12 | |
| SDSS J013132.39-090122.3 | 98:s | 260, 335, 595 | - | - | 13,14 | |
| SDSS 133941.11+484727.5 | 82.5s | 642 | - | 12 500/8.0c | 15, this paper | |
| SDSS J161033.64-010223.3 | 80.5p | 607, 345, 304, 221 | - | - | 15,16 | |
| SDSS J220553.98+115553.7 | - | 330, 475, 575 | - | - | 13,14 |
1Schwarz et al. (2004),
2Patterson et al. (2005a),
3Vanlandingham et al. (2005),
4Szkody et al. (2000),
5Szkody et al. (2002a),
6Thorstensen et al. (2002),
7Thorstensen (2003),
8van Zyl et al. (2004),
9Araujo-Betancor et al. (2005),
10Watson et al. (1996),
11Wheatley et al. (2000),
12Patterson et al. (2005b),
13Szkody et al. (2003),
14Warner & Woudt (2004),
15Szkody et al. (2005),
16Szkody et al. (2002b),
17Woudt & Warner (2004).
: Uncertain estimate. p Photometric period. pe Photometric period, eclipsing. s Spectroscopic period.
a Fit to the Balmer lines.
b Downes et al. (2001) list a pre-outburst photometric magnitude
of , however, most published pre- and post-outburst
photometry suggests (USNO, DENIS,
Thorstensen 2003).
c Fit to the Balmer lines with fixed .
d Fit to far-ultraviolet spectra with fixed .
e Very complex power spectrum.
f Fit to far-ultraviolet/optical spectrum with fixed .
g Fit to the Balmer lines, using a model grid with
.
h Estimated from colours.
6 Discussion
Asteroseismology of single white dwarfs is a well-established field, with close to 100 ZZ Ceti stars known (more than half of which were discovered in the SDSS, Mukadam et al. 2004; Mullally et al. 2005). Winget (1998) and Clemens (1993) note a substantial diversity of the single pulsating ZZ Ceti stars as a function of their temperature. The hot ( K) pulsators have a relatively small number of modes, typically in the range 100 –300 s, with a high degree of stability both in frequencies and amplitudes. In contrast to this, the cooler ( K) pulsators are characterised by longer periods in the range 600–1000 s, larger amplitudes, more modes, and what appears to be unstable amplitudes of the individual modes. Overall, the power spectra of the cooler pulsators are much more challenging to interpret than those of the hotter ones.
Since the discovery of non-radial pulsations of the white dwarf in GW Lib (van Zyl et al., 2004), much effort has been invested in identifying additional CV white dwarf pulsators (e.g. Woudt & Warner, 2004; Araujo-Betancor et al., 2005; Patterson et al., 2005b) and in theoretical modelling of accreting white dwarf pulsators (Townsley et al., 2004). The scientific potential of asteroseismology in CVs is enormous, as it could allow accurate measurements of white dwarf masses, envelope masses, rotation rates, and magnetic fields – important parameters for understanding the structure and evolution of CVs which are so far difficult or not at all measurable. From the current roster of known CV white dwarf pulsators given in Table 2, it is clear that there is still a long way to go before achieving these goals.
An observational problem is that the CV white dwarf pulsators are all much fainter than the field ZZ Ceti stars, in fact, hardly any single white dwarf pulsator with has been studied. The need to detect low-amplitude variability in these objects requires photometry obtained at large-aperture telescopes, where it is difficult to obtain observing runs long enough to determine accurate pulsation frequencies. The largest photometric data sets have been published for the two brightest CV pulsators, GW Lib and HS 2331+3905 (van Zyl et al., 2004; Araujo-Betancor et al., 2005). Both systems exhibit large variations in their power spectra on time scales of days to months, and no detailed mode identification has been achieved so far.
A problem intrinsic to the nature of accreting sources is the determination of the white dwarf temperature. Using optical wavelengths alone gives rise to large systematic uncertainties as any fit to the Balmer absorption lines is subject to an unknown contribution from the accretion disc (and possibly the bright spot). Given how narrow the ZZ Ceti instability strip of single white dwarfs is in terms of temperature, there is little hope in empirically defining the equivalent for CV white dwarfs from optical data alone. A substantial improvement comes from far-ultraviolet (FUV) data, as the white dwarf dominates in this wavelength range, and both the Ly absorption profile as well as the FUV to optical spectral energy distribution can be used in estimating the white dwarf temperature. Interestingly enough, again GW Lib and HS 2331+3905 are the only systems with accurate white dwarf temperatures, and the FUV data for GW Lib indicate that parameters might be very different in CV pulsators compared to field ZZ Ceti stars: the FUV-determined temperature is 14 700 K for an assumed 111In contrast to single white dwarfs, it is very difficult if not impossible to break the degeneracy between and that occurs in spectral modelling. The reason is that the Balmer lines are strongly contaminated by the accretion disc, and that the FUV observations provided by HST/STIS cover only the red wing of Ly., well outside the instability strip of single ZZ Ceti stars (Szkody et al., 2002a). Szkody et al. (2002a) note that the FUV spectrum is better fitted with a two-temperature white dwarf model, where the lower temperature gets fairly close to the hot edge of the ZZ Ceti instability strip. However, the physical origin of such an inhomogeneous temperature distribution over the white dwarf is not clear. HS 2331+3905 has a temperature just close to the cold edge of the ZZ Ceti instability strip, which is consistent with its very complex power spectrum (Araujo-Betancor et al., 2005).
Currently, all known CV white dwarf pulsators have orbital periods very close to the orbital period minimum (Table 2), where accretion rates are sufficiently low to correspond to white dwarf effective temperatures close to the ZZ Ceti instability strip. The immediate task in improving our understanding of the pulsations in accreting white dwarfs is now to measure accurate effective temperatures for all white-dwarf dominated CVs, establish whether or not they are pulsating, and determine their pulsation frequencies. Only once the pulsation modes have been identified, asteroseismology may reveal details about the structure of these stars.
7 Conclusions
We have determined the orbital period of SDSS 1339 to be 82.524 min from radial velocity studies. The optical spectrum is dominated by the white dwarf, and can be successfully modelled with a (12 500 K, ) synthetic spectrum. The contribution of the accretion disc to the observed optical flux is less than 10%, corresponding to a very low optical accretion luminosity of . CCD photometry of SDSS 1339 reveals the presence of variability with a stable 641 s period and an amplitude of mag, which we interpret as non-radial pulsations of the white dwarf. Further photometric work is encouraged to probe for additional pulsation modes. Similar to several other short-period CVs, SDSS 1339 displays an apparently coherent photometric variability on time scales much longer than the orbital period. The nature of this variability is not understood.
Acknowledgements
BTG and TRM were supported by a PPARC Advanced Fellowship and a PPARC Senior Fellowship. DdM acknowledges funding from the Italian Ministry of University and Research (MIUR). PS acknowledges some support from NSF grant AST 02-05875. AA thanks the Royal Society for generous funding. PJG, GR, EvdB are supported by NWO-VIDI grant 639.042.201 and GN is supported by NWO-VENI grant 639.041.405. MRSK thanks for supported by the Deutsches Zentrum für Luft- und Raumfahrt (DLR) GmbH under contract No. FKZ 50 OR 0404. Based in part on observations made with the William Herschel Telescope, which is operated on the island of La Palma by the Isaac Newton Group in the Spanish Observatorio del Roque de los Muchachos of the Instituto de Astrofísica de Canarias (IAC); on observations made with the Telescopio Nazionale Galileo operated on the island of La Palma by the Centro Galileo Galilei of the INAF (Istituto Nazionale di Astrofisica) at the Spanish Observatorio del Roque de los Muchachos of the IAC; and on observations made at the 1.2 m telescope, located at Kryoneri Korinthias, and owned by the National Observatory of Athens, Greece. The WHT and TNG data were obtained as part of the 2004 International Time Programme of the night-time telescopes at the European Northern Observatory. We thank the referee for helpful comments.
References
- Araujo-Betancor et al. (2005) Araujo-Betancor, S., et al., 2005, A&A, 430, 629
- Bergeron et al. (1992) Bergeron, P., Saffer, R. A., Liebert, J., 1992, ApJ, 394, 228
- Bertin & Arnouts (1996) Bertin, E., Arnouts, S., 1996, A&AS, 117, 393
- Beuermann et al. (1998) Beuermann, K., Baraffe, I., Kolb, U., Weichhold, M., 1998, A&A, 339, 518
- Clemens (1993) Clemens, J. C., 1993, Baltic Astronomy, 2, 407
- Downes et al. (2001) Downes, R. A., Webbink, R. F., Shara, M. M., Ritter, H., Kolb, U., Duerbeck, H. W., 2001, PASP, 113, 764
- Gänsicke et al. (1997) Gänsicke, B. T., Beuermann, K., Thomas, H. C., 1997, MNRAS, 289, 388
- Gänsicke et al. (1999) Gänsicke, B. T., Sion, E. M., Beuermann, K., Fabian, D., Cheng, F. H., Krautter, J., 1999, A&A, 347, 178
- Hamada & Salpeter (1961) Hamada, T., Salpeter, E. E., 1961, ApJ, 134, 683
- Hameury & Lasota (2005) Hameury, J.-M., Lasota, J.-P., eds., 2005, The Astrophysics of Cataclysmic Variables and Related Objects, ASP Conf. Ser. 330
- Howell et al. (1997) Howell, S. B., Rappaport, S., Politano, M., 1997, MNRAS, 287, 929
- Hubeny & Lanz (1995) Hubeny, I., Lanz, T., 1995, ApJ, 439, 875
- Kirkpatrick et al. (1999) Kirkpatrick, J. D., et al., 1999, ApJ, 519, 802
- Kirkpatrick et al. (2000) Kirkpatrick, J. D., et al., 2000, AJ, 120, 447
- Koester et al. (1979) Koester, D., Schulz, H., Weidemann, V., 1979, A&A, 76, 262
- Kolb (1993) Kolb, U., 1993, A&A, 271, 149
- Liebert et al. (2005) Liebert, J., Bergeron, P., Holberg, J. B., 2005, ApJS, 156, 47
- Mukadam et al. (2004) Mukadam, A. S., et al., 2004, ApJ, 607, 982
- Mukai & Patterson (2004) Mukai, K., Patterson, J., 2004, in Tovmassian, G., Sion, E., eds., Compact Binaries and Beyond, no. 20 in Conf. Ser., RMAA, p. 244
- Mullally et al. (2005) Mullally, F., Thompson, S. E., Castanheira, B. G., Winget, D. E., Kepler, S. O., Eisenstein, D. J., Kleinman, S. J., Nitta, A., 2005, ApJ, 625, 966
- Patterson et al. (2005a) Patterson, J., Thorstensen, J., Armstrong, E., Henden, A., Hynes, R., 2005a, PASP, in press (astro-ph/0506135)
- Patterson et al. (2005b) Patterson, J., Thorstensen, J. R., Kemp, J., 2005b, PASP, 117, 427
- Scargle (1982) Scargle, J. D., 1982, ApJ, 263, 835
- Schneider & Young (1980) Schneider, D. P., Young, P., 1980, ApJ, 240, 871
- Schwarz et al. (2004) Schwarz, G. J., Barman, T., Silvestri, N., Szkody, P., Starrfield, S., Vanlandingham, K., Wagner, R. M., 2004, PASP, 116, 1111
- Szkody et al. (2000) Szkody, P., Desai, V., Hoard, D. W., 2000, AJ, 119, 365
- Szkody et al. (2002a) Szkody, P., Gänsicke, B. T., Howell, S. B., Sion, E. M., 2002a, ApJ Lett., 575, L79
- Szkody et al. (2002b) Szkody, P., et al., 2002b, AJ, 123, 430
- Szkody et al. (2003) Szkody, P., et al., 2003, AJ, 126, 1499
- Szkody et al. (2004) Szkody, P., et al., 2004, AJ, 128, 1882
- Szkody et al. (2005) Szkody, P., et al., 2005, AJ, 129, 2386
- Thorstensen (2003) Thorstensen, J. R., 2003, AJ, 126, 3017
- Thorstensen et al. (2002) Thorstensen, J. R., Patterson, J., Kemp, J., Vennes, S., 2002, PASP, 114, 1108
- Tovmassian et al. (2003) Tovmassian, G., et al., 2003, PASP, 115, 725
- Townsley & Bildsten (2003) Townsley, D. M., Bildsten, L., 2003, ApJ Lett., 596, L227
- Townsley et al. (2004) Townsley, D. M., Arras, P., Bildsten, L., 2004, ApJ Lett., 608, L105
- van Zyl et al. (2004) van Zyl, L., et al., 2004, MNRAS, 350, 307
- Vanlandingham et al. (2005) Vanlandingham, K. M., Schwarz, G. J., Howell, S. B., 2005, pasp, in press (astro-ph/0506098)
- Voges et al. (2000) Voges, W., et al., 2000, IAU Circ., 7432
- Warner & Woudt (2004) Warner, B., Woudt, P., 2004, in Kurtz, D. W., Pollard, K. R., eds., Variable Stars in the Local Group, ASP Conf. Ser. 310, p. 392
- Watson et al. (1996) Watson, M. G., Marsh, T. R., Fender, R. P., Barstow, M. A., Still, M., Page, M., Dhillon, V. S., Beardmore, A. P., 1996, MNRAS, 281, 1016
- Wheatley et al. (2000) Wheatley, P. J., Burleigh, M. R., Watson, M. G., 2000, MNRAS, 317, 343
- Winget (1998) Winget, D. E., 1998, Journal of the Physics of Condensed Matter, 10, 11247
- Woudt & Warner (2002) Woudt, P. A., Warner, B., 2002, Ap&SS, 282, 433
- Woudt & Warner (2004) Woudt, P. A., Warner, B., 2004, MNRAS, 348, 599
- Woudt et al. (2005) Woudt, P. A., Warner, B., Pretorius, M. L., Dale, D., 2005, in Hameury & Lasota (2005), p. 325, p. 325
- Yaron et al. (2005) Yaron, O., Prialnik, D., Shara, M. M., Kovetz, A., 2005, ApJ, 623, 398
- Zharikov et al. (2005) Zharikov, S. V., Tovmassian, G. H., Neustroev, V., Michel, R., Napiwotzki, R., 2005, in Hameury & Lasota (2005), p. 327, p. 327