X-rays from the radio-quiet quasar PG 1407+265: relativistic jet or accretion disc emission?
Abstract
We present two XMM-Newton observations of the luminous (), radio-quiet quasar, PG 1407+265, separated by eleven months. The data indicate two distinct states: a highly variable, bright state (first epoch); and a quiescent, low-flux one (second epoch). During the low-flux state the spectrum is consistent with a single, unabsorbed power law. However, during the brighter state a highly variable, steep component is statistically required. Contemporaneous UV data from the Optical Monitor allow an estimate of the optical-to-X-ray spectral index (), which appears typical of radio-quiet quasars during the low-flux state, but extremely flat during the high-flux state. The XMM-Newton data can be described as originating from a combination of jet and accretion disc processes, in which the (relativistic) X-ray jet only works intermittently. The scenario could help describe some of the complexities seen in the broadband spectral energy distribution of PG 1407+265, such as weak high-ionisation emission lines, strong Fe ii, unbeamed continuum, and the weak radio emission relative to the optical.
keywords:
galaxies: active – galaxies: jets – galaxies: nuclei – quasars: individual: PG 1407+265 – X-ray: galaxies1 Introduction
The radio-quiet quasar, PG 1407+265 (), is best known for constant display of enigmatic behaviour. A detailed analysis of the spectral energy distribution (SED; McDowell et al. 1995) revealed that PG 1407+265 exhibited a normal non-variable, radio-quiet continuum, but weak and blueshifted high-ionisation emission lines. In contrast, the UV and optical Fe ii appeared rather strong. A hand-full of weak-line quasars have since been discovered (e.g. Leighly et al. 2004; Hall et al. 2004; Reimers et al. 2005), but no general consensus has been reached as to the nature of the physical mechanisms involved.
A relativistically beamed continuum, as in a blazar, could explain the absence of emission lines. For PG 1407+265 this explanation is normally dismissed as the SED of the quasar is strikingly similar to that of radio-quiet AGN (Elvis et al. 1994). Moreover, PG 1407+265 is relatively radio weak with an optical-to-radio flux ratio of (Kellermann et al. 1989) and, by definition, consistent with radio-quiet AGN. However, a multi-year radio observing campaign of PG 1407+265 with the VLBA revealed strong evidence of a radio jet with a highly relativistic speed (Dopper factor ) and likely viewed within a few degrees of pole-on (Blundell et al. 2003). Blundell et al. suggested that the pole-on orientation could explain some of the optical/UV properties, assuming that the line-of-sight was into the broad line region, thus the emission line spectrum is diluted by the accretion disc continuum.
Although PG 1407+265 is individually curious, a better understanding of it could have broader implications. The debate whether the radio characteristics of AGN show a bimodal or continuous distribution is ongoing (e.g. Goldschmidt et al. 1999; White et al. 2000; Ivezic et al. 2002; Cirasuolo et al. 2003). The discovery of objects which possess characteristics of both groups are obviously of interest. It is clear that all AGN are capable of producing radio emission, hence able to generate jets on some level. Observational support for this comes from sensitive, high-resolution radio imaging of radio-quiet AGN, evidencing jets in some objects (e.g. Blundell & Beasley 1998; Ulvestad et al. 2005). The simplest conclusion is that the radio mechanism in radio-quiet and radio-loud AGN are identical, except that the bulk kinetic power is smaller in radio-quiet objects.
To some extent, these observations form the bases of the ‘aborted jet’ model which has become fashionable in AGN circles. The idea being that short or aborted jets are produced in radio-quiet AGN and the high-energy jet particles, which are expelled close to the black hole environment, illuminate the accretion disc (e.g. Henri & Petrucci 1997; Ghisellini et al. 2004). The presence of these energetic particles can account, in whole or in part, for the high-energy continuum traditionally associated with the accretion disc corona.
PG 1407+265 could evolve to be an important laboratory in investigation of the radio-quiet/loud dichotomy (or lack of it), because the quasar clearly possesses characteristics of both classes: it is an example of a radio-quiet AGN which has successfully launched a relativistic radio jet to large distances. In this paper, we examine the X-ray properties of this quasar to study the behaviour of possible jet emission closer to the central engine.
2 Observations, data reduction, and fitting preparations
PG 1407+265 was observed with XMM-Newton (Jansen et al. 2001) on 2001 January 23 (revolution 206) and 2001 December 22 (revolution 373) for approximately 71 and 42 ks, respectively. At both epochs, all on-board instruments functioned normally. The EPIC pn (Strüder et al. 2001) and MOS (MOS1 and MOS2; Turner et al. 2001) cameras were operated in full-frame mode with the thin filter in place. The Reflection Grating Spectrometers (RGS1 and RGS2; den Herder et al. 2001) also collected data during this time, as did the Optical Monitor (OM; Mason et al. 2001). The RGS data were presented in an examination of line-of-sight absorption toward PG 1407+265 (Fang et al. 2005), and will not be discussed here.
The Observation Data Files (ODFs) were processed to produce calibrated event lists using the XMM-Newton Science Analysis System (XMM-SAS v6.4.0) and the most recent calibration files. Due to anomalies in the Mission-Elapsed-Time during the first observation, the default values of the the environment variable SAS_OBT_MET_FIT111http://xmm.vilspa.esa.es/sas/current/doc/idxEnvironments.html were changed accordingly to “0,1,0.5,0.9,1”. Otherwise, standard processing practices were followed. Unwanted hot, dead, or flickering pixels were removed as were events due to electronic noise. Event energies were corrected for charge-transfer losses, and time-dependent EPIC response matrices were generated using the SAS tasks ARFGEN and RMFGEN. Light curves were extracted from these event lists to search for periods of high background flaring. Some flaring was evident during revolution 206, consequently the data during these intervals were simply ignored. The source plus background photons were extracted from a circular region with a radius of 35′′, and the background was selected from an off-source region with a radius of 50′′ and appropriately scaled to the source region. Single and double events were selected for the pn spectra, and single-quadruple events were selected for the MOS. Pile-up was examined at both epochs and deemed negligible in all instruments.
The OM worked in imaging mode at both epochs. In total, eight images were taken during revolution 206, and ten during revolution 373. Only the filter () was used with typical exposures between . A log of the XMM-Newton observations is provided in Table LABEL:tab:log.
| (1) | (2) | (3) | (4) | (5) |
|---|---|---|---|---|
| Rev. | Obs. ID | Instrument | Exposure ( s) | Counts |
| 206 | 0092850101 | pn | 51458 | 125750 |
| MOS1 | 62925 | 35331 | ||
| MOS2 | 62821 | 35419 | ||
| OM | 36000 | – | ||
| 373 | 0092850501 | pn | 35098 | 30980 |
| MOS1 | 41017 | 8979 | ||
| MOS2 | 41007 | 8784 | ||
| OM | 38800 | – |
In the following analysis, the spectra are grouped such that each bin contains at least 20 counts, and fitting is performed using XSPEC v12.2.0 (Arnaud 1996). Fit parameters are reported in the rest frame of the object and quoted errors correspond to a 90% confidence level for one interesting parameter (i.e. = 2.7 criterion). K-corrected luminosities are derived assuming isotropic emission, a value for the Hubble constant of =, and a standard cosmology with = 0.3 and = 0.7.
A value for the Galactic column density toward PG 1407+265 of (Elvis et al. 1989) is adopted in all of the spectral fits. Initial spectral fits were performed with a free absorption parameter set to the redshift of the source. In determining that the intrinsic absorption was imperceptible (), subsequent spectral modelling included only the Galactic component.
Recent work on the pn calibration show that the spectral response is reasonable down to (F. Haberl priv. comm.). We confirmed that inclusion of the data did not hamper the fit; therefore we elected to utilise the lower energy range in our analysis.
On the low-energy end, the MOS are limited to to minimise cross-calibration uncertainties between the three cameras (Kirsch 2005). At high energies, all three spectra are restricted at where background contamination becomes significant.
3 The bright-state January 2001 observation
3.1 Spectral analysis
Fitting the pn and MOS spectra separately revealed relatively good agreement within known cross-calibration uncertainties (Kirsch 2005); therefore for the initial phenomenological fits all of the EPIC data were fitted together, while residuals from each instrument were examined separately to distinguish gross discrepancies. A moderately steep power law () fitted the observed band ( rest frame) relatively well (). A search for a narrow () iron emission line between yielded no detection, with the maximum equivalent width of any such feature being .
Extrapolation of the power law fit to in the pn and in the MOS degraded the fit quality (), and showed a gradual excess in the residuals toward lower energies (Figure 1). Several models were attempted to describe the broadband ( rest frame) spectra of PG 1407+265 in a phenomenological manner (Table LABEL:tab:fit206).
| (1) | (2) | (3) |
|---|---|---|
| Model | Parameters | |
| power law | ||
| broken | ||
| power law | ||
| blackbody | ||
| plus | ||
| power law | ||
| double | ||
| power law |
First, the single power law was formally fitted to the broadband spectra. This was an improvement over the extrapolated, high-energy power law, but, predictably, the data at higher energies (where statistics are lower) were underestimated.
Broken power law, double power law, and blackbody plus power law models, all provided comparable improvement over the single power law fit, and the inclusion of a second continuum component (two additional free parameters) was a significant improvement. For example, when tested with an F-test, the broken power law model resulted in an F-test probability of . We note that the double power law fit presented in Table LABEL:tab:fit206 was not unique. Different initial parameters resulted in slightly different final parameters, but comparable .
Remarkable was the high energy where the apparent change in spectral slope occurs in all of the models. This is seen in the high break energy ( rest frame) in the broken power law, and also manifested in the high temperature of the blackbody component (). As in the broken power law fit, the steeper component dominates the spectrum up to rather high energies in the double power law model, as well. It is unlikely that the high temperature or high break energy are physically meaningful, rather they instead indicate the presence of another component, which cannot be uniquely determine with the current statistics (see Sect. 6.2).
Considering the broken power law fit, the observed flux, corrected for Galactic extinction, was about . The corresponding rest frame luminosities in the and range were , and , respectively. The luminosity was comparable to the 1993 measurement made from an observation (, Reeves & Turner 2000).
3.2 Variability
3.2.1 Broadband X-ray flux variability
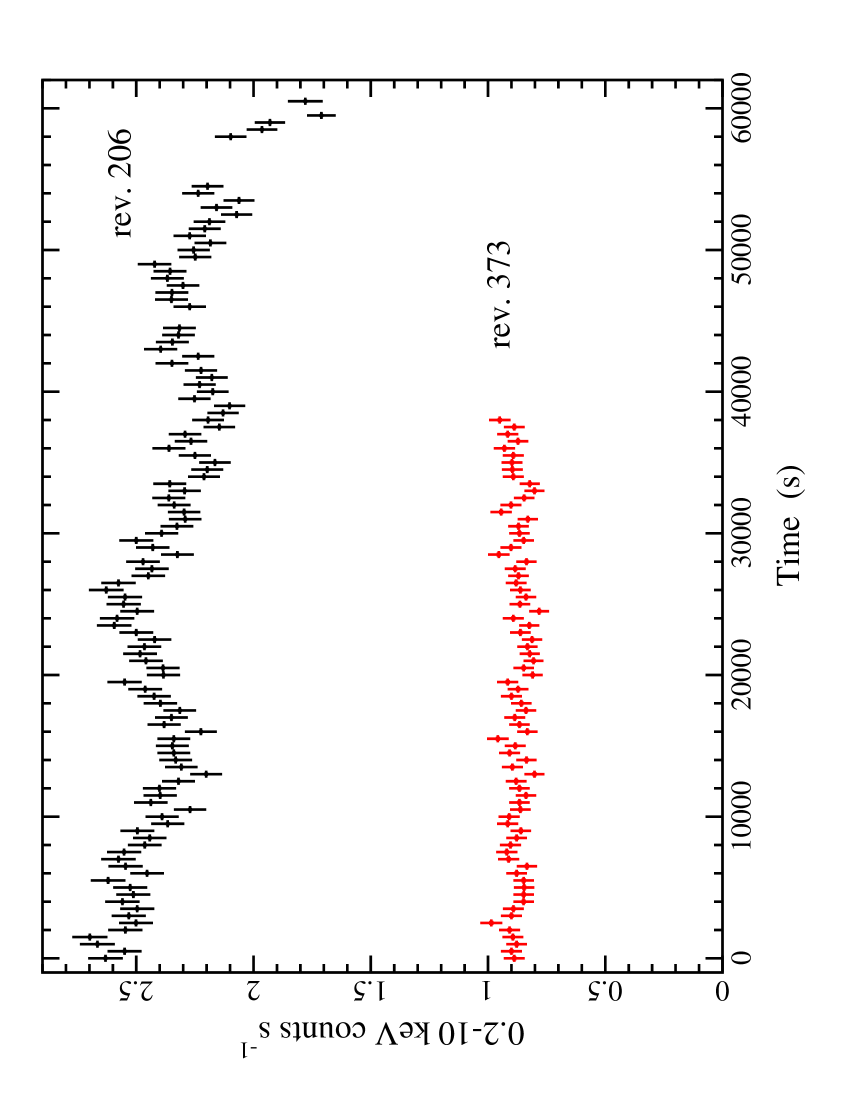
Examining the observed light curve in bins revealed significant variations on the order of about the mean count rate over the duration of the revolution 206 observation (see Figure 2). The variability is even more impressive when we recall that the average luminosity of PG 1407+265 was in excess of , and that the quasar is radio-quiet.
The most rapid rise occurred about into the observations when the count rate increased about in . Adopting the blackbody plus power law fit resulted in the most conservative estimate of the luminosity rate of change. Accordingly, the change in count rate corresponds to a luminosity change of in a quasar rest frame time interval of . Following Fabian (1979; see also Brandt et al. 1999) the radiative efficiency of PG 1407+265 was . Assuming a uniform, spherical emission region the measured is comparable to the efficiency expected from a maximally rotating Kerr black hole (, Thorne 1974). The demand on black hole spin can be relaxed if asymmetric emission processes, such as relativistic Doppler boosting or light bending, play an important role in the energy output of PG 1407+265.
3.2.2 Interband variability
Initially, variability was examined in three sub-bands: , , and . It was established that there was no discernible spectral variability or significant differences in the amplitude of the fluctuations between the and bands, thus to improve statistics, the two bands were combined. Therefore, light curves are examined in the ( rest frame) and ( rest frame) bands.
It was immediately noticeable that the degree of variability was much greater in the lower energy band. The fractional variability () in the band was , whereas between , (uncertainties estimated following Edelson et al. 2002).
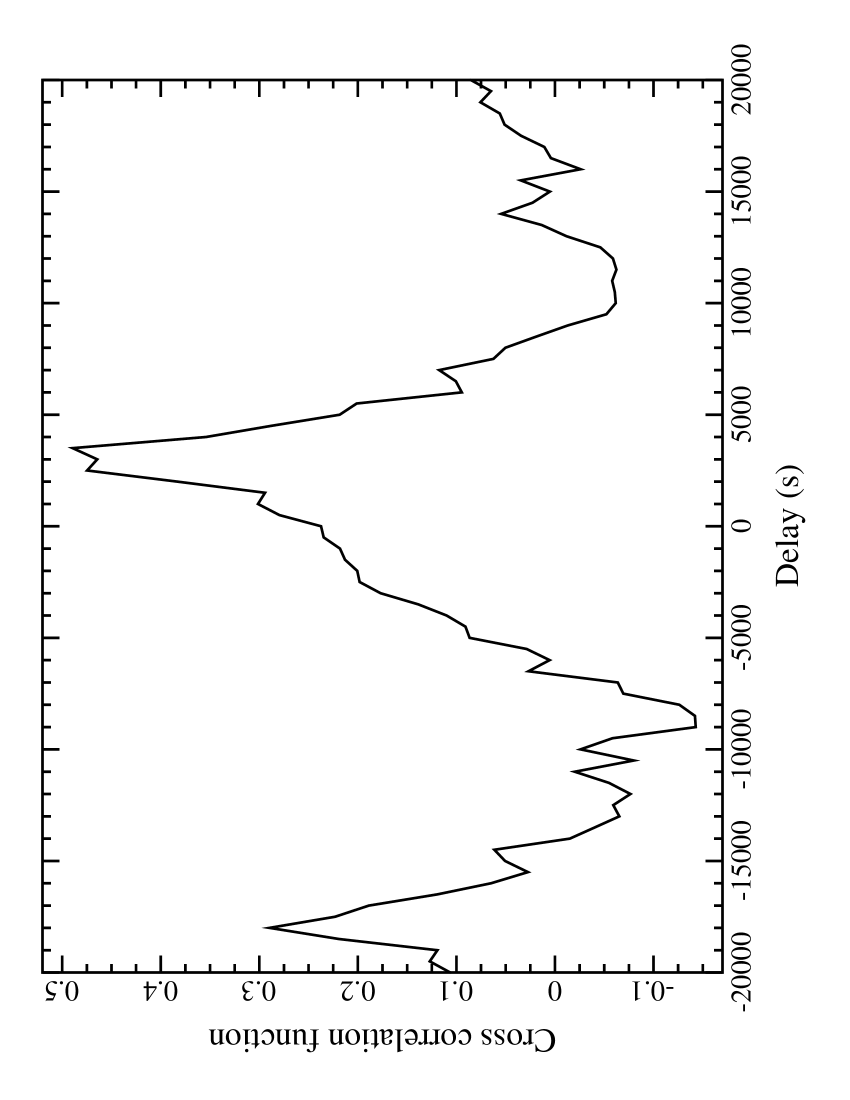
The count rates measured in the two bands were well-correlated (Figure 3). As such, we examined possible lags between the two bands by calculating the nominal cross-correlation function. With the light curves in bins, there does appear to be a lag (Figure 3), such that the low-energy band leads the hard energy band by .
The significance of the lag should be treated with caution. When we cross-correlated the band with and light curves separately, no lag was detected. It could simply be that the combined light curve produces sufficiently high signal-to-noise to make a detection, but nevertheless we do not consider the possible lag a robust detection.
3.2.3 X-ray spectral variability
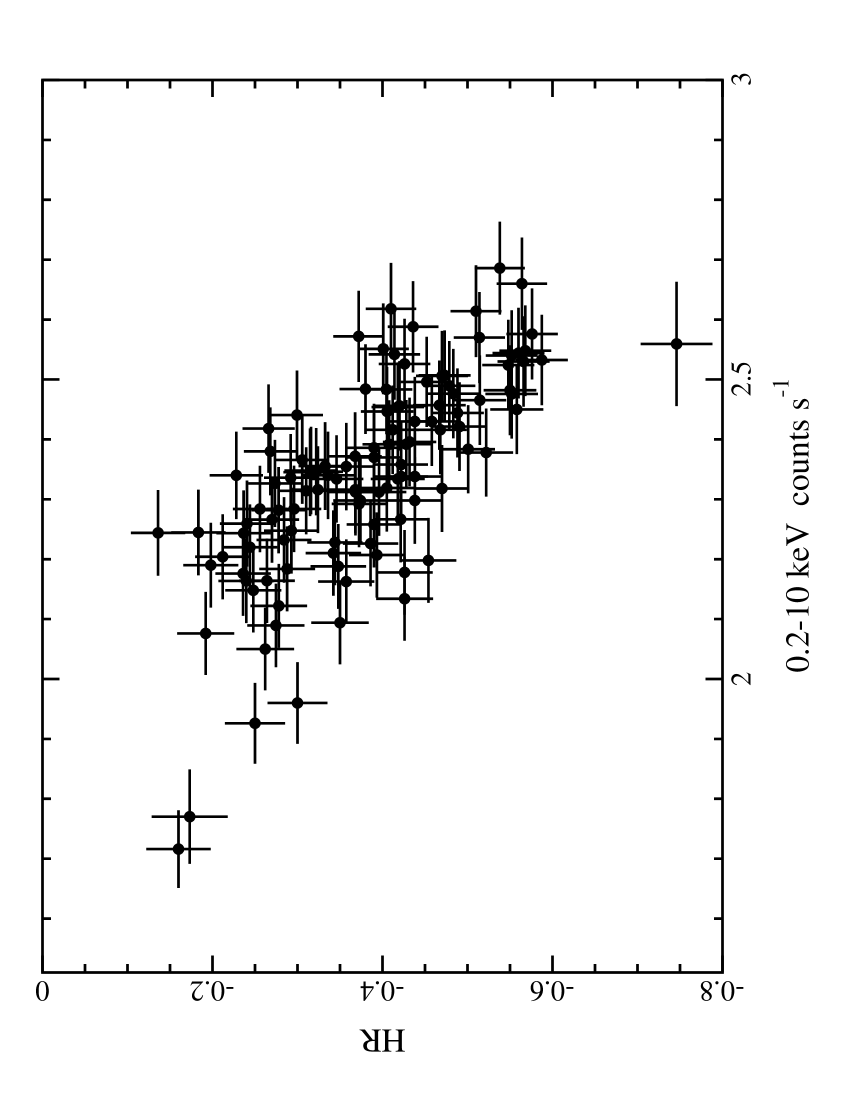
As discussed in Section 3.2.2 there was clear spectral variability with the amplitude of the fluctuations being much larger in the band then in the band. We investigated the spectral variability with time by calculating the hardness ratio (, where and are count rates in the hard and soft bands, respectively) variability curve. The hardness ratio curve was inconsistent with a constant () and correlated with the broadband count rate, such that the spectrum becomes harder with diminishing intensity (Figure 4). In general, as the flux gradually decreased over the observation, the spectrum became harder. To investigate this short-term, flux-dependent spectral variability during revolution 206, we divided the observation into half: the high-flux state (first half) and a low-flux state (second half).
Initially, we fitted both pn spectra with a power law above only. We found that this produced a good fit with a common flux and photon index (), indicating that the spectral variability was dominated by the lower-energy component. Extrapolating this power law to lower energies, we determine that the high-flux spectrum appeared significantly steeper (Figure 5).
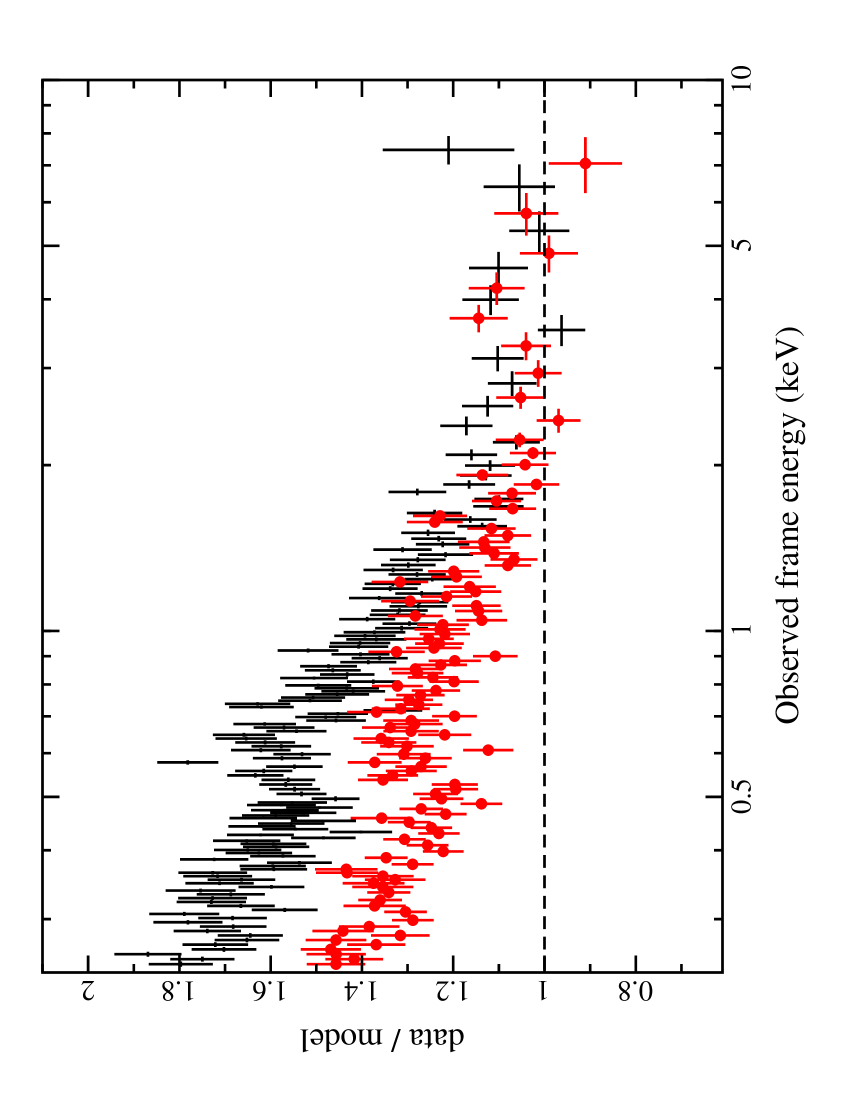
To investigate this further, we fitted both spectra simultaneously with a broken power law. We maintained the break energy () and high-energy power law () common for both models and allowed only the low-energy power law to vary separately. This produced a good fit to the data () and illustrated the nature of the spectral variability (see fit parameters in Table LABEL:tab:206hilo): the high-energy spectrum was consistent in flux and spectral shape; however, at low energies the variability seemed to be characterised by a change in shape as well as flux.
| (1) | (2) | (3) |
|---|---|---|
| Model | High-flux | Low-flux |
| Parameter | ||
| (keV) | ||
3.2.4 Possible ultraviolet variability
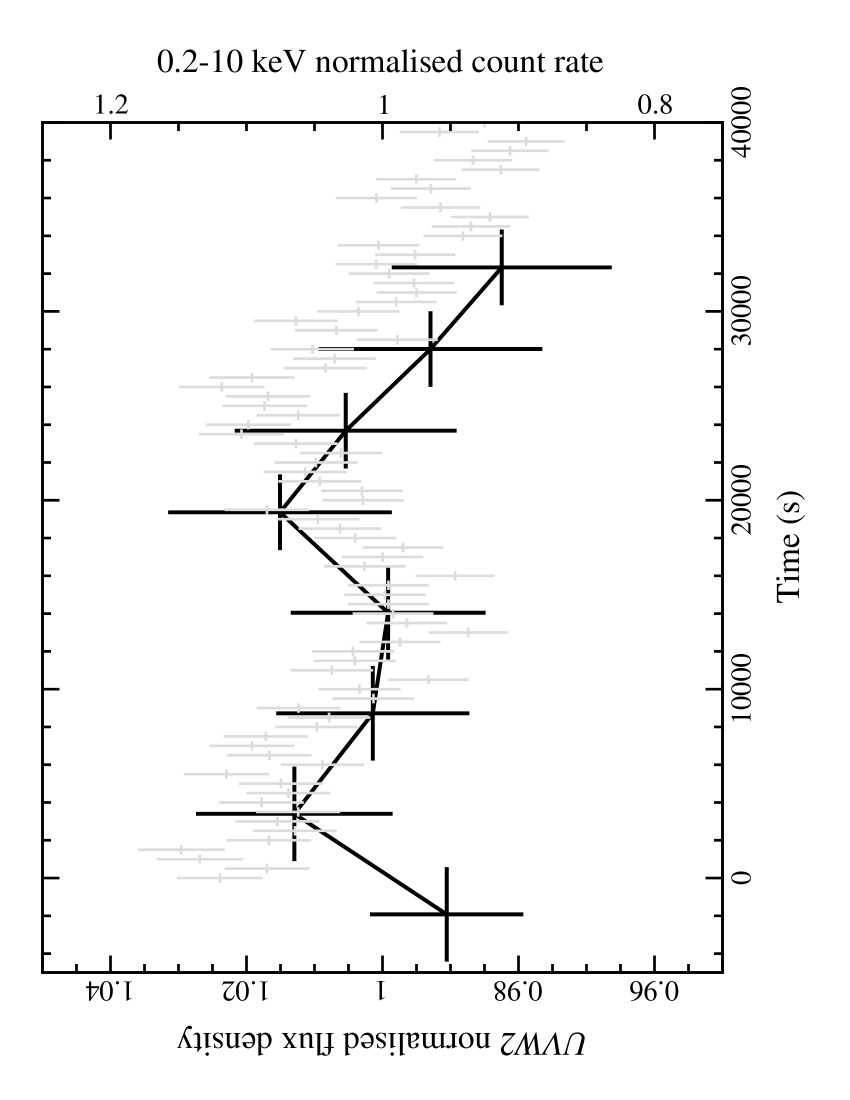
Eight images of PG 1407+265 were obtained in the filter (rest frame range) with the OM during the first of the X-ray observation. For each image, a flux density was estimated from the count rate using the conversion factor derived by Chen (2004). The average flux density during revolution 206 was approximately .
We emphasise that within the flux uncertainties () there were no significant variations in the UV light curve. Formally, the OM light curve was consistent with a constant. However, the apparent trend in the light curve was intriguing. Taking liberty to speculate, when the light curve was overplotted (in time) on the X-ray light curve there appeared to be a common trend in the fluctuation (Figure 6). The relationship between the curves could even be improved if we allowed for a slight time shift in one of them (e.g. if the UV lead the X-rays by a few kiloseconds).
4 The low-flux December 2001 observation
4.1 Spectral analysis
| (1) | (2) | (3) |
|---|---|---|
| Model | Parameters | |
| power law | ||
| broken | ||
| power law | ||
| blackbody | ||
| plus | ||
| power law | ||
| double | ||
| power law |
A power law () provided an acceptable fit ( to the ( rest frame) EPIC spectra of PG 1407+265 during revolution 373. As with the earlier observation, no narrow iron emission line was detected.
Extrapolating the high-energy power law to lower energies was a good approximation to the broadband spectra. Indeed, fitting the single power law over this entire band did not result in a significant change of the photon index (). The addition of a second continuum component did improve the fit over the single power law (F-test probability of ), but not as significantly as in the revolution 206 data.
Adopting the broken power law fit, resulted in an unabsorbed flux of about . The corresponding rest frame luminosities in the and range were , and , respectively.
4.2 Timing analysis
The timing behaviour of PG 1407+265 during revolution 373 was much more in-line with the expected behaviour of a high-luminosity quasar. The light curve (Figure 2) was completely consistent with a constant over the observations (). Similarly, the UV light curve was also constant.
The X-ray spectral variability was also negligible. The fractional variability in the two X-ray sub-bands (i.e. and ) was on the level, and the hardness ratio was also rather constant over time ().
5 Comparison between the two observations
5.1 Optical-to-X-ray spectral index
The flux density of PG 1407+265 diminished from during revolution 206 to during revolution 373. The fractional decrease in the AGN UV flux density was about over the eleven month period. Over the same time, the average broadband X-ray flux diminished by .
A serendipitous, optically bright object () was identified in the OM field-of-view in two images at each epoch. The object is possibly associated with the F8 star HD 124732, but this is not conclusive given the several arc minute discrepancy in positions. Of importance was that the flux of the object () was equal at both epochs (revolution 206 and 373) to within about . This clearly indicates that the different UV fluxes measured in PG 1407+265 arise from changes in the AGN and not from instrumental effects of the OM.
The optical-to-X-ray spectral index, , is the slope of a hypothetical power law extending between the optical (UV) and X-ray continuum in AGN: In the standard definition and are the intrinsic flux densities at and , respectively, consequently
Typical values of for unabsorbed, radio-quiet AGN are between and with the slope steepening with increasing UV luminosity (e.g. Strateva et al. 2005). In radio-quiet AGN, is likely representative of accretion disc processes, and understanding the origin and distribution of characteristics will lead to a bettering understanding of the primary emission mechanism in AGN.
With the data at hand, we were able to measure the spectral index of the power law between and (the rest frame peak emission observed in the filter): The spectral slope between and is then: From these equations we can determine a transformation from our measured and the standard definition, , specifically:
This leaves us to estimate and thus requires that we make some assumptions. Firstly, we assume that the UV properties of PG 1407+265 are not unusual. While it is clear that the emission line properties are unique, McDowell et al. (1995) concluded that the continuum was rather typical of radio-quiet AGN. As such, we adopt the spectral slope of the composite SDSS quasar spectrum between (, Vanden Berk et al. 2001). This brings us to the second assumption, that the slope between and is not drastically different. This is likely invalid (e.g. Laor et al. 1995; Shang et al. 2005), but since the systematic uncertainty will be introduced to both measurements, the differences between the two epochs should remain precise.
During the low-flux observation (revolution 373), we measured , which is not atypical of unabsorbed, radio-quiet AGN (e.g. Strateva et al. 2005; Yuan et al. 1998; Elvis et al. 1994). Interestingly, during the high-flux, revolution 206 observation, , very flat, even in terms of BL Lac spectral indices (e.g. Perlman et al. 2005).
We recalculate during revolution 206, but this time we considered only the emission from the hard power law component of the spectrum. This time, , much more comparable to the revolution 373 measurement. This may be implying that the high energy component originates from a less variable, accretion dominated process, whereas the steep, soft component may be beamed emission.
5.2 Long-term X-ray variability
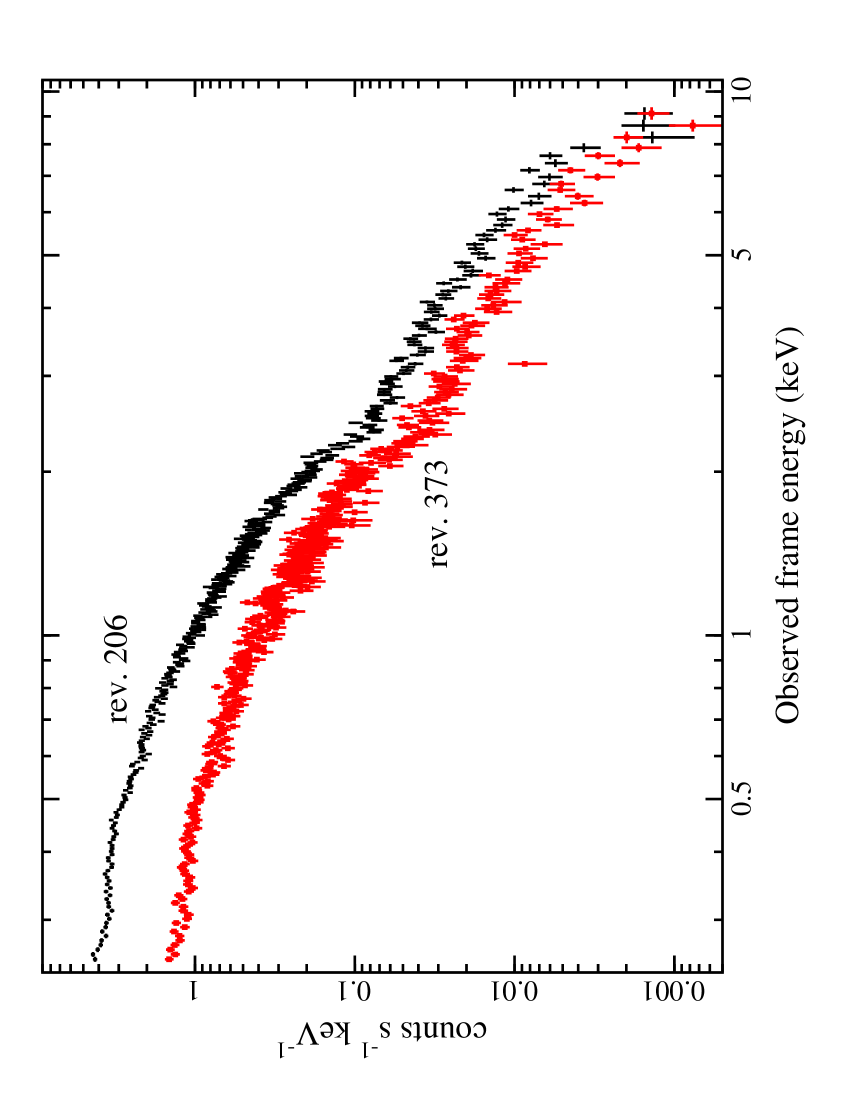
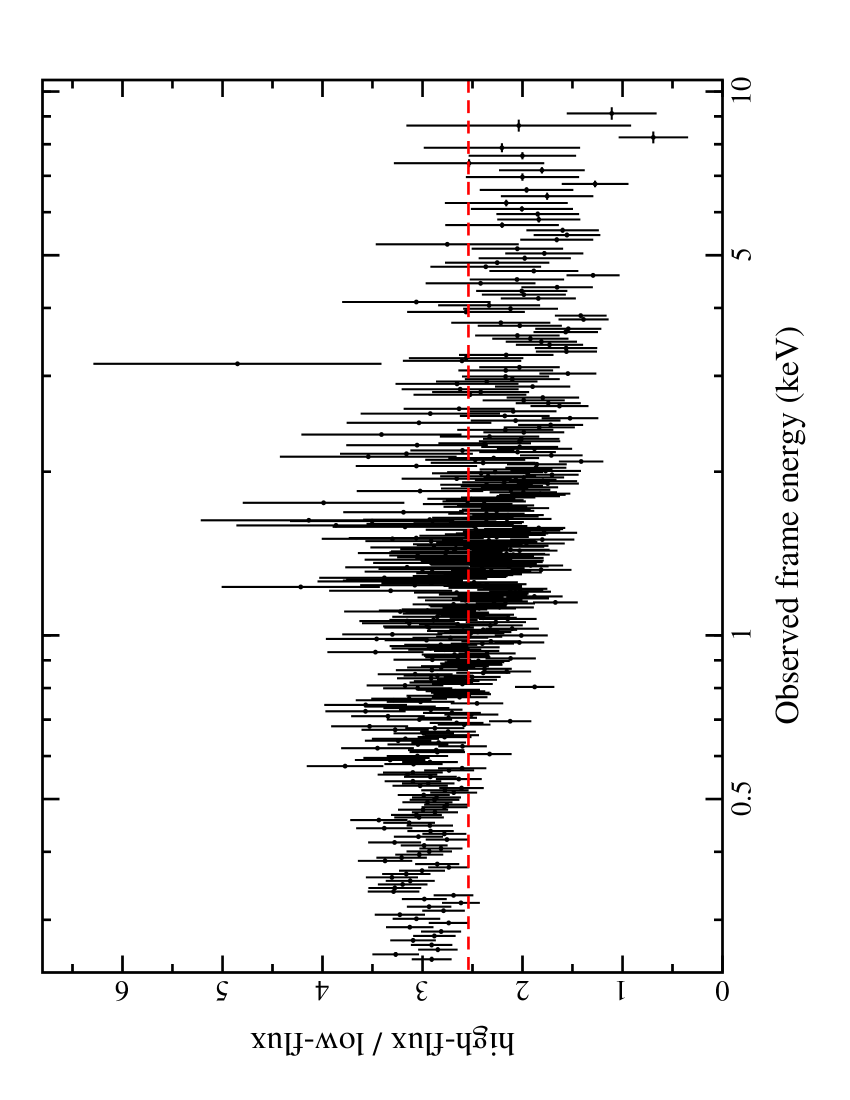
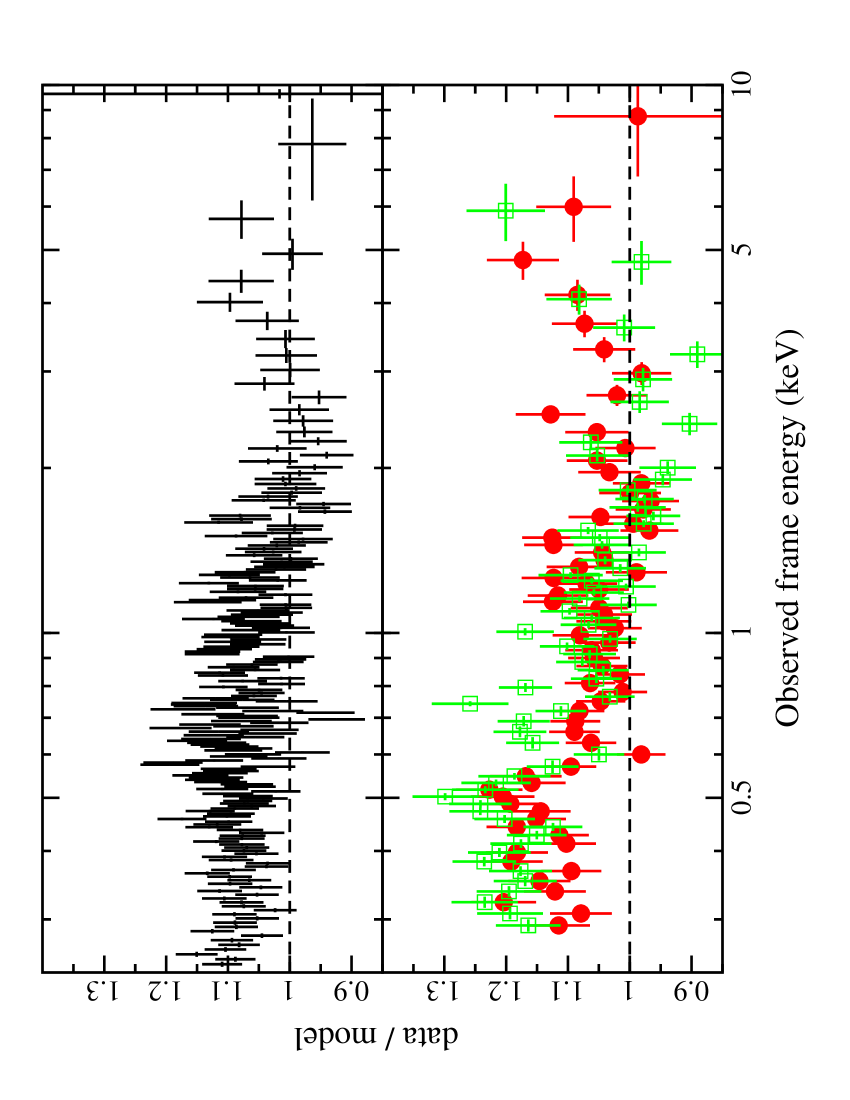
Considering its high luminosity and radio-quiet nature, the X-ray spectrum of PG 1407+265 displayed impressive spectral changes over an eleven month period. In Figure 7 some of the X-ray spectral difference between the two observational epochs are portrayed. A ratio spectrum between the high-flux (rev. 206) and low-flux (rev. 373) data illustrate how the flux difference between the two epochs is not uniform across the spectrum, but gradually increases toward lower energies.
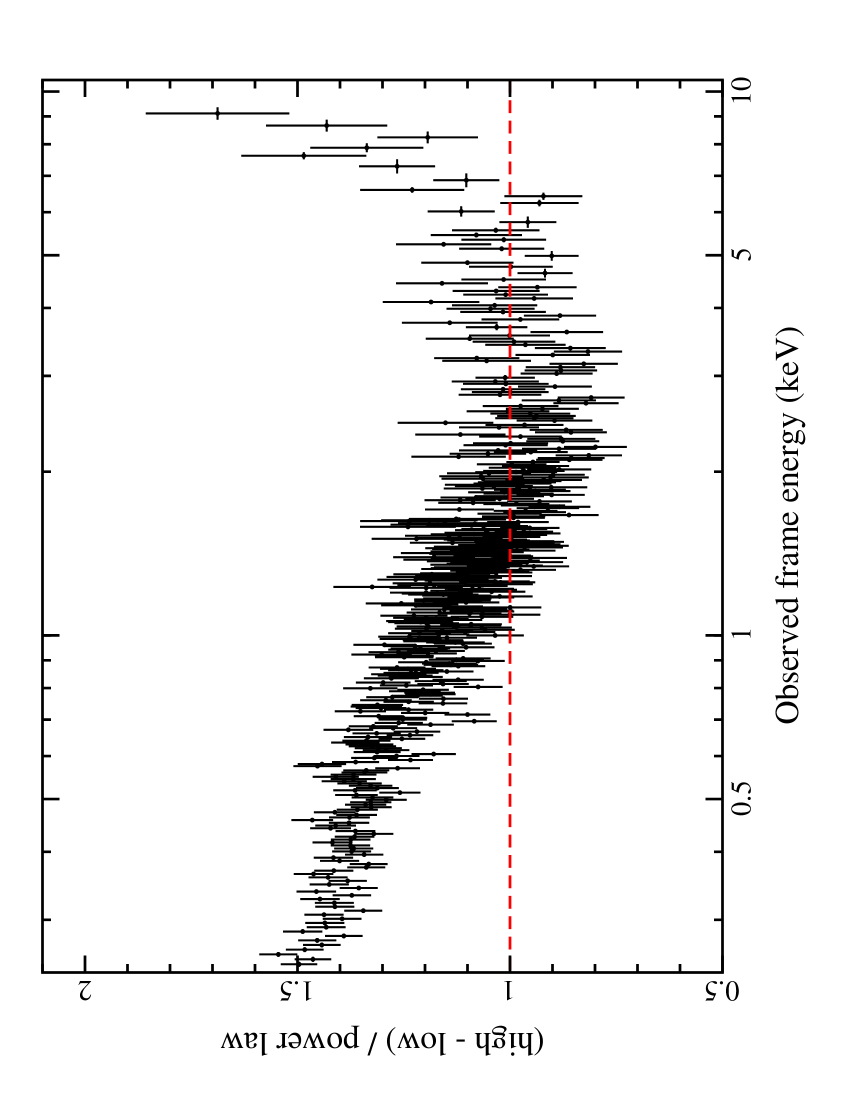
The difference spectrum (high low) also indicates complex spectral changes. A power law (), corrected for Galactic absorption, and fitted to the difference spectrum between the rest frame ( in the observed frame) band gives a good result. This high-energy band was selected as it appears to show the least amount of spectral variability according to the analysis in Sect. 3 and 4. However, there are some deviations at the highest energies. On extrapolating the power law to lower energies significant deviations are seen (Figure 7), indicating that there are changes in the spectral shape. This is supported by the different phenomenological fits found when fitting the two data sets separately (see Table LABEL:tab:fit206 and LABEL:tab:fit373).
The residuals in the difference spectrum imply changes in the shape of (at least) one spectral component. The fact that the residuals form an excess at higher and lower energies may suggest that if the variations are due to one spectral component, this component is likely not smooth in nature (like a power law), but may have some curvature (as may be expected from jet emission).
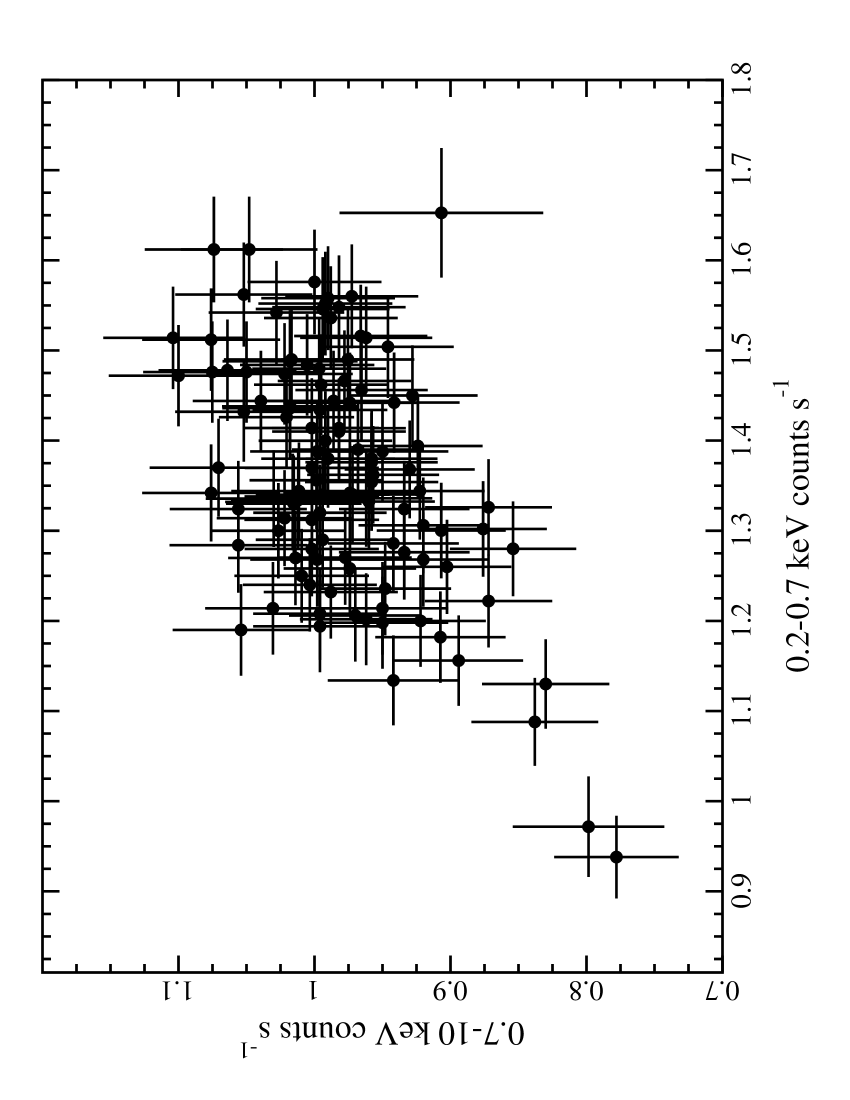
5.3 Flux-flux plot analysis
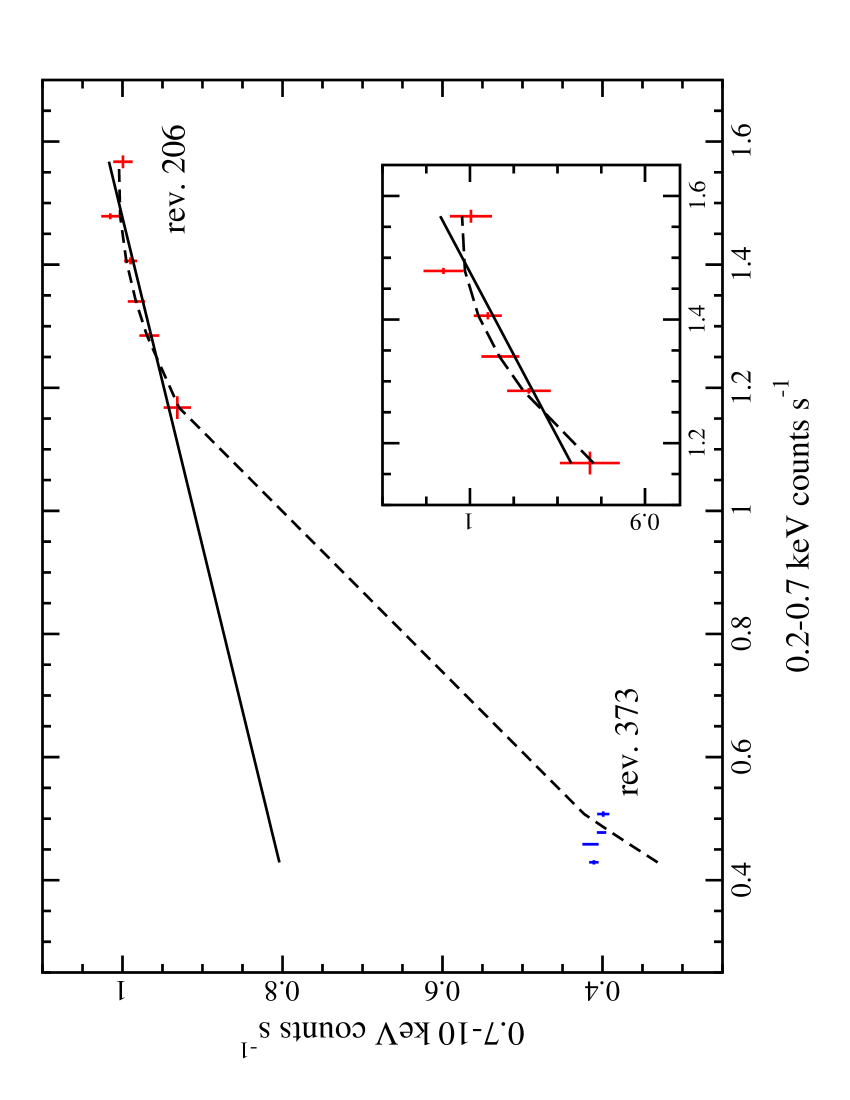
We further investigated the spectral variability by considering the correlation in the flux variations in the two energy bands used. Taylor et al. (2003) demonstrated that the flux-flux plot can be effectively used for this purpose. If the varying component of a spectrum has a constant shape (i.e. variations are due to changes in normalisation only) then the flux-flux relation will be linear. On the other hand, the relation will not be linear if the spectral shape also changes.
We constructed a flux-flux plot (Figure 8) as demonstrated by Taylor et al. (2003). In considering the variable high-flux observation, both a linear and quadratic function fit the data equally well ( and , respectively), although the quadratic fit does seem a better approximation to the data (see the inset in Figure 8).
The possible non-linearity displayed in the flux-flux plot during revolution 206 implies that the short-term (within the observation) variations are not due to a simple change in normalisation of one component, but require a change in the spectral shape as well (i.e. pivoting of the power law at high energies; e.g. Zdziarski et al. 2002). This is consistent with the flux-dependent spectral variability seen in Figure 4 and the spectral differences seen in the analyses of the high- and low-flux state spectra during revolution 206 (see Figure 5, Table LABEL:tab:206hilo, and Section 3.2.3).
Extrapolation of the linear and quadratic fits to lower count rates in the flux-flux plot showed that the quadratic fit also predicted the low-flux state of revolution 373 much better than the linear fit (Figure 8). As with the difference spectrum (Figure 7), this further emphasises that the long-term variability, which is only examined at two epochs separated by eleven months, required changes in the shape of the variable component.
6 Discussion
6.1 General Findings
The main results of this analysis are the following:
-
(1)
In comparing X-ray data from two epochs, PG 1407+265 appeared to exhibit two distinct states: a variable, high-flux state (revolution 206); and a quiescent low-flux one (revolution 373). At both epochs, a power law component with was required, while during the high-flux state an additional, steeper () power law was also needed. Significant spectral and flux variability was seen during the high-flux state, whereas during revolution 373, the variability was negligible.
-
(2)
Short-term variability (within revolution 206) and long-term variability (between the two epochs) was consistent with spectral hardening with diminishing intensity. In comparing the hard () and soft () light curves during the high-flux state, there appeared to be a short lag such that the hard energy band followed the soft by about .
-
(3)
The radiative efficiency measurement during the bright, revolution 206 observations was . The value is consistent with emission from an environment around a Kerr black hole or relativistic beaming.
-
(4)
Though not statistically significant, there appeared to be some UV variability during the high state, which showed similar trends as the X-ray light curve.
-
(5)
The optical-to-X-ray spectral slope was estimated at both epochs from simultaneous UV data, and found to be significantly flatter during the brighter X-ray phase. UV variability between the two epochs was within about and typical for quasars, whereas the average broadband X-ray flux changed by about .
6.2 The physical nature of the X-ray emission
The broken power law and blackbody plus power law models presented thus far are informative. For example, both models illustrated significant spectral variability between the two epochs, as well as on shorter time scales during revolution 206, but they lack physical intuition. A sudden break in a power law, or a high and variable blackbody temperature, appears unphysical.
In this section we attempt to derive a physically motivated model for the spectral behaviour of PG 1407+265. In doing so, we demand that all the different spectra can be fitted by a physically consistent model. This means that we not only attempt to describe the spectra at both epochs with a consistent model, but also the high- and low-flux spectra during revolution 206. Consequently, the fits in this section include three rather than two data sets (high-flux revolution 206; low-flux revolution 206; lowest flux revolution 373). For simplicity, we use only the pn data in this section.
As opposed to a broken power law, a double power law does have physical foundation. Initially we fit all three spectra with a double power law model. We required that the photon indices were constant in each spectrum and allowed only the normalisations to vary. This provided a good fit to the data () and illustrated how the hard power law component dominated during the lowest flux state (revolution 373) and the steeper component became more relevant with increasing flux.
We continued to build on this by also fixing the normalisation of the hard power law to be constant in all three spectra. Therefore, the only variable component at each epoch was the normalisation of the soft power law. This provided a slightly worse, but still acceptable fit (). The hard power law component () was essentially established by the revolution 373 spectrum. The contribution of the steep power law () component to the total spectrum during revolution 373 was negligible. However, as the flux increased, the contribution of soft component became more important. In the highest flux state (high state during revolution 206) the steep component was attributed to of the unabsorbed, flux, diminishing slightly to in the low-flux spectrum of revolution 206, and completely negligible () at revolution 373.
It is interesting that this simple double power law model provides a reasonable fit to three different spectra. As seen throughout the paper, the soft component was more variable on short and long time scales. The fastest time scales at which we would expect to see variations associated with the accretion disc, would be on dynamical time scales (). For PG 1407+265, with a black hole mass of () and this corresponds to variation on the order of in the observed frame. We are clearly seeing variations on much shorter time scales.
Emission from an accretion disc could be consistent with the harder power law component. The absence of clear signatures from the disc (e.g. iron emission line, reflection component above , and variability) is not so surprising given the high luminosity () of PG 1407+265 (e.g. see Reeves & Turner 2000). In fact, the harder power law in the double power law model can be successfully replaced with a thermal Comptonisation (Titarchuk & Mastichiadis 1994) component (). In this case, the steep power law remained unchanged compared to the double power law fit. The seed photons have a temperature of and the plasma has a temperature of about . The situation is not inconsistent with predicted physical conditions, although the measured model parameters are not well constrained by the fit.
It is conceivable that the soft, variable power law component can be attributed to emission from an inner jet. The slope of the X-ray spectrum () is steeper than the radio spectrum (e.g Ulvestad et al. 2005), which argues against inverse Compton scattering as the emitting process. The steep spectrum and remarkable variability strongly favour synchrotron radiation (e.g. Wilson & Yang 2002).
The jet could be working intermittently: present and dominant during the high-flux revolution 206 observation, and absent during the later, low-flux observation. In the spectral fits presented in this section, we have demanded that the spectral slope remains constant at all epochs. This is, of course, not a necessary constraint as the X-ray slopes of jet emitting AGN are know to vary dramatically on various time scales. In fact, based on spectral modelling, we do not rule out variations in the photon index of the jet component between epochs, but note that the lack of variability seen during the low-flux state, makes the argument pointless. It should also be noted that the jet emission process is probably better described by a curved spectrum in the XMM-Newton energy range (Perlman et al. 2005). Variations in this curvature can be responsible for some of the spectral variation implied by the difference spectrum and the flux-flux plot analysis (Figure 7 and 8, respectively).
Combined jet and accretion disc models have been fitted to a number of nearby, radio-loud, unbeamed objects (e.g. Cen A, Evans et al. 2004; NGC 4261, Zezas et al. 2005), and have also been proposed to account for the apparently higher X-ray flux in beamed objects (e.g. Browne & Murphy 1987; Kembhavi 1993). The fact that neither component in PG 1407+265 appears to suffer from obscuration, favours the conception that PG 1407+265 is beamed as well (consistent with its radio jet). If the presumable lag detected between the two components (Figure 3) is attributed to light travel time delays, then the two components (likely jet base and accretion disc corona) are separated by only about . This essentially places the base of the jet inside the corona, giving credence to the idea that a jet could be replenishing the plasma reservoir with high-energy particles.
6.3 The spectral energy distribution
The spectral and short-term timing behaviour do support the notion that PG 1407+265 is being viewed pole-on (Blundell et al. 2003). This can, in principle, describe the weakness of the high-ionisation emission lines seen in the optical and UV if, as Blundell et al. describe, we are looking directly into the broad line region. On the other hand, the strong, low-ionisation Fe ii emission could be collisionally produced at large distances where the radio jet components are found ( from the core, Blundell et al. ).
The suggestion that the X-ray jet works intermittently also describes why the SED is consistent with an unbeamed continuum, assuming that the jet is more often off than on. This follows from the dramatic differences in , as measured from simultaneous X-ray and UV data, which indicate that the continuum can certainly be much flatter (apparently beamed) when the jet is on. In addition, if the X-rays are assumed to originate from the base of the jet and hence feeding the radio jet, the irregularity of the X-ray jet emission could help explain the weakness of the radio emission relative to the optical.
7 Conclusions
We have presented two XMM-Newton observations, separated by eleven months, of the radio-quiet quasar PG 1407+265. The X-ray behaviour is consistent as arising from a combination of a relativistic jet and accretion disc processes. The spectral and timing variability strongly suggest that the jet works intermittently, which could help describe some of the complexities seen in the SED of the quasar. The variations found in , measured from contemporaneous X-ray and UV data, demand the need for simultaneous, multiwavelength observations to accurately define the SED of PG 1407+265.
Acknowledgements
Based on observations obtained with XMM-Newton, an ESA science mission with instruments and contributions directly funded by ESA Member States and the USA (NASA). LCG thanks Wolfgang Brinkmann, Iossif Papadakis and the referee for helpful comments and discussion.
References
- [1] Arnaud K., 1996, in: Astronomical Data Analysis Software and Systems, Jacoby G., Barnes J., eds, ASP Conf. Series Vol. 101, p17
- [2] Chen B., 2004, XMM-Newton Calibration Documents (CAL-TN-0019)
- [3] Blundell K., Beasley A., 1998, MNRAS, 299, 165
- [4] Blundell K., Beasley A., Bicknell G., 2003, ApJ, 591, 103
- [5] Brandt W. N., Boller Th., Fabian A. C., Ruszkowski M. 1999, MNRAS, 303, L58
- [6] Browne I., Murphy D., 1987, MNRAS, 226, 601
- [7] Cirasuolo M., Celotti A., Magliocchetti M., Danese L., 2003, MNRAS, 346, 447
- [8] den Herder J. W. et al. 2001, A&A, 365, 7
- [9] Edelson R., Turner T. J., Pounds K., Vaughan S. Markowitz A., Marshall H., Dobbie P., Warwick R., 2002, ApJ, 568, 610
- [10] Elvis M., Lockman F. J., Wilkes B. J., 1989, AJ, 97, 777
- [11] Elvis M. et al. , 1994, ApJS, 95, 1
- [12] Evans D., Kraft R., Worrall D., Hardcastle M., Jones C., Forman W., Murray S., 2004, ApJ, 612, 786
- [13] Fabian A. C., 1979, Proc. R. Soc. London, Ser. A, 366, 449
- [14] Fang T., Canizares C., Marshall H., 2005, accepted by ApJ (astro-ph/0506127)
- [15] Ghisellini G., Haardt F., Matt G., 2004, A&A, 413, 535
- [16] Goldschmidt P., Kukula M., Miller L., Dunlop J., 1999, ApJ, 511, 612
- [17] Henri G., Petrucci P., 1997, A&A, 326, 87
- [18] Ivezic Z. et al. 2002, AJ, 124, 2364
- [19] Jansen F. et al. 2001, A&A, 365, L1
- [20] Kellermann K., Sramek R., Schmidt M., Shaffer D., Green R., 1989, AJ, 98, 1195
- [21] Kembhavi A., 1993, MNRAS, 264, 683
- [22] Kirsch M. 2005, XMM-Newton Calibration Documents (CAL-TN-0018-2-1)
- [23] Laor A., Bahcall J., Jannuzi B., Schneider D., Green R., 1995, ApJS, 99, 1
- [24] Leighly K., Halpern J., Jenkins E., 2004, in: AGN Physics with the Sloan Digital Sky Survey, Richards G., Hall P., eds, ASP Conf. Series Vol. 311, p277
- [25] Mason K. O. et al. 2001, A&A, 365, 36
- [26] McDowell J., Canizares C., Elvis M., Lawrence A., Markoff S., Mathur S., Wilkes B., 1995, ApJ, 450, 585
- [27] Perlman E. et al. 2005, ApJ, 625, 727
- [28] Reeves J. N., Turner M. J. L., 2000, MNRAS, 316, 234
- [29] Reimers D., Janknecht E., Fechner C., Agafonova I., Levshakov S., Lopez S., 2005, A&A, 435, 17
- [30] Shang Z. et al. 2005, ApJ, 619, 41
- [31] Strateva I., Brandt W. N., Schneider D., Vanden Berk D., Vignali C., 2005, AJ, 130, 387
- [32] Strüder L. et al. 2001, A&A, 365, L18
- [33] Taylor R., Uttley P., McHardy I., 2003, MNRAS, 342, 31
- [34] Thorne K., 1974, ApJ, 191, 507
- [35] Titarchuk L., Mastichiadis A., 1994, ApJ, 433, 33
- [36] Turner M. J. L. et al. 2001, A&A, 365, 27
- [37] Ulvestad J., Antonucci R., Barvainis R., 2005, ApJ, 621, 123
- [38] Vanden Berk D. et al. 2001, AJ, 122, 549
- [39] Wilson A., Yang Y., 2002, ApJ, 568, 133
- [40] White R. et al. 2000, ApJS, 126, 133
- [41] Yuan W., Brinkmann W., Siebert J., Voges W., 1998, A&A, 330, 108
- [42] Zdziarski A., Poutanen J., Paciesas W., Wen L., 2002, ApJ, 578, 357
- [43] Zezas A., Birkinshaw M., Worrall D., Peters A., Fabbiano G., 2005, ApJ, 627, 711